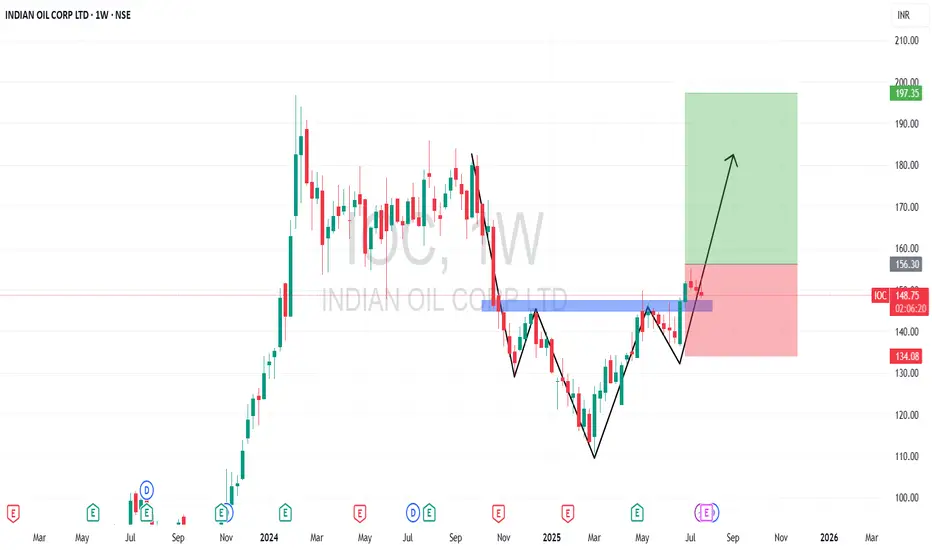
Strong Reversal Backed by Breakout and Robust Q4I am speaking about the IOC Ltd stock. Technically, I’ve been observing this stock’s chart for over two decades. In Feb 2024, it created an All-Time High at ₹197. From there, it consolidated till Sept 2024, followed by a sharp correction to ₹110 by March 2025. This ₹110 level acted as a strong demand zone and the stock rallied sharply from there.
Currently, it's trading at ₹152, forming an Inverse Head & Shoulder pattern, and the price has already broken above the neckline — a bullish signal.
🎯Targets
Target 1: ₹170
Target 2: ₹180
Target 3: ₹190
📉Stop Loss Levels
First Stop Loss: ₹135 (shoulder low)
Final Stop Loss: ₹110 (major demand zone)
💰Q4 FY24 Financial Highlights (vs Q3 FY24 & Q4 FY23)
Total Income:₹1,95,270 Cr (↑ flat vs ₹1,94,014 Cr; ↓ -2% vs ₹1,98,650 Cr)
Total Expenses: ₹1,80,241 Cr (↓ -3% vs ₹1,86,442 Cr; ↓ -4% vs ₹1,86,675 Cr)
Operating Profit: ₹15,029 Cr (↑ +98% vs ₹7,573 Cr; ↑ +25% vs ₹11,975 Cr)
Profit Before Tax: ₹10,045 Cr (↑ +263% vs ₹2,766 Cr; ↑ +35% vs ₹7,420 Cr)
Profit After Tax: ₹8,368 Cr (↑ +290% vs ₹2,147 Cr; ↑ +52% vs ₹5,488 Cr)
Diluted EPS: ₹5.75 (↑ from ₹1.50 QoQ; ↑ from ₹3.65 YoY)
🧾Fundamental Insights
🛢️IOC has benefited from softening crude oil prices and improved gross refining margins (GRMs), leading to better operating performance.
📦Strong inventory gains and better refining throughput also contributed to profitability.
💵The company declared a final dividend of ₹7 per share for FY24, rewarding shareholders amid solid earnings.
🏭Capex plans continue across petrochemical expansions and refinery upgrades, securing long-term growth.
🌱The management also highlighted a push toward energy transition — expanding green hydrogen and EV charging infrastructure.
Conclusion:
IOC Ltd is showing a strong technical breakout and backed by solid fundamentals in Q4. If the bullish pattern sustains, investors may see a retest of all-time highs in coming weeks.
Disclaimer: lnkd.in
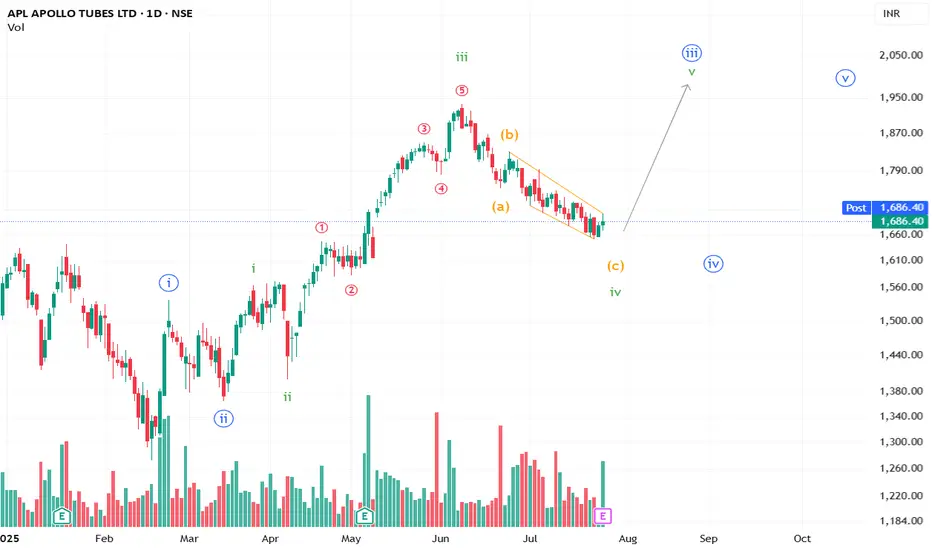
APL Apollo Tubes Limited Set to Surge?A well-formed ABC correction to the downside appears to be losing steam, and an upward move may take shape.
**This is an educational market outlook, not investment advice. Please consult a SEBI-registered advisor before taking any investment decisions.**
Bullish View In TCS Mark The Date & Price 24.7.25 CMP Is 3150Tata Consultancy Services (TCS) is one of the largest IT services companies globally and a flagship of the Tata Group. Here's a **detailed overview of the TCS business model**:
---
## 🧩 **TCS Business Model**
### 1. **Core Business**
TCS operates primarily as an **IT services, consulting, and business solutions company**. It provides a wide range of services across various domains using a **global delivery model**.
---
### 2. **Revenue Streams**
TCS generates revenue mainly through:
| Revenue Stream | Description |
| ----------------------------------- | ------------------------------------------------------------------------------------ |
| **IT Services** | Application development, maintenance, infrastructure, testing, and managed services. |
| **Consulting** | Business strategy, IT consulting, enterprise transformation. |
| **Digital Services** | AI, IoT, Blockchain, Cloud, Cybersecurity, and Analytics. |
| **Business Process Services (BPS)** | Outsourcing services like finance, HR, and customer care. |
| **Platform-Based Services** | Products like TCS BaNCS (banking), Ignio (AI/automation), and CHROMA (HR). |
---
### 3. **Target Industries**
TCS serves a broad range of industries, including:
* **Banking, Financial Services, Insurance (BFSI)** – \~40% of revenue
* Retail & Consumer Goods
* Telecom & Media
* Manufacturing
* Healthcare & Life Sciences
* Energy & Utilities
* Public Services & Government
---
### 4. **Delivery Model**
**Global Network Delivery Model (GNDM)** is TCS's key competitive advantage. It means:
* 24x7 service from global delivery centers
* Mix of onsite and offshore teams
* Cost-efficient and scalable delivery
---
### 5. **Geographic Presence**
* **North America** – Largest market (50%+ revenue)
* Europe
* India
* Asia-Pacific
* Middle East & Africa
---
### 6. **Innovation & R\&D**
TCS invests in innovation through:
* **TCS Research Labs** (AI, ML, quantum computing)
* **COIN™ (Co-Innovation Network)** – Collaborates with startups, academia, and customers
---
### 7. **Human Resources**
* 600,000+ employees globally
* Focus on training and upskilling (TCS iON, Elevate)
* High employee retention (among the best in industry)
---
### 8. **Key Clients**
TCS serves:
* Over **1,000 clients globally**
* 58 clients with \$100M+ annual revenue
* Long-term contracts, often >5 years
---
### 9. **Digital Transformation Projects**
TCS helps companies adopt:
* Cloud migration (via AWS, Azure, Google)
* ERP systems (SAP, Oracle)
* Industry 4.0 and automation
---
### 10. **Cost Structure**
* Major costs: Human resources, tech infra, R\&D
* Operates at high profit margins (\~24% EBIT margin)
---
### 🏆 **Strengths of TCS**
* Strong brand and Tata legacy
* Scalable and diversified portfolio
* Consistent financial performance
* Client stickiness and long-term contracts
---
Thanks

BLACKBUCK (zinka logistic sol ltd)BLACKBUCK (zinka logistic sol ltd), this stock is creating very good bullish pattern and currently giving breakout of given pattern. this has good potential. review this.

GAIL Bullish way ahead?!!!Chart patterns suggest me the above titled opinion
1. Its is travelling in a Ascending channel pattern making Higher highs and higher lows .
2. Now it is at the bottom support loading for the explosive move ahead.
3. Let's wait for the Breakout and enter.
Target levels mentioned in chart...SL update after breakout.
Longer time frames also shows the bullish edge in GAIL
This is just my opinion..... not a tip nor advice!!!!
Thank you!!!

Kalyan Jewellers - Stock reaching a critical zoneAs we can see the area between 590 - 595 will possibly be the most critical area in the upcoming days
If at all it sustains we will see the upside of up to 620 or beyond in future times
If it breaks the a pullback and stock may not hesitate to fall up to 560 or even below
Keep this are in your alert zone for upcoming days
Stock may present some fantastic option trading opportunities

Sbilife Getting ready for the rally ahead?!!!Chart patterns suggest me the above titled opinion
1. Weekly time frame shows a three white soldiers (month of april 2025) with good volume support....now the consolidation happening
2. In daily time frame, it is travelling in a expanding channel pattern , currently at the support line at the bottom
3. We need a confirmation for the rally with a Breakout candle....which we can expect during the result release.
4.If we make our entry now, we can make our stoploss as daily candle close out of the channel
5. Best entry is to wait for the Breakout and enter with SL below the breakout candle
6.Target levels as mentioned in the chart.
With strong fundamentals and decent valuations, Sbilife is one of the best options for long term bet in the insurance sector!!!
This is just my opinion ....not a tip nor advice..
Thank you!!!!

INDIAN BANKINDIANB is showing a strong bullish structure, as the stock has been moving within a well-defined, upward-sloping channel, indicating a consistent bullish trend. Price recently tested the lower boundary of the channel and rebounded strongly—indicating demand at that level. A short-term rectangle consolidation formed near the upper part of the channel. Concentrate if the stock sustains above 658 with the targets of 678 and 700

LICI what will happened next 1. ek acha support hai per support ke near gap hai esi lye price us gap ko fill Karna aa Shakta hai for fresh buying
2. price ko agar wo level break Karna Hai to wo Gap down se hi ho payega

INDIANB Price ActionAs of July 24, 2025, Indian Bank (INDIANB) is trading around ₹639, showing strong momentum after recovering from recent declines. The stock is close to its 52-week high of approximately ₹658, indicating a robust upward trend in the public sector banking space.
The bank has demonstrated consistent financial growth, with a 14% year-on-year increase in both deposits and advances, currently standing above ₹63,000 crore and ₹53,000 crore respectively. Total business volume grew to over ₹1.16 lakh crore. Net profit for the last financial year increased by 11% to around ₹1,124 crore.
Asset quality has improved, with gross non-performing assets (NPA) reducing to 3.09% and net NPA to 1.25%. The provision coverage ratio is strong at 78%, reflecting prudent risk management. Net interest margin (NIM) is stable at approximately 3.6%, supporting healthy core profitability. The cost-to-income ratio is near 48%, indicating moderate operational efficiency.
Return on assets (ROA) and return on equity (ROE) stand around 1.55% and 12.6% respectively, highlighting solid returns relative to asset base and shareholder equity. Capital adequacy ratios remain comfortable under Basel III norms.
Technically, Indian Bank’s stock is trading above major moving averages (5, 20, 50, 100, 200 days), confirming positive price momentum. Year-to-date, the stock has delivered over 21% returns, outperforming many peers in the public sector banking segment.
Overall, Indian Bank presents a strong growth and stability profile with improving asset quality, stable margins, and expanding business volumes, making it an attractive candidate in the public banking sector for medium to long-term investors.

Cartrade tech price action analysisBased on the available information, here's an analysis of CarTrade Tech Limited's (CARTRADE) price action and financial performance:
## Recent Performance
CarTrade Tech Limited has shown strong financial performance in its latest quarterly report. For Q3 FY2024, the company reported:
- Revenue increase of 45% year-over-year, reaching ₹400 crore (USD 48 million)
- Operating income of ₹100 crore (USD 12 million), up 60% from the previous year
- Net profit surge to ₹50 crore (USD 6 million), a 70% increase year-over-year
The company's third-quarter 2025 earnings exceeded analyst expectations, with revenue beating estimates by 5.2% and earnings per share (EPS) surpassing forecasts by 41% .
## Market Position
CarTrade Tech maintains a strong position in the Indian online automotive marketplace:
- 25% market share in the online used car segment as of 2024
- Targeted 15% growth in marketplace transactions year-over-year
- Plans to expand offerings of electric and hybrid vehicles by 30% by mid-2024
## Future Outlook
Analysts have provided the following price targets for CARTRADE:
- Price target: ₹1,689.00
- Maximum estimate: ₹1,934.00
- Minimum estimate: ₹900.00
Revenue is forecast to grow at 15% per annum, indicating continued expansion .
## Investment Potential
CarTrade Tech has been identified as one of the top stocks that could potentially offer 15-30% returns in 2025, according to Nomura . This suggests positive sentiment among analysts regarding the company's future performance.
Given the company's strong financial results, market position, and positive analyst outlook, CARTRADE appears to be in a favorable position for potential price appreciation. However, investors should conduct their own due diligence and consider market risks before making investment decisions.

BBL(Bharat Bijlee Limited) A Potential Up moveBBL after respecting Daily order block and sweeping liquidity in at price 2350, is forming a good bullish structures, BBL is forming positive order flow. If BBL keep following these order blocks/demand zone BBL can give good up move.
Key levels:
1. Current price good area for making entries with stop loss below 2975 levels.
2. If price fail to sustain above levels, there is pending order block at level 2888 with stop loss below 2775.
our first target would be trend, then 4670, 4950 and ATH.
Please do your own analysis, check your confluences and do your research before making any financial decisions.

Zuari Price ActionAs of July 24, 2025, Zuari Agro Chemicals Ltd is trading around ₹215 to ₹218 per share. The stock has shown a recent slight decline of about 1.27% on that day. Its market capitalization is approximately ₹900 crore, placing it among the mid-sized chemical and fertilizer companies.
The 52-week price range for Zuari Agro Chemicals is between ₹169 and ₹268, reflecting moderate volatility over the past year. The stock is trading closer to the lower-middle part of this range, about 18–20% below its 52-week high.
Fundamentally, the company demonstrates reasonable valuation metrics, with a price-to-earnings (P/E) ratio near 5.5, which is quite attractive compared to the sector average, and a price-to-book (P/B) ratio below 0.5, indicating it is trading at a significant discount to book value. Recent earnings per share show solid growth, contributing to strong profitability metrics.
Operationally, Zuari Agro Chemicals continues to build stable revenues within the fertilizers segment, benefitting from sectoral demand and government policies supporting agriculture inputs. The company maintains average financial strength with ongoing measures to reduce debt and improve operational efficiency.
On the technical front, the stock has experienced some consolidation after modest gains over recent months but remains vulnerable to market sentiment shifts in the commodity and fertilizer sectors.
Overall, Zuari Agro Chemicals offers a fair valuation entry for investors seeking exposure to the fertilizer industry with moderate risk. The current price implies value relative to its historical range, supported by steady earnings, though the stock price is subject to volatility driven by agricultural commodity cycles and sector-specific factors.

City Union Bank Price ActionAs of July 2025, City Union Bank (CUB) continues to demonstrate steady growth and operational strength. The stock is supported by robust business expansion and stable profitability.
The bank’s annual financials for FY 2025 show a 14% year-on-year growth in both deposits and advances, with deposits rising to over ₹63,500 crore and advances to approximately ₹53,000 crore. Total business crossed ₹1.16 lakh crore. Net profit for the year reached ₹1,124 crore, up 11% from the previous year. The return on assets (ROA) stands at 1.55%, while return on equity (ROE) is 12.63%, indicating efficient use of both assets and capital.
Asset quality remains healthy and improved, with gross non-performing assets (NPA) at 3.09% and net NPA at 1.25%, both lower than the previous year, while the provision coverage ratio is strong at 78%. The bank’s net interest margin is stable at 3.6%, reflecting consistent core banking profitability.
The cost-to-income ratio is 47.8%, at the higher end of the management’s guidance, reflecting ongoing investments in retail expansion. Capital adequacy (CRAR) remains robust at 23.75%, providing ample buffer for future growth.
Overall, CUB combines above-industry growth, improving asset quality, solid margins, and prudent capital management. The stock’s outlook is supported by management’s consistent delivery across business and profitability metrics, though investors should monitor sector-wide risks and the impact of retail investment costs on near-term efficiency.

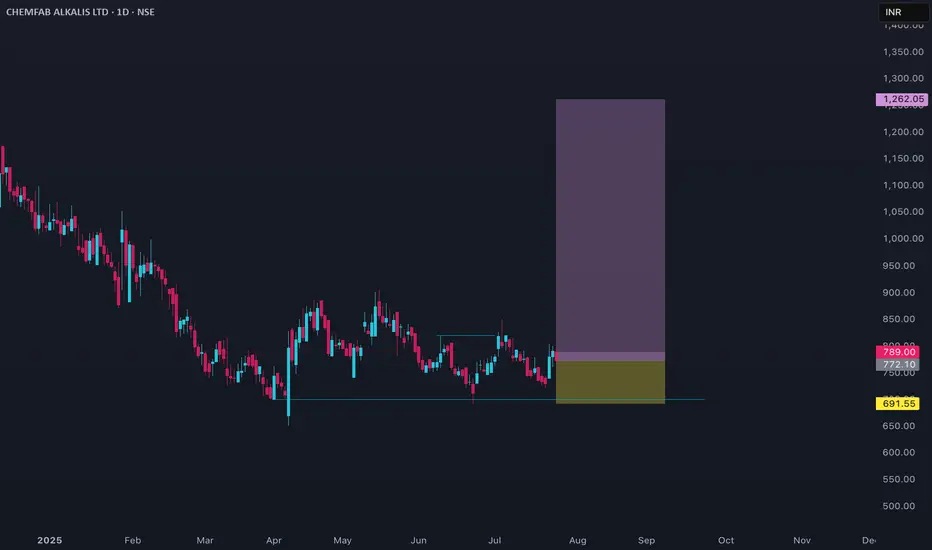
CHEMFAB Price ActionAs of late July 2025, Chemfab Alkalis Ltd is trading near ₹789 with recent price movements signaling some short-term recovery after a significant correction from the past year’s highs. The stock’s 52-week range is ₹650 to ₹1,230, reflecting substantial volatility over the past twelve months.
Chemfab’s market capitalization stands close to ₹1,130 crore, classifying it as a small-cap chemical manufacturer. The company specializes in basic inorganic chemicals and PVC-O pipes, mainly serving industries that require chlor alkali products.
Financially, recent results show net sales of about ₹92 crore for the March 2025 quarter, a year-on-year increase of roughly 12%. Despite this sales growth, profitability is under pressure, with negative trailing earnings; the latest EPS is around –₹4.8, resulting in a negative P/E ratio. The price-to-book ratio is almost 3, indicating the stock is priced at a premium to its book value. Return on capital employed and return on equity remain low, consistent with current profit margins.
In recent months, the stock’s price trend has been weak, down nearly 17% over six months and over 5% for the past three months, despite a near 7% rise in the last week. Liquidity and trade volumes are moderate and typical for its peer group.
Key risks include limited profit momentum, historically low return ratios, and high valuation multiples given the negative earnings. However, the company maintains a stable balance sheet, low financial leverage, and gradual growth in its core segment.
Chemfab Alkalis is best suited for investors interested in turnaround or deep value plays within the specialty chemicals sector, but caution is warranted because of volatile earnings and the stock’s premium to book value even amid operational challenges.
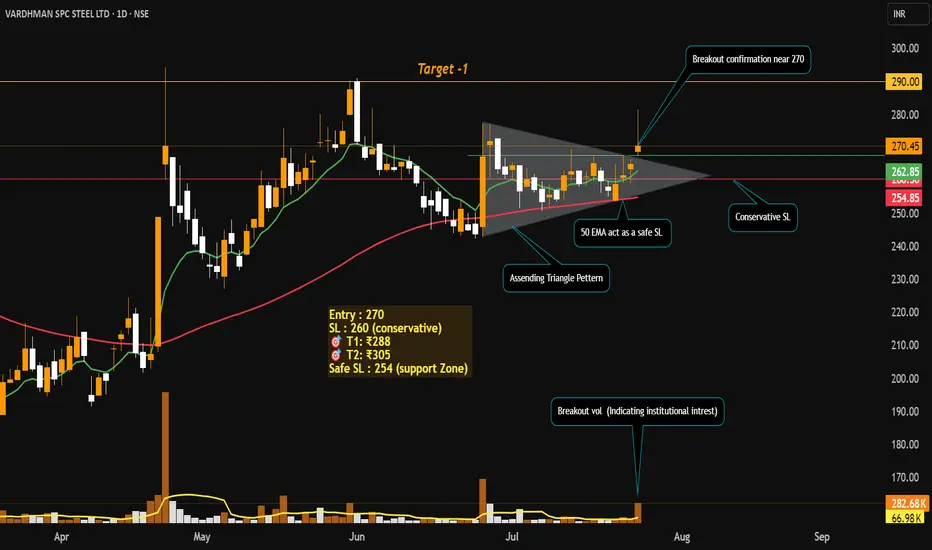
Swing Trade Idea: Vardhman Special Steels Ltd (NSE: VSSL)Technical Setup
Ascending Triangle Breakout on Daily Timeframe
Volume Spike 4x average volume on breakout day — strong institutional confirmation.
both the EMAs Bullish crossover (Price trading above both the EMAs).
RSI showing bullish momentum (60-65).
Price Action Strategy
Price broke out from resistance zone with strong bullish candle and closed near the high.
Previous resistance of ₹270 now acts as support.
Fundamentals
Promoter Holding: High, backed by Aichi Steel (Toyota Group).
Debt/Equity: Low (~0.12) → Strong solvency.
Strong financials: ROE / ROCE ~12.4% / ~17.8%
Revenue Growth: Consistent YoY
Valuation: Reasonable P/E (~18–20x)
My View: Entered at breakout with strong confirmation. Trail SL and book profits step-by-step. Holding for higher targets as long as price respects 9 EMA.
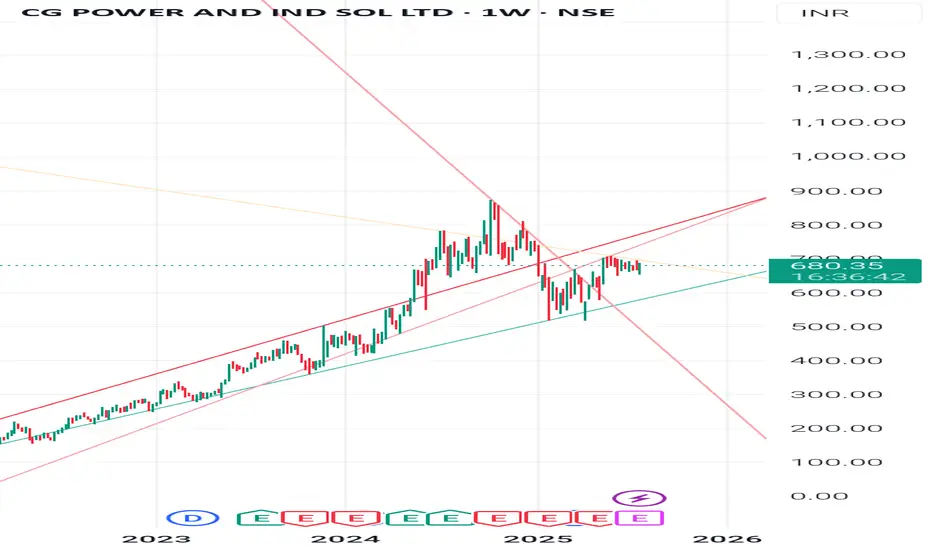
CG power : keep adding 6670
Stock is given good results and it is trading above the demand zone.
Enter with long term views if 1250 in 1.5 years. Enter around 660,645, 600
Sl? 533

ICICI bank : Go long 1390-85Keep adding this bank giant with long term investment view - enter with small quantity @ 1400, 1370 holding sl 1250
We may expect it 2000, 2200 in around a year.
Accumulation strategy might workin such a big stocks.

Investment case BANK OF MAHARASTHRA
Guiding for 14-17% of growth for coming years.
Promoter stake is more than 75%, so future QIP window's can be good opportunities.
Recommeded investing pattern - Staggered, SIP over next 2 quarters.
Downside - 8%, Upside -22% (Bull case - 35%)

Krishana Phoschem Ltd – Fresh Breakout + Earnings StrengthAfter a strong uptrend since March 2025, Krishana Phoschem Ltd has now broken out of a falling trendline resistance, signaling continuation of its bullish journey.
📉 Chart Analysis – Bullish Breakout Setup
✅ Structure: Falling trendline breakout
✅ Breakout Zone: ₹520
✅ Measured Move Target: ₹570+ (based on 10% projected move)
✅ Trend: Strong Higher Highs / Higher Lows
✅ Volume spike likely supported today’s move
The stock showed resilience after a steep rally and formed a healthy flag/pennant-like consolidation. The breakout now hints at the next leg of the uptrend.
📊 Fundamental Strength – Q1 FY26 Earnings Snapshot
The company reported a robust 41% YoY growth in revenue to ₹396 Cr, while EBITDA surged 57% YoY to ₹65.6 Cr.
Net Profit jumped 86% YoY to ₹30.6 Cr, highlighting operational efficiency.
EPS nearly doubled to ₹5.05 from ₹2.71, reflecting solid bottom-line growth.
Margins remain healthy, showing profitability is improving alongside scale.
Strong execution and cost control continue to drive performance momentum.
🧠 Summary
📈 Technical breakout with strong momentum.
🔢 Backed by robust YoY earnings growth and expanding margins.
🎯 Targeting ₹570+ with a short-term stop loss below ₹495 (on a daily close basis).
🛑 Wait for follow-up confirmation candle if you're risk-averse.
⚠️ Disclaimer
This content is for educational purposes only and should not be considered investment advice. Please consult a registered financial advisor before making any investment decisions. I am not SEBI registered.

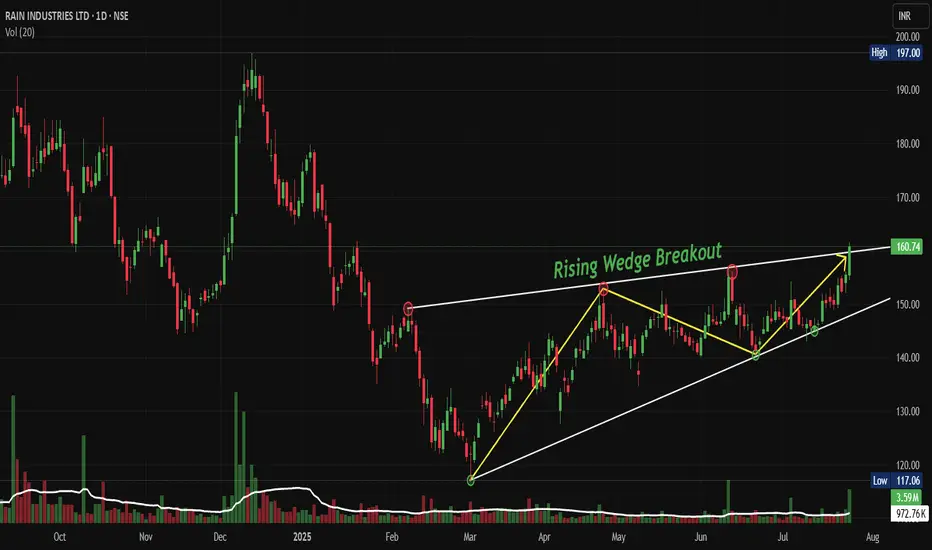
RAIN: Breaks Out of Rising Wedge Pattern Signals Fresh UptrendNSE:RAIN Breaks Out: Rising Wedge Pattern Signals Potential Bullish Run to 180+ Levels
Signals Fresh Uptrend After Months of Consolidation
Price Action:
- NSE:RAIN has been trading within a well-defined rising wedge pattern since March 2025
- The stock has recently broken out above the upper trendline of the wedge at approximately 160 levels
- Current price of 160.74 represents a significant move above the key resistance zone
- The breakout is accompanied by increased volume, suggesting genuine buying interest
Volume Spread Analysis:
• Volume breakout accompanied the wedge pattern breakout
• Higher volumes during up moves compared to down moves indicate bullish participation
• Volume spike visible during the recent breakout at 160+ levels
• Average volume of 972K around today, 3.59M shares with recent surge to higher levels
Base Formation and Accumulation Zone:
• The stock established a strong base between 117-125 levels from March to July 2025
• Multiple retests of the 117 support level showed strong buying interest
• Base formation lasted approximately 4 months, indicating thorough accumulation
• Volume during base formation remained relatively stable with occasional spikes
Key Support and Resistance Levels:
• Primary Support: 117.06 (marked as swing low and base support)
• Secondary Support: 140-145 zone (previous resistance turned support)
• Immediate Resistance: 165-170 zone (next major hurdle)
• Target Resistance: 180-185 zone (measured move target)
• 52-week High: 197.00 (ultimate resistance level)
Technical Patterns:
Rising Wedge Breakout Pattern:
• Clear rising wedge pattern formed over 4-5 months
• Lower highs and higher lows converged into a wedge formation
• Breakout occurred at 160+ levels with strong volume confirmation
• Pattern suggests continuation of the broader uptrend
Trend Analysis:
• Long-term trend: Bullish (higher highs and higher lows since March 2025)
• Medium-term trend: Bullish breakout from consolidation
• Short-term trend: Strong bullish momentum post-breakout
• Moving averages alignment suggests sustained upward momentum
Chart Patterns and Indicators:
• Cup and handle formation visible in the broader timeframe
• Multiple flag patterns during the consolidation phase
• Price above all key moving averages, indicating bullish sentiment
Trade Setup and Strategy:
Entry Levels:
• Aggressive Entry: 155-160 levels (on any minor pullback)
• Conservative Entry: 145-150 levels (on deeper retracement to support)
• Breakout Entry: Above 165 levels with volume confirmation
• averaging between 150-160 for position building
Exit Levels and Targets:
• Target 1: 180-185 levels (initial profit booking - 15-20% upside)
• Target 2: 195-200 levels (testing previous highs - 25-30% upside)
• Target 3: 220-230 levels (extended target - 40-45% upside)
• Swing high exit: Trail stops below key support levels
Stop-Loss Strategy:
• Initial Stop-Loss: Below 140 levels (10-12% risk from current levels)
• Trailing Stop-Loss: Below 150 levels once 180 is achieved
• Pattern Stop-Loss: Below the wedge support around 145 levels
• Time-based stop: Exit if no progress in 2-3 months
Position Sizing and Risk Management:
• Maximum position size: 2-3% of total portfolio
• Risk per trade: Not more than 1% of portfolio value
• Scale in approach: 50% at entry, 30% on dip, 20% on breakout confirmation
• Maintain a risk-reward ratio of a minimum of 1:3
Sectoral and Fundamental Backdrop:
Company Overview:
• NSE:RAIN is one of the world's largest producers of calcined petroleum coke, coal tar pitch and other high-quality basic and speciality chemicals
• Market Cap: 5,405 Crore with Revenue: 15,472 Cr
• Promoter Holding: 41.2% indicating stable management control
Financial Health Assessment:
• The company has a low interest coverage ratio, which poses some financial risk
• Net Profit: ₹-115.10Cr as on March 2025 (Q4 FY25) showing current losses
• The company has delivered a poor sales growth of 4.46% over the past five years
• Recent debt reduction efforts as management focuses on prepaying obligations
Business Segments Performance:
• Carbon Business: Environment-friendly and energy-efficient practices have made RAIN's carbon business highly profitable and sustainable
• The carbon business co-generates energy at six calcined petroleum coke plants with a combined power-generation capacity of approximately 135 MW
• The speciality chemicals segment is showing resilience despite market challenges
Sector Outlook and Industry Trends:
• In 2025, the industry is expected to continue its recovery, adjusting to new market drivers while balancing short- and long-term goals
• Chemical industry focusing on decarbonization and innovation initiatives
• India Ratings affirms Rain Industries' credit rating at IND A/Stable with stable outlook and improved operational outlook
Key Risk Factors:
• Cyclical nature of the chemical industry affecting margins
• High debt levels and interest coverage concerns
• Global economic slowdown has an impact on demand
• Raw material price volatility
• Environmental regulations affecting operations
Positive Catalysts
• Debt reduction strategy showing management commitment
• Stable credit rating with improved operational outlook
• Strong technical breakout indicating renewed investor interest
• Global chemical industry recovery supporting sector sentiment
• Energy co-generation capabilities providing cost advantages
Risk Assessment and Monitoring:
Key Levels to Watch:
• Break below 145: Bearish signal, consider exit
• Sustain above 165: Bullish confirmation for higher targets
• Volume patterns: Declining volume on up moves would be concerning
• Sector rotation: Monitor chemical sector performance relative to the broader market
Regular Review Parameters:
• Weekly closing above key moving averages
• Monthly volume trends and institutional participation
• Quarterly earnings performance and guidance
• Industry developments and regulatory changes
• Management commentary on debt reduction progress
Exit Triggers:
• Fundamental deterioration in business metrics
• Break of key technical support levels
• Adverse sector developments
• Better opportunities in other stocks/sectors
• Achievement of target levels with profit booking
My Take:
NSE:RAIN presents a technically attractive setup with the rising wedge breakout, but investors should be cautious about the fundamental challenges. The trade setup offers good risk-reward ratios for short to medium-term positions, while long-term investors should wait for clearer signs of fundamental improvement.
Keep in the Watchlist and DOYR.
NO RECO. For Buy/Sell.
📌Thank you for exploring my idea! I hope you found it valuable.
🙏FOLLOW for more
👍BOOST if you found it useful.
✍️COMMENT below with your views.
Meanwhile, check out my other stock ideas on the right side until this trade is activated. I would love your feedback.
Disclaimer: "I am not a SEBI REGISTERED RESEARCH ANALYST AND INVESTMENT ADVISER."
This analysis is intended solely for informational and educational purposes and should not be interpreted as financial advice. It is advisable to consult a qualified financial advisor or conduct thorough research before making investment decisions.
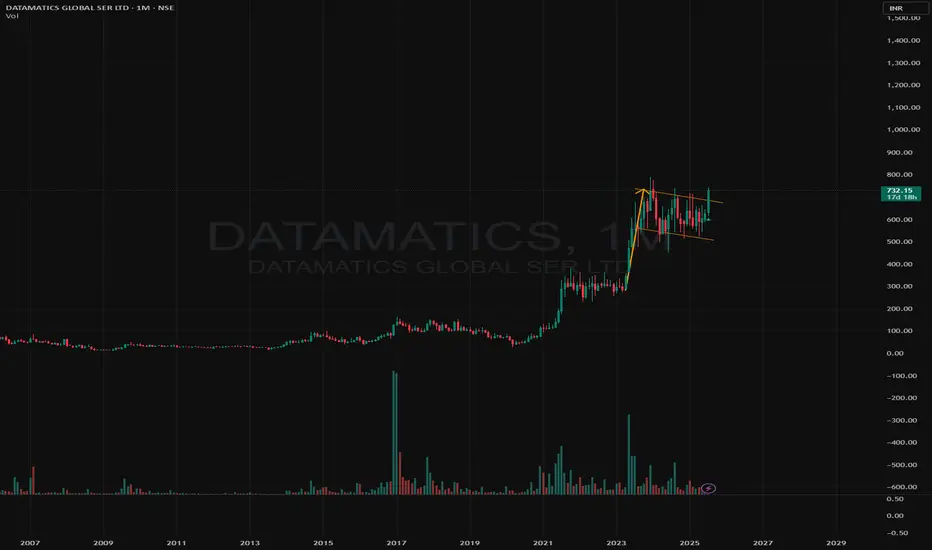
Datamatics Flag Breakout in Monthly TF !!Datamatics has given a Flag & Pole Breakout in Monthly TF !!
CMP:730
Dip: 660
Tgt: 800,900,950+
SL: 530
Chart is only for Educational Purpose !!
EFC (I) Ltd – Breakout in Motion | Strong Fundamentals + Clean C## 📈 **EFC (I) Ltd – Breakout in Motion | Strong Fundamentals + Clean Chart Setup**
EFCIL has just broken out of a **major horizontal resistance zone** around ₹345–350 after multiple rejections in the past. This breakout appears technically strong and is supported by impressive fundamentals.
---
### 🔍 **Technical Chart Setup**:
✅ **Breakout Zone**: ₹348
✅ **Structure**: Horizontal resistance breakout
✅ **Target**: ₹383+ (based on breakout height)
✅ **Stop Loss**: ₹334 (on daily close basis)
✅ **Bias**: Bullish as long as price sustains above ₹345 zone
✅ **Candle Confirmation**: Strong bullish breakout with volume
---
### 🏢 **Fundamental Tailwinds**:
EFC (I) Ltd is a **Real-Estate-as-a-Service** company with offerings in coworking spaces, interior contracting, leasing, and furniture solutions. It operates \~2.25 million sq. ft. across 57 centers in 7 Indian cities.
📊 **Q1 FY26 Snapshot**:
* 📈 Revenue: ₹957.6L (↑36% QoQ | ↑360% YoY)
* 💰 PAT: ₹654.6L (↑28% QoQ | ↑125% YoY)
* 🧾 EPS: ₹0.66
* 💼 Strong operational leverage and rising demand for managed office solutions
---
### 📌 **Conclusion**:
> A strong earnings-backed breakout with a clear technical structure. If it retests and sustains above ₹345, the stock may rally toward ₹383+ in the near term. Keep it on watch for follow-through price action.
---
### ⚠️ **Disclaimer**:
This analysis is for **educational and informational purposes only**. It does **not constitute investment advice or a recommendation**. Please consult your financial advisor and do your own research before making any investment decisions. I am not SEBI registered.
