INVITE-ONLY SCRIPT
Zeal Trade Helper
Updated
Once you have mastered a trading strategy, risk management is the most important aspect of trading that will enable and long and successful trading career. The Zeal Trade Helper is based on Van Tharp's theory of R. It provides an immediate visual trading plan, as well as sizing parameters for trading equity and options (.25 and .50 deltas) based on a number of inputs to help you avoid needing to do quick mental math in the moment of taking a trade.
HOW TO USE
- First, you will need to input your R value. To find your R value, divide your **average green day** by the **average number of trades you take in a day**. Once you have this number, enter it into the "Your R Value" field in the indicator settings.
- The indicator settings then provides you with 5 different setup entries. When you have your watchlist ready for the day, simply go through and choose the specific stock, enter your entry price, stop loss, target, and setup type (build, short, bounce, or reject).
OUTPUTS
**Trading Plan**
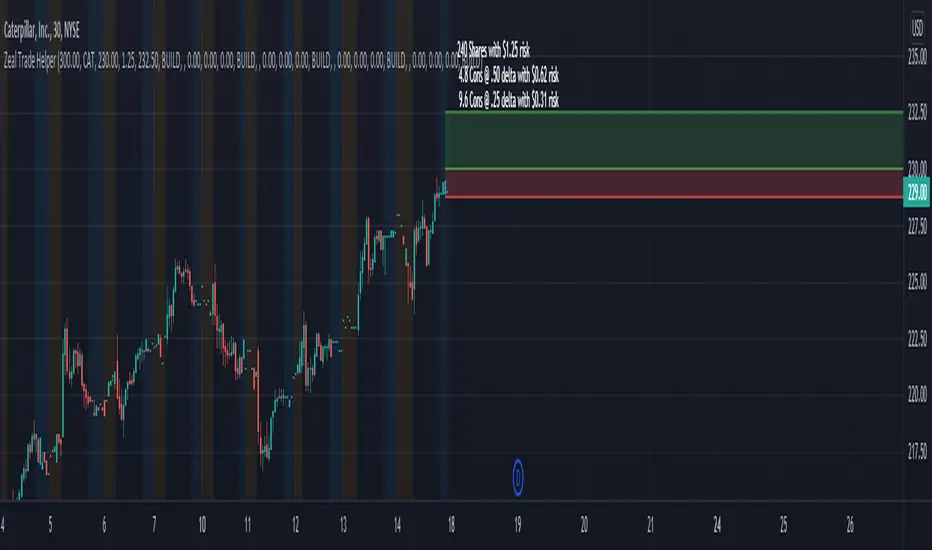
The indicator will display a visual trading plan based on the inputs you entered on each individual stock's chart. The trading plan will have a green box and red box to represent your entry, target, and stop loss.
**Risk Parameters**
The indicator will also display text outlining what your risk parameters and sizing should be for the trade based on your R value. You will see 3 different lines: the first line showing the number of shares you can trade, the second line showing the number of option contracts you can trade at .50 delta, and the third line showing the number of option contracts you can trade at .25 delta. For reference, at the money options are .50 deltas. Even if you aren't trading exactly .50 or .25 deltas, these values will still help as a frame of reference in the moment of putting on the trade.
**Note that you can toggle the appearance of either of these outputs by checking/un-checking the boxes next to "Display trading plan" and "Display risk parameters" in the indicator settings.
Examples:
1. "**240 shares with $1.25 risk**" means you can take 240 shares and risk $1.25 on the share's price based on your R value
2. "**4.8 Cons @ .50 delta with $0.62 risk**" means you can take either 4 or 5 at the money option contracts and risk $0.62 **on the option contract's value** based on your R value
3. "**9.8 Cons @ .50 delta with $0.31 risk**" means you can take either 9 or 10 option contracts that have a .25 delta (a bit out of the money) and risk $0.31 **on the option contract's value** based on your R value
Happy Trading!
HOW TO USE
- First, you will need to input your R value. To find your R value, divide your **average green day** by the **average number of trades you take in a day**. Once you have this number, enter it into the "Your R Value" field in the indicator settings.
- The indicator settings then provides you with 5 different setup entries. When you have your watchlist ready for the day, simply go through and choose the specific stock, enter your entry price, stop loss, target, and setup type (build, short, bounce, or reject).
OUTPUTS
**Trading Plan**
The indicator will display a visual trading plan based on the inputs you entered on each individual stock's chart. The trading plan will have a green box and red box to represent your entry, target, and stop loss.
**Risk Parameters**
The indicator will also display text outlining what your risk parameters and sizing should be for the trade based on your R value. You will see 3 different lines: the first line showing the number of shares you can trade, the second line showing the number of option contracts you can trade at .50 delta, and the third line showing the number of option contracts you can trade at .25 delta. For reference, at the money options are .50 deltas. Even if you aren't trading exactly .50 or .25 deltas, these values will still help as a frame of reference in the moment of putting on the trade.
**Note that you can toggle the appearance of either of these outputs by checking/un-checking the boxes next to "Display trading plan" and "Display risk parameters" in the indicator settings.
Examples:
1. "**240 shares with $1.25 risk**" means you can take 240 shares and risk $1.25 on the share's price based on your R value
2. "**4.8 Cons @ .50 delta with $0.62 risk**" means you can take either 4 or 5 at the money option contracts and risk $0.62 **on the option contract's value** based on your R value
3. "**9.8 Cons @ .50 delta with $0.31 risk**" means you can take either 9 or 10 option contracts that have a .25 delta (a bit out of the money) and risk $0.31 **on the option contract's value** based on your R value
Happy Trading!
Release Notes
Rounded number of shares and number of cons **down** to nearest integerRelease Notes
Fixed bug that showed incorrect levels for setup #2 onlyInvite-only script
Access to this script is restricted to users authorized by the author and usually requires payment. You can add it to your favorites, but you will only be able to use it after requesting permission and obtaining it from its author. Contact Zeal_Trading for more information, or follow the author's instructions below.
Please note that this is a private, invite-only script that was not analyzed by script moderators. Its compliance to House Rules is undetermined. TradingView does not suggest paying for a script and using it unless you 100% trust its author and understand how the script works. In many cases, you can find a good open-source alternative for free in our Community Scripts.
Author's instructions
″To gain access, sign up as a Premium member through our website https://zealtrading.net.
Want to use this script on a chart?
Warning: please read before requesting access.
Disclaimer
The information and publications are not meant to be, and do not constitute, financial, investment, trading, or other types of advice or recommendations supplied or endorsed by TradingView. Read more in the Terms of Use.