OPEN-SOURCE SCRIPT
MarketSmith Volumes
Updated
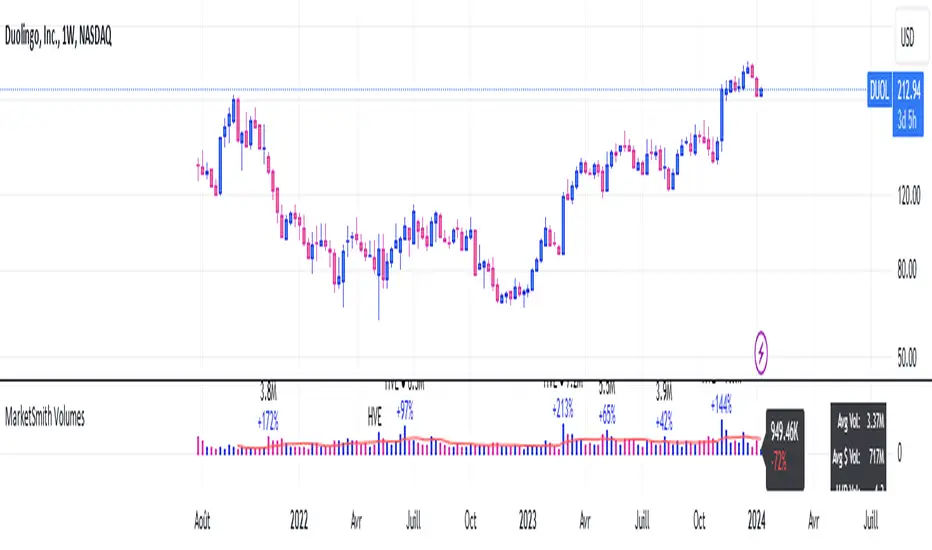
The 'MarketSmith Volumes' is to be used with the 'MarketSmith Indicator' and 'EPS & Sales' in order to mimic fully MarketSmith Graphs with the maximum number of indicators allowed by a free Tradingview Plan: 3
This indicator is no more than a simple volume indicator where all parameters are already adjusted to resemble MarketSmith graphical volumes.
Also you will find integrated:
High Volumes Bars Peak:
They allow us to see peak volumes at a glance.
10-Week Average Volume:
When viewing a weekly chart, this line represents a 10-week moving average volume level. It allows you to see if the current Volume Bar of the week is above or under the average volume traded in the past 10 Weeks.
50-Day Average Volume:
When viewing a daily chart, this line represents a 50-day moving average volume level. Whether or not volume is above or below the average for a certain period could have a significant impact on your stock chart analysis.
Release Notes
- Added optional % variation on peak volumes- Possibility to modify label text color
- Possibility to modify Up/Down Volume Bar Color
- Possibility to modify MA Color
Release Notes
- Recent % variation was missing, correctedRelease Notes
- Last Adjustment regarding last %variation values. Now it should be perfectRelease Notes
- Added an optional label to visualise quickly the current volume and its volume buzzRelease Notes
- Adjusted the description of the label in the parametersRelease Notes
- Organised input parameters- Added some customisation for users (Label Color, text abel)
- Corrected the display of the current label when truncated
Release Notes
- Corrected units of Labels (K, M, B) now displayed correctly- Corrected the superposition of historical labels and last bar label when new bars appeared
- Added max label count of 500
Release Notes
- Corrected an error in the code that was causing to display delayed units (K, M, B)Release Notes
- Volume precision decreased to 1 decimal placeRelease Notes
- Now the %chg is displayed in a more discreet way and should be easier to readRelease Notes
- You can now modify the size of the label of the last bar. Thank you @Moneydiver12 for the suggestion on TwitterRelease Notes
- Last bar label changed to a more compact label- Addition of an optional average $ volume on the label
- Reorganized some entries to make them more compact
Release Notes
- Now displays an optional table with Average Volume, Average $ Volume and U/D RatioRelease Notes
- Corrected the rounding of the Average VolumeRelease Notes
- Added Highest Volume Data (HVE and HV1)● Highest Volume Ever
● Highest Volume In Over a Year
- Added the possibility of highlighting Low Relative Volume
- Reorganised Inputs
Release Notes
- Added an invisible line featuring the Volume Buzz (% variation) to have it appearing when 'Indicator Values" option is checkedRelease Notes
- The Avg $ Vol now always have 2 digits after the comaOpen-source script
In true TradingView spirit, the author of this script has published it open-source, so traders can understand and verify it. Cheers to the author! You may use it for free, but reuse of this code in publication is governed by House rules. You can favorite it to use it on a chart.
Disclaimer
The information and publications are not meant to be, and do not constitute, financial, investment, trading, or other types of advice or recommendations supplied or endorsed by TradingView. Read more in the Terms of Use.