INVITE-ONLY SCRIPT
GODMODE WAVES
GODMODE WAVES
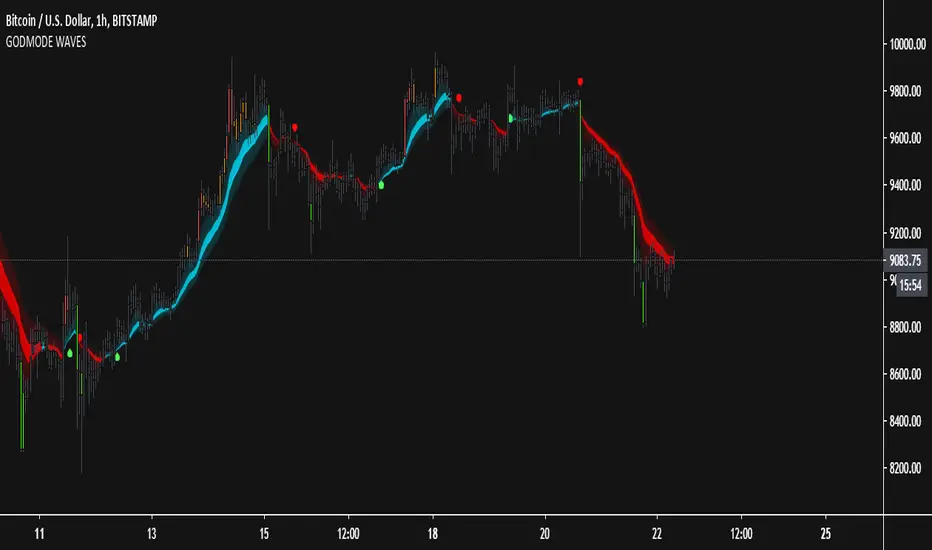
Basically used for Trend Direction purpose
Indicator shows Trend direction depending upon price action
Simple to use
Blue/Cyan color shows Trend is Bullish
Red color shows trend is Bearish
Bands acts as support and resistance
lable shows when the crossover happened
Bar colors
Red/Orange = Extremely over bought zone
Green = Extremely over sold zone
(Note = when bar colors appears take profits or wait for the retrace )
DM me for access
Invite-only script
Access to this script is restricted to users authorized by the author and usually requires payment. You can add it to your favorites, but you will only be able to use it after requesting permission and obtaining it from its author. Contact GODFATHER711 for more information, or follow the author's instructions below.
TradingView does not suggest paying for a script and using it unless you 100% trust its author and understand how the script works. In many cases, you can find a good open-source alternative for free in our Community Scripts.
Author's instructions
″
Want to use this script on a chart?
Warning: please read before requesting access.
Disclaimer
The information and publications are not meant to be, and do not constitute, financial, investment, trading, or other types of advice or recommendations supplied or endorsed by TradingView. Read more in the Terms of Use.