INVITE-ONLY SCRIPT
Normalized MACD by[@hadi_saadat]
Updated
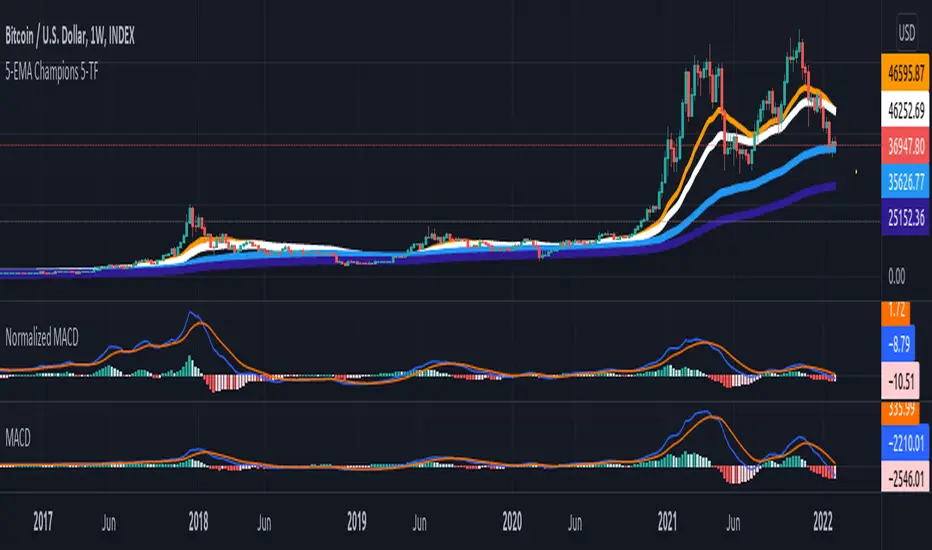
This MACD is exactly like standard MACD, but extremely stable and normalized by EMAs(200,150,100,50,30).
So you need at-least 30 candle to see the chart.
The Huge differences can be seen when the close price scale over time changes for instance go to the weekly time-frame, see the normalized MACD and Standard MACD when the BTC price was below 10k or even below 5k and compare two MACD charts (The standard one chart get almost vanished when the price was much cheaper and it doesnt scale well), then zoom in the standard MACD at that period and again compare it to The Normalized one(When you zoom in you will see surprisingly both MACDs are exactly the same form and shape, however normalized one doesn't need zoom-in and it is well scaled among the time and different prices), You will be surprised that how stable it is.
The normalizes MACDs, Signals and Histograms values are comparable to any other assets (obviously in same time-frame).
Release Notes
The default precision for indicator values is updated to 3.Invite-only script
Access to this script is restricted to users authorized by the author and usually requires payment. You can add it to your favorites, but you will only be able to use it after requesting permission and obtaining it from its author. Contact hadi_saadat for more information, or follow the author's instructions below.
TradingView does not suggest paying for a script and using it unless you 100% trust its author and understand how the script works. In many cases, you can find a good open-source alternative for free in our Community Scripts.
Author's instructions
″just comment here for your request.
Want to use this script on a chart?
Warning: please read before requesting access.
Disclaimer
The information and publications are not meant to be, and do not constitute, financial, investment, trading, or other types of advice or recommendations supplied or endorsed by TradingView. Read more in the Terms of Use.