INVITE-ONLY SCRIPT
Heuristic Bg Color Hodl/swing/scalp [Ox_kali]
Updated

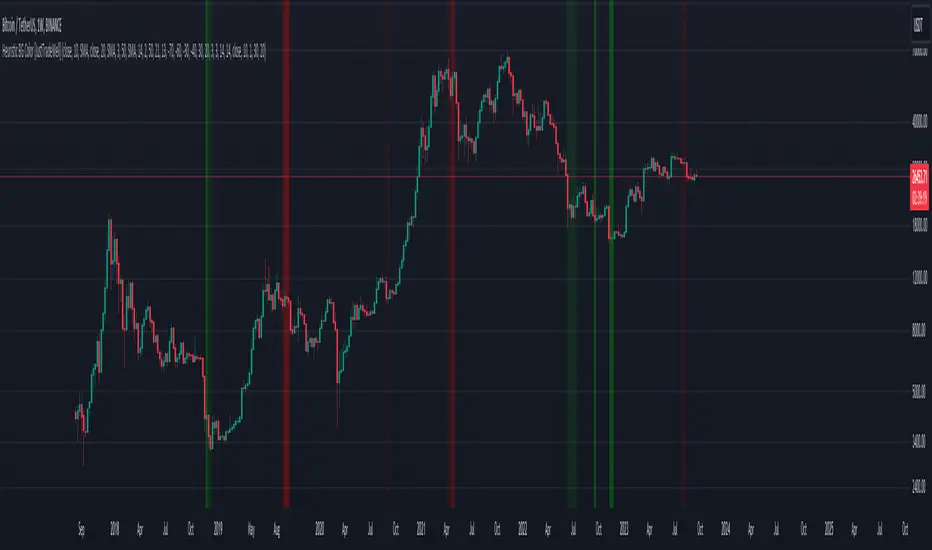
The "Heuristic BG Color Hodl/Swing/Scalp [Ox_kali]" is a multi-faceted technical indicator designed to aid traders across varying investment strategies such as long-term holding (Hodl), swing trading, and scalping. Optimized to run on a range of timeframes from seconds to months. Built upon an intricate layering of moving averages, market oscillators. The indicator displays a color range from light green to deep red, based on market conditions. This tool aims to provide an analytical edge by visualizing market conditions in a straightforward manner. Incorporating both trend-following and oscillatory components both trend-following and oscillating components to furnish a more rounded view of the market. Note that this indicator is best used in conjunction with other forms of market analysis and should not be solely relied upon for making trading decisions.
Key Features:
Functionality Analysis:
The script allows you to select the type and period for Fast and Slow moving averages. It uses these MAs to calculate an underlying trend momentum, further refined by a user-defined MA.
The RSI and MFI are used to identify overbought and oversold conditions calculated and smoothed over a user-defined period. The Stoch RSI gives an additional layer of confirmation, allowing traders to identify more reliable trading signals.
The script's main visual feature is the background color, which changes based on potential Buy and Sell zones. It provides two layers for each, enabling traders to understand the strength of the signal. Notably, the indicator is particularly optimized for identifying Buy Zones and is more functional for detecting Sell Zones when applied to larger timeframes.
Trading Application:
The "Heuristic BG Color Hodl/Swing/Scalp" indicator can adapt to various trading styles, from long-term investment to short-term trading. When the background turns green, it signifies a potential Buy Zone, ideal for entering long positions. Conversely, a red background indicates a Sell Zone, suggesting it may be a good time to exit positions or go short.
Traders can also utilize the alert conditions set within the script to receive real-time notifications, making it easier to capitalize on potential market opportunities.
Please note that the "Heuristic BG Color Hodl/Swing/Scalp" by Ox_kali is intended for educational purposes only and does not constitute financial advice. This indicator is not a guarantee of future market performance and should be used alongside proper risk management strategies. Ensure you fully understand the methodology and limitations of this indicator before making any trading decisions. Past performance is not indicative of future results.
Key Features:
- Multiple Moving Averages: Utilizes Fast and Slow MAs to identify trend momentum.
- Modified RSI and MFI: Incorporates RSI and MFI to gauge overbought and oversold conditions.
- Stoch RSI Indicator: Used to provide additional confirmation for trading signals.
- Dynamic Background Color: Highlights potential Buy and Sell zones using background color for easier visual interpretation.
- Alert Conditions: Trigger customizable alerts for Buy and Sell zones.
Functionality Analysis:
The script allows you to select the type and period for Fast and Slow moving averages. It uses these MAs to calculate an underlying trend momentum, further refined by a user-defined MA.
The RSI and MFI are used to identify overbought and oversold conditions calculated and smoothed over a user-defined period. The Stoch RSI gives an additional layer of confirmation, allowing traders to identify more reliable trading signals.
The script's main visual feature is the background color, which changes based on potential Buy and Sell zones. It provides two layers for each, enabling traders to understand the strength of the signal. Notably, the indicator is particularly optimized for identifying Buy Zones and is more functional for detecting Sell Zones when applied to larger timeframes.
Trading Application:
The "Heuristic BG Color Hodl/Swing/Scalp" indicator can adapt to various trading styles, from long-term investment to short-term trading. When the background turns green, it signifies a potential Buy Zone, ideal for entering long positions. Conversely, a red background indicates a Sell Zone, suggesting it may be a good time to exit positions or go short.
Traders can also utilize the alert conditions set within the script to receive real-time notifications, making it easier to capitalize on potential market opportunities.
Please note that the "Heuristic BG Color Hodl/Swing/Scalp" by Ox_kali is intended for educational purposes only and does not constitute financial advice. This indicator is not a guarantee of future market performance and should be used alongside proper risk management strategies. Ensure you fully understand the methodology and limitations of this indicator before making any trading decisions. Past performance is not indicative of future results.
Release Notes
Minor code fixInvite-only script
Access to this script is restricted to users authorized by the author and usually requires payment. You can add it to your favorites, but you will only be able to use it after requesting permission and obtaining it from its author. Contact Ox_kali for more information, or follow the author's instructions below.
TradingView does not suggest paying for a script and using it unless you 100% trust its author and understand how the script works. In many cases, you can find a good open-source alternative for free in our Community Scripts.
Author's instructions
″Send me a private message on TradingView indicating your interest in the script. Please do not use the 'Comments' section to request access to this script.
Want to use this script on a chart?
Warning: please read before requesting access.
Disclaimer
The information and publications are not meant to be, and do not constitute, financial, investment, trading, or other types of advice or recommendations supplied or endorsed by TradingView. Read more in the Terms of Use.