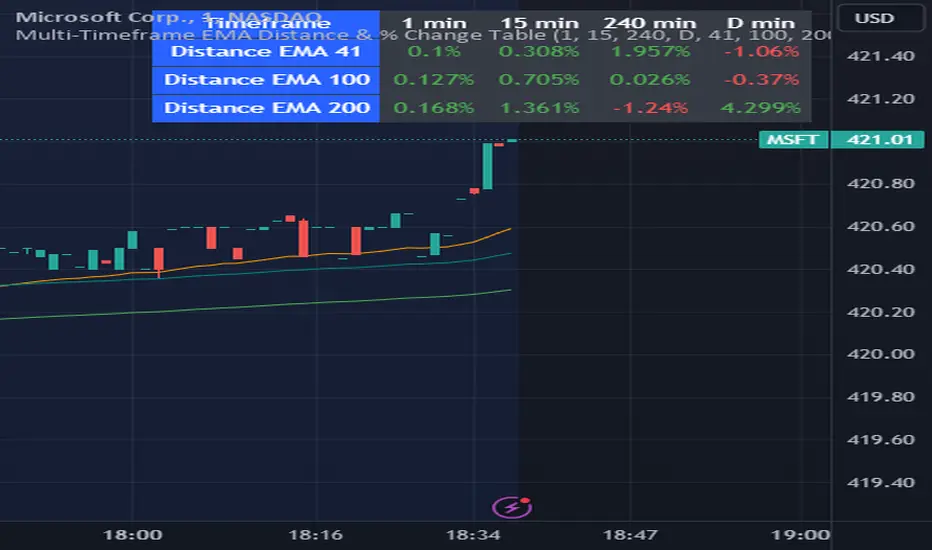
Multi-Timeframe EMA Distance & % Change TableDescription of Multi-Timeframe EMA Distance & % Change Table
The Multi-Timeframe EMA Distance & % Change Table indicator is designed to display the distance and percentage change between the current price and the Exponential Moving Averages (EMAs) on multiple timeframes. It creates a table to show these values, with customizable options for decimal precision .
Key Features:
Inputs:
- Timeframes (tf1, tf2, tf3, tf4): User-defined timeframes for EMA calculations (e.g., 1 minute, 15 minutes, daily, etc.).
- EMA Levels (emaLevel, emaLevel2, emaLevel3): User-defined periods for three different EMAs.
EMA Calculations:
- Computes EMAs for the specified levels (50, 100, 200) on each of the user-selected timeframes.
Plotting:
- Plots the EMAs on the chart with distinct colors: Orange, Teal, and Green for different EMAs.
Display Options:
- Checkbox (displayAsPercentage): Allows the user to toggle between displaying distances or percentage changes.
- Decimal Precision:
- decimalPlacesDistance: Specifies the number of decimal places for rounded distance values.
- decimalPlacesPercentage: Specifies the number of decimal places for rounded percentage values.
Table Creation:
- Location: Table is placed in the top-right corner of the chart.
- Headers: Includes columns for each timeframe and EMA distance/percentage.
Distance and Percentage Calculations:
- Distances: Calculated as the difference between the current price and the EMA values for each timeframe.
- Percentages: Calculated as the distance divided by the EMA value, converted to a percentage.
Decimal Rounding:
- Custom Rounding Function: Ensures that distance and percentage values are displayed with the user-specified number of decimal places.
Color Coding:
- Distance Values: Colored green if positive, red if negative.
- Table Entries: Display either the rounded distance or percentage, based on user selection.
Table Update:
- The table is dynamically updated with either distance or percentage values based on the user's choice and rounded to the specified number of decimal places.
This indicator provides a comprehensive overview of EMA distances and percentage changes across multiple timeframes, with detailed control over the precision of the displayed values.
Action
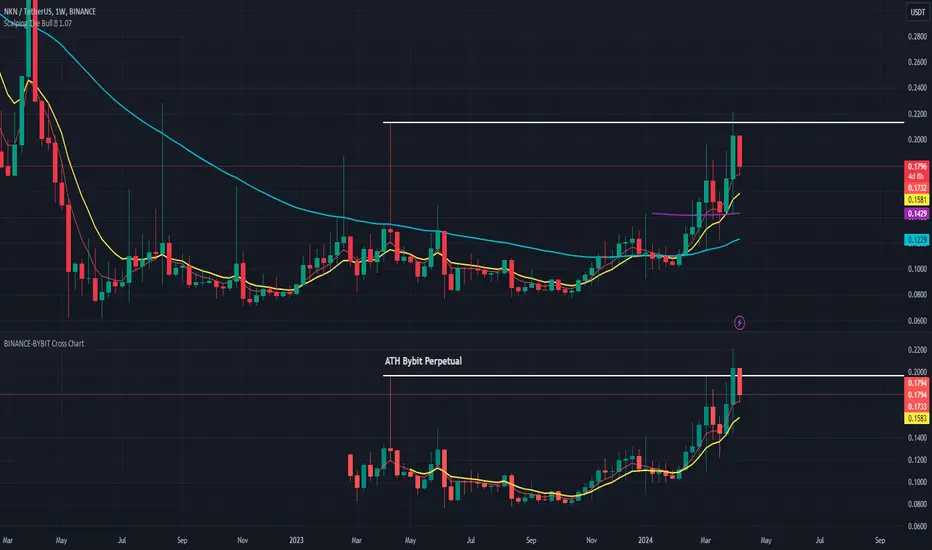
BINANCE-BYBIT Cross Chart: Spot-Perpetual CorrelationName: "Binance-Bybit Cross Chart: Spot-Perpetual Correlation"
Category: Scalping, Trend Analysis
Timeframe: 1M, 5M, 30M, 1D (depending on the specific technique)
Technical analysis: This indicator facilitates a comparison between the price movements shown on the Binance spot chart and the Bybit perpetual chart, with the aim of discerning the correlation between the two charts and identifying the dominant market trends. It automatically generates the corresponding chart based on the ticker selected in the primary chart. When a Binance pair is selected in the main chart, the indicator replicates the Bybit perpetual chart for the same pair and timeframe, and vice versa, selecting the Bybit perpetual chart as the primary chart generates the Binance spot chart.
Suggested use: You can utilize this tool to conduct altcoin trading on Binance or Bybit, facilitating the comparison of price actions and real-time monitoring of trigger point sensitivity across both exchanges. We recommend prioritizing the Binance Spot chart in the main panel due to its typically longer historical data availability compared to Bybit.
The primary objective is to efficiently and automatically manage the following three aspects:
- Data history analysis for higher timeframes, leveraging the extensive historical data of the Binance spot market. Variations in indicators such as slow moving averages may arise due to differences in historical data between exchanges.
- Assessment of coin liquidity on both exchanges by observing candlestick consistency on smaller timeframes or the absence of gaps. In the crypto market, clean charts devoid of gaps indicate dominance and offer enhanced reliability.
- Identification of precise trigger point levels, including daily, previous day, or previous week highs and lows, which serve as sensitive areas for breakout or reversal operations.
All-Time High (ATH) and All-Time Low (ATL) levels may vary significantly across exchanges due to disparities in historical data series.
This tool empowers traders to make informed decisions by leveraging historical data, liquidity insights, and precise trigger point identification across Binance Spot and Bybit Perpetual market.
Configuration:
EMA length:
- EMA 1: Default 5, user configurable
- EMA 2: Default 10, user configurable
- EMA 3: Default 60, user configurable
- EMA 4: Default 223, user configurable
- Additional Average: Optional display of an additional average, such as a 20-period average.
Chart Elements:
- Session separator: Indicates the beginning of the current session (in blue)
- Background: Indicates an uptrend (60 > 223) with a green background and a downtrend (60 < 223) with a red background.
Instruments:
- EMA Daily: Shows daily averages on an intraday timeframe.
- EMA levels 1h - 30m: Shows the levels of the 1g-30m EMAs.
- EMA Levels Highest TF: Provides the option to select additional EMA levels from the major timeframes, customizable via the drop-down menu.
- "Hammer Detector: Marks hammers with a green triangle and inverted hammers with a red triangle on the chart
- "Azzeramento" signal on TF > 30m: Indicates a small candlestick on the EMA after a dump.
- "No Fomo" signal on TF < 30m: Indicates a hyperextended movement.
Trigger Points:
- Today's highs and lows: Shows the opening price of the day's candlestick, along with the day's highs and lows (high in purple, low in red, open in green).
- Yesterday's highs and lows: Displays the opening price of the daily candlestick, along with the previous day's highs and lows (high in yellow, low in red).
You can customize the colors in "Settings" > "Style".
It is best used with the Scalping The Bull indicator on the main panel.
Credits:
@tumiza999: for tests and suggestions.
Thanks for your attention, happy to support the TradingView community.
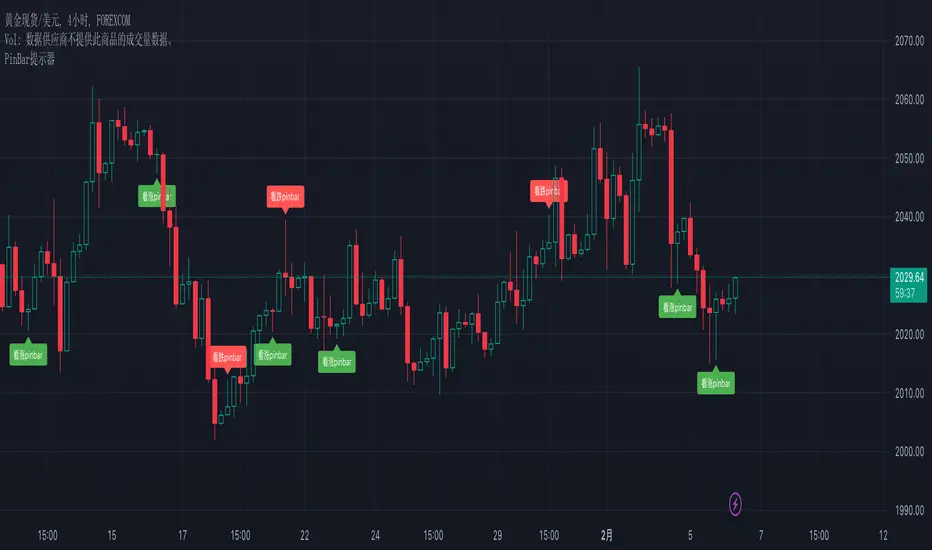
Pin Bar PrompterRecognition principle of the Pin Bar
1. The K-Chart has a long shadow line
2. The length of the long shadow line must be greater than 2/3 of the length of the body
3. The shadow line above the body is bearish Pin Bar; the shadow line below the body is bullish Pin Bar.
Pin Bar is just a K-Chart pattern and is only used as a basis for judgment and not as investment advice.
Pin Bar识别的逻辑
1.K线有长影线
2.长影线的长度大于整根K长度的2/3
3.影线在实体上方为:看跌pinbar;影线在实体下方为:看涨pinbar
Pin Bar只是一种K线形态,仅作为一种判断依据,不作为投资建议
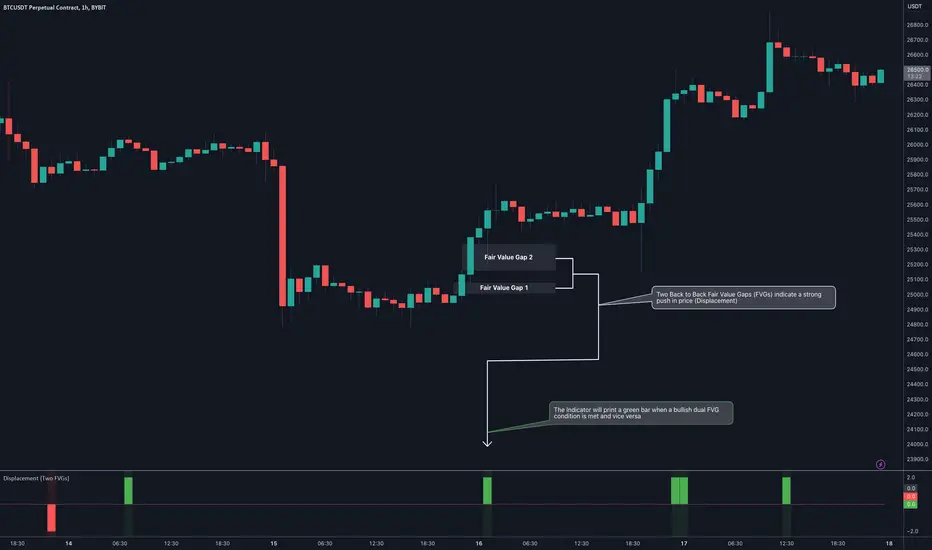
Displacement (Two FVGs)A simple indicator that attempts to identify displacement in price by alerting you when two simultaneous Fair Value Gaps (FVGs) occur.
When two fair value gaps occur, the indicator will print a green bar (if bullish) or a red bar (if bearish). If you right click on the indicator you can turn on alerts that will pop up every time a dual FVG occurs.
Fair Value Gaps are most commonly used amongst price action traders and are defined as instances in which there are inefficiencies, or imbalances, in the market.
The concept for this indicator is very simple. Apply it to your chart and enable alerts on the instruments and timeframe you trade. When you get an alert, it could indicate larger players getting involved.
This is NOT a trading strategy. Its intention is to save time by alerting you to large imbalances in price on the instruments you trade.
LowHighFinderThis chart display how value change of (low,high,close,open) is considered as a factor for buying or selling. Each element take same weight when consider the final price. The price change over a certain threshold would be the decision point (buy/sell)
Factors considered in this chart
1.Quotes: High,low,close,open,volume. If one of them higher than previous day, then it increase, otherwise decreases.
2. Multipler: If you think one quote is more important than other (High more important than close, you can set multipler higher)
3. EMA smoother: It is using to balance the price effect. Like if price increased dramatically, EMA would notify whether could be a good time to sell. (Because high deviation between MA and price suggest price increase too fast)
4. Length of line: set length of line for you need
5. Percentage change: how much percentage change is considered a significant change? 5%? or 10%? In which case should it count toward the final indicator? Adjust percentage change needed, smaller for minutes chart (less than 10) higher for hours chart (10-20), even higher for day chart
Buy/Sell method:
1. When green dot appears, wait after price start to get close to moving average to find the low point and buy.
2. Reverse for red dot.

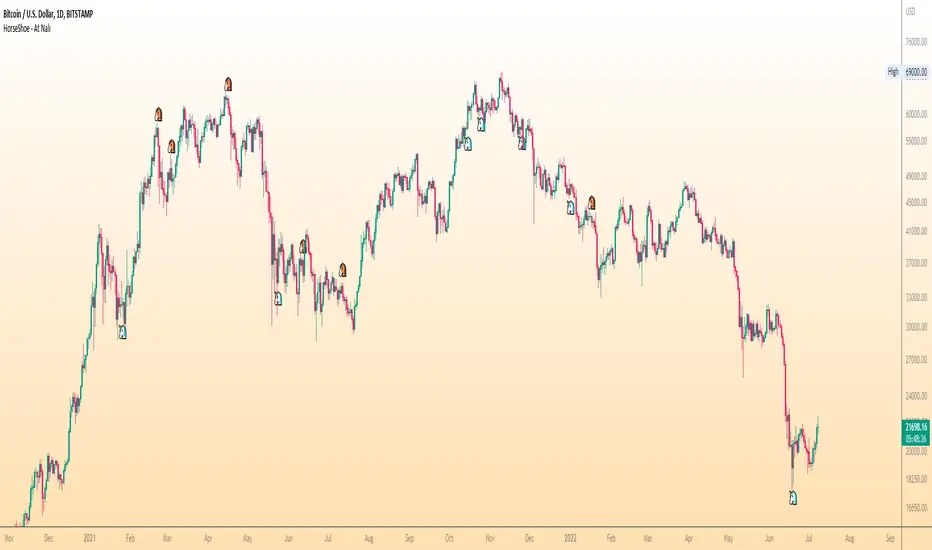
HorseShoe - At NalıHorseShoe - At Nalı
English
HORSEHOE FORMATION
It is actually a kind of bobbin. As with the bobbin, the needles of the candles are not taken into account much.The difference is that there are only four candlesticks in this formation. There is no limit to this in the bobbin.In addition, it is important which of the bars forming the bobbin is longer or shorter than which.is not. This is very important in a horseshoe. There is a rule for the length and shortness of the bars.Candlesticks in a horseshoe showing the bearish sequentially rising, falling, rising and repeatingin the form of falling bars. Also the lengths of the first and fourth bars, i.e. price opening andThe differences between the closing must be longer than the second and third bar. So those on the sideshould be clearly larger than the middle ones. For the rise, the bars are falling-rising-falling in order.The rising candle should be in the form of a bar. Likewise the first and last barsshould be longer than the middle ones.Of the first and fourth bars, it is better if the fourth bar is longer than the first.was the signal. But the fact that they are equal or the first one is long does not mean this formation. Attentionthe first and last bars that need to be beat are clearly longer than the middle onesrequired. A millimeter long means a very weak signal.
It is valid for every price and parity. But this is not a magic wand, so every horseshoemay not be the correct signal. Trend, Supdem, Correlation and other similar components are alsois involved, a highly efficient signal is formed. Well reviewed onexperience must be gained. More like an indicator to show the direction of the price rather than a signalshould be used.
Turkish
AT NALI FORMASYONU
Aslında bir tür bobindir. Bobinde olduğu gibi mumların iğneleri çok dikkate alınmaz. Farkı, bu oluşumda sadece dört mum çubuk vardır. Bobinde bunun sınırı yoktur. Ayrıca bobini oluşturan barların hangisinin hangisinden uzun ya da kısa olduğu önemli değildir. At nalında bu çok önemlidir. Barların uzunluğu kısalığı ve sırasında bir kural vardır. Düşüşü gösteren at nalında mum çubuklar sırayla yükselen düşen yükselen ve tekrar düşen barlar şeklindedir. Ayrıca birinci ve dördüncü barların uzunlukları, yani fiyat açılış ve kapanışı arasındaki farkları, ikinci ve üçüncü bardan daha uzun olmalıdır. Yani kenardakiler ortadakilerden net bir şekilde büyük olmalı. Yükseliş için ise barlar sırayla düşen-yükselen düşen-yükselen mum çubuk şeklinde olmalıdır. Aynı şekilde ilk ve son barlar ortadakilerden uzun olmalıdır. Birinci ve dördüncü barlardan dördüncü barın birinciden uzun olması daha güze bir sinyaldi. Fakat eşit olmaları ya da birincinin uzun olması da bu oluşumu bozmaz. Dikkat edilmesi gereken ilk ve son barların açık bir şekilde ortadakilerden uzun olması gerekmektedir. Milim farkla uzun olması çok zayıf bir sinyal olması anlamına gelir.
kaynak:
Price Action TR
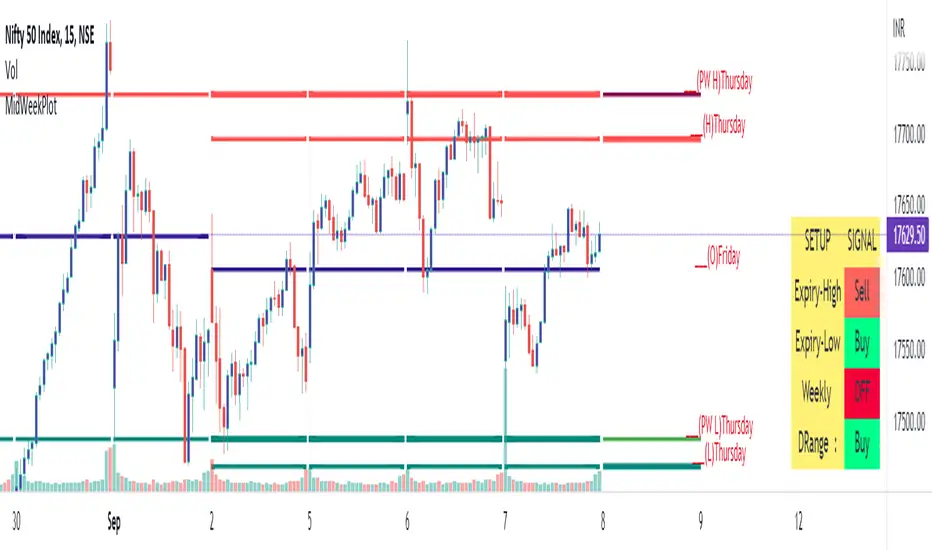
MidWeekPlotMid week high and low Plotting , usefull for finding a mid range or Expiry range detail of High and low
Failed AuctionAs we know, buyers and sellers take part in the market auction.
A failed auction is where price could not tick above or below a specific price. This means that there were no buyers willing to buy or sellers willing to sell beyond that price. Price then moves away in the other direction.
The failed auction acts as a magnet and becomes a target to revisit sooner or later. The failed auction is a successful/finished auction once it has been satisfied.
On the indicator, two adjacent candles with the exact same high or low are marked. The icon will appear on the high or low of the 2nd candle. This notifies us that there was a failed auction.
If you are in a trade, you can use the failed auction to hold onto the trade longer. If you are not in a trade, you should be cautious if a failed auction rests above or below you limit order.
Icons and colours are customisable. An option to have plotted lines for the failed auction is included.
Works on all timeframes.

bytimeLibrary "bytime"
TODO: to do something at the specified time.
////Return =>> ht = hour , mt = minute , st = second ,Dt = Day, Mt = month, Yt = year , dateTime = full time format./////////////
Note : Remember to always add import when you call our library and change Gtime() to Timeset.Gtime() is used to access internal data.
import hapharmonic/bytime/1 as Timeset
=Timeset.Gtime()
/////////////Set a time to trigger an alert./////////////
ck = false
///hour : minute : second
if ht == TH and mt == TM and st == TS
//some action
//...
//.
ck := true
Gtime()

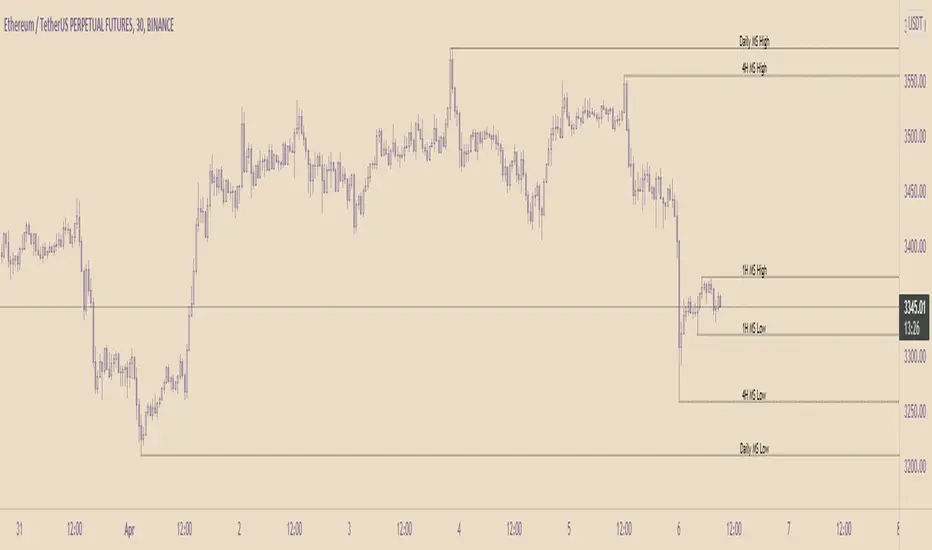
MTF Market Structure Highs and LowsThe indicator marks the last fractal highs and lows (W,D,4H and 1H options) to help determine current market structure. The script was created to help with directional bias but also as a MTF visual aid for stop hunts/liquidity raids.
Liquidity areas are where we assume trader's stop losses would be when buying or selling. Liquidity lies above and below swing points and institutions need liquidity to fill large orders.
Monitor price action as it hits these areas for a potential reversal trade.
Synthetic Price Action GeneratorNOTICE:
First thing you need to know, it "DOES NOT" reflect the price of the ticker you will load it on. THIS IS NOT AN INDICATOR FOR TRADING! It's a developer tool solely generating random values that look exactly like the fractals we observe every single day. This script's generated candles are as fake as the never ending garbage news cycles we are often force fed and expected to believe by using carefully scripted narratives peddled as hypnotic truth to psychologically and emotionally influence you to the point of control by coercion and subjugation. I wanted to make the script's synthetic nature very clear using that analogy, it's dynamically artificial. Do not accidentally become disillusioned by this scripts values, make trading decisions from it, and lastly don't become victim to predatory media magic ministry parrots with pretty, handsome smiles, compelling you to board their ferris wheel of fear. Now, on to the good stuff...
BACKSTORY:
Occasionally I find myself in situations where I have to build analyzers in Pine to actually build novel quantitative analytic indicators and tools worthy of future use. These analyzers certainly don't exist on this platform, but usually are required to engineer and tweak algorithms of the highest quality with the finest computational caliber. I have numerous other synthesizers to publish besides this one.
For many reasons, I needed a synthetic environment to utilize the analyzers I built in Pine, to even pursue building some exotic indicators and algorithms. Pine doesn't allow sourcing of tuples. Not to mention, I required numerous Pine advancements to make long held dreams into tangible realities. Many Pine upgrades have arrived and MANY, MANY more are in need of implementation for all. Now that I have this, intending to use it in the future often when in need, you can now use it too. I do anticipate some skilled Pine poets will employ this intended handy utility to design and/or improved indicators for trading.
ORIGIN:
This was inspired by the brilliance from the world renowned ALGOmist John F. Ehlers, but it's taken on a completely alien form from its original DNA. Browsing on the internet for something else, I came across an article with a small code snippet, and I remembered an old wish of mine. I have long known that by flipping back and forth on specific tickers and timeframes in my Watchlist is not the most efficient way to evaluate indicators in multiple theatres of price action. I realized, I always wanted to possess and use this sort of tool, so... I put it into Pine form, but now have decided to inject it with Pine Script steroids. The outcome is highly mutable candle formations in a reusable mutagenic package, observable above and masquerading as genuine looking price candles.
OVERVIEW:
I guess you could call it a price action synthesizer, but I entitled it "Synthetic Price Action Generator" for those who may be searching for such a thing. You may find this more useful on the All or 5Y charts initially to witness indication from beginning (barstate.isfirst === barindex==0) to end (last_bar_index), but you may also use keyboard shortcuts + + to view the earliest plottable bars on any timeframe. I often use that keyboard shortcut to qualify an indicator through the entirety of it's runtime.
A lot can go wrong unexpectedly with indicator initialization, and you will never know it if you don't inspect it. Many recursively endowed Infinite Impulse Response (IIR) Filters can initialize with unintended results that minutely ring in slightly erroneous fashion for the entire runtime, beginning to end, causing deviations from "what should of been..." values with false signals. Looking closely at spg(), you will recognize that 3 EMAs are employed to manage and maintain randomness of CLOSE, HIGH, and LOW. In fact, any indicator's barindex==0 initialization can be inspected with the keyboard shortcuts above. If you see anything obviously strange in an authors indicator, please contact the developer if possible and respectfully notify them.
PURPOSE:
The primary intended application of this script, is to offer developers from advanced to even novice skill levels assistance with building next generation indicators. Mostly, it's purpose is for testing and troubleshooting indicators AND evaluating how they perform in a "manageable" randomized environment. Some times indicators flake out on rare but problematic price fluctuations, and this may help you with finding your issues/errata sooner than later. While the candles upon initial loading look pristine, by tweaking it to the minval/maxval parameters limits OR beyond with a few code modifications, you can generate unusual volatility, for instance... huge wicks. Limits of minval= and maxval= of are by default set to a comfort zone of operation. Massive wicks or candle bodies will undoubtedly affect your indication and often render them useless on tickers that exhibit that behavior, like WGMCF intraday currently.
Copy/paste boundaries are provided for relevant insertion into another script. Paste placement should happen at the very top of a script. Note that by overwriting the close, open, high, etc... values, your compiler will give you generous warnings of "variable shadowing" in abundance, but this is an expected part of applying it to your novel script, no worries. plotcandle() can be copied over too and enabled/disabled in Settings->Style. Always remember to fully remove this scripts' code and those assignments properly before actual trading use of your script occurs, AND specifically when publishing. The entirety of this provided code should never, never exist in a published indicator.
OTHER INTENTIONS:
Even though these are 100% synthetic generated price points, you will notice ALL of the fractal pseudo-patterns that commonly exist in the markets, are naturally occurring with this generator too. You can also swiftly immerse yourself in pattern recognition exercises with increased efficiency in real time by clicking any SPAG Setting in focus and then using the up/down arrow keys. I hope I explained potential uses adequately...
On a personal note, the existence of fractal symmetry often makes me wonder, do we truly live in a totality chaotic universe or is it ordered mathematically for some outcomes to a certain extent. I think both. My observations, it's a pre-deterministic reality completely influenced by infinitesimal amounts of sentient free will with unimaginable existing and emerging quantities. Some how an unknown mysterious mechanism governing the totality of universal physics and mathematics counts this 100.0% flawlessly and perpetually. Anyways, you can't change the past that long existed before your birth or even yesterday, but you can choose to dream, create, and forge the future into your desires and hopes. As always, shite always happens when your not looking for it. What you choose to do after stepping in it unintentionally... is totally up to you. :) Maybe this tool and tips provided will aid you in not stepping in an algo cachucha up to your ankles somehow.
SCRIPTING LESSONS PORTRAYED IN THIS SCRIPT:
Pine etiquette and code cleanliness
Overwrite capabilities of built-in Pine variables for testing indicators
Various techniques to organize Settings panel while providing ease of adjustment utility
Use of tooltip= to provide users adequate valuable information. Most people want to trade with indicators, not blindly make adjustments to them without any knowledge of their intended operation/effects
When available time provides itself, I will consider your inquiries, thoughts, and concepts presented below in the comments section, should you have any questions or comments regarding this indicator. When my indicators achieve more prevalent use by TV members , I may implement more ideas when they present themselves as worthy additions. Have a profitable future everyone!

[H] Multi Coin Compare
Use a focal point to compare multiple coins price action to one another in real time
View the price of up to 5 coins in an easy to view table
Fully Customizable

Price ActionFirst, you have to know price action, RTM price action Handbook could help you
this indicator shows you base and momentum candles
base candles could be zones of trade that show you fighting of bulls and bears, and momentum candles could show the power of those zones.
Base candles are white in the chart, and you can place your order at the good zone.
Rally candles and drop candles are momentum candles, and bold rally and bold drop show that it is more powerful than its before candle.
Zigzag compression is one way that shows the compression in trend.
it looks like the Wedges pattern at classic technical that shows pending orders are closed, so the target zone could be powerful to reverse the trend.
Black background of candle means that candle doesn't reach its before candle and so it is poor candle, I named it domination.
It is better to do not trade at poor candles.
At the end, I find Price action the best way to trade, and it makes you free of other indicator, even volume indicator.
This indicator is good for those who use price action strategy to trade and those who want to learn the price action.
It could be so helpful and reliable way to find the zones, and place buy or sell order and the target, specially for scalping.

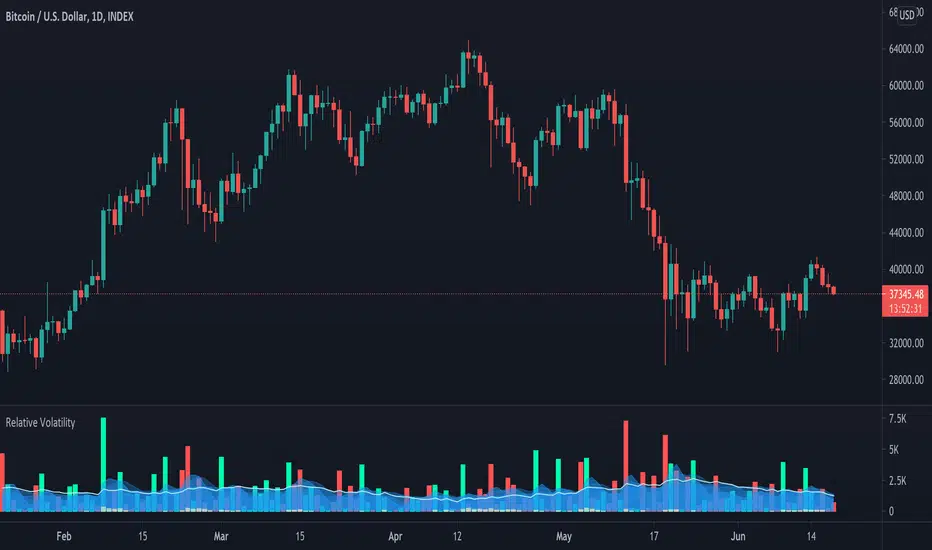
Relative VolatilityRelative volatility highlights large changes in price. This was designed to be used with my relative volume indicator so that traders can see the effect of volume on price action. It is also a good tool to analyse breakout patterns to identify best entry points and waves.
Above shows relative volatility and relative volume working together.
Tipsy EMA Tipsy EMA
v0.2a
Coded by vaidab.
A simple strategy to buy dips in an uptrend.
How to use:
- buy on trend when price retraces to the orange "buy" line and compound orders
- sell when price reaches red line (stop loss) or at 💰 (take profit)
Note that you can reverse trade on the 💰 sign for a short scalp / day trade.
Uptrend: green/red background. Danger zone: orange bg. No go zone: no bg.
Potential buys (in a clear trend): 55, 100, 200 EMA touches and
fibo retracements to .382 and .618.
Potential stop loss: when price breaks the 200 EMA (marked by a red line).
Exit signs: opposite trend divergences (RSI).
Take profit: EMA 55 crossing down EMA 100.
Use it in confluence with market structure. E.g. If 200 EMA ligns up with
past market structure, if there are whole numbers or if there's a monthly level.
Tested BTCUSDT D, 4H

Action Trend LineAction Trend Line is different of Moving Average between ema26 and ema260
My idea is, if ema26 drop to ema260 means downtrend
if ema26 increase or moving out of ema260 means uptrend
then writting a different line by 100 scale to be clear vision
at the bottom have plot sign up and down for each candle, it is status information
The chart show Action Trend Line, by 2 color and 2 sign at the bottom of chart.
If the line is growing up then color is green. you could know that is uptrend.
If the line is going down then color is red. you could know that is downtrend.
The triangle sign at the bottom of chart show trend folowing.
If previous and this line are uptrend, the triangle up and green color.
If previous and this line are downtrend, the triangle down and redcolor.
otherwise, the trend going to change it dosen't plot any sign, you cloud know warning the trend going to be change.
Must try and make you clearly understand.

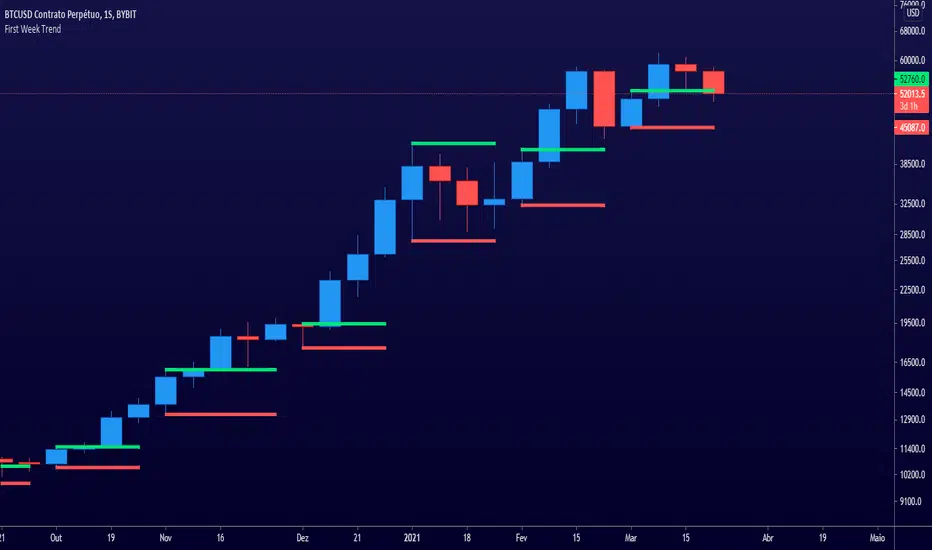
First Week Trend [MX]I created this indicator based on one of my ways of analyzing the BTC trend in particular, I noticed that the break of the first weekly candle usually indicates the trend for the rest of the month.
This indicator has a bug in which if you change the timeframe of the indicator it will show erroneous values
If you use the candlestick chart, you will need to pull the visual order of this indicator to the top to overlay the colors of the standard candles, or simply hide the standard candles
the trend colors are bugged in timeframes other than the weekly
special thanks to @xdecow who helped me with the code
////////////////////////////////////////////////////////////////////////
Eu criei esse indicador baseado em uma das minhas formas de analisar a tendência do BTC em específico, eu notei que o rompimento do primeiro candle do semanal costuma indicar a tendência para o resto do mês.
Esse script tem um bug em que se mudar o timeframe do indicador ele irá mostrar valores errados
Se você usa o gráfico de candlesticks, você precisará puxar para o topo a ordem visual desse indicador para sobrepor as cores do candles padrões, ou simplesmente ocultar os candles padrões
as cores da tendencia estão bugados em outros timeframes diferentes do semanal
agradecimentos especiais ao @xdecow que me ajudou no código
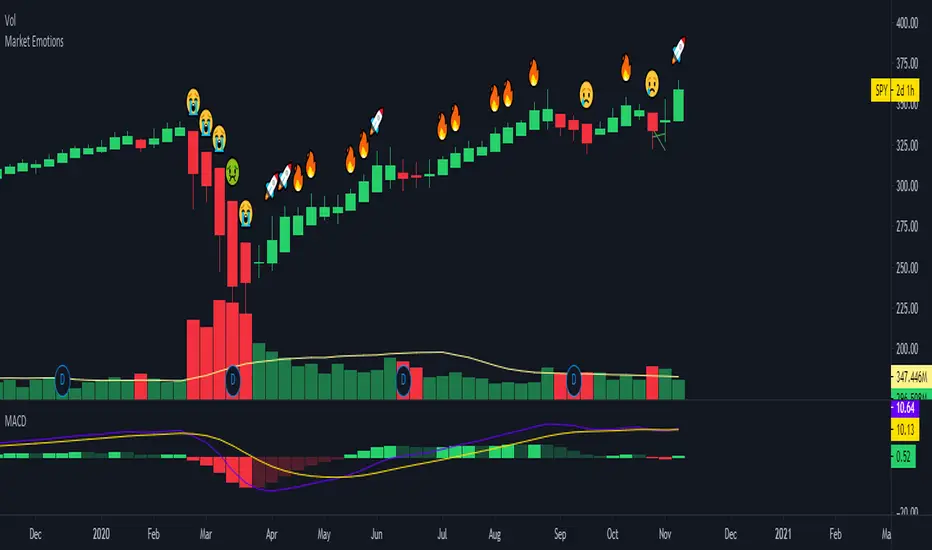
Market EmotionsThis is a simple and fun indicator I built out of boredom one night. It's great for a quick laugh, but other than that, it's useless. It simply displays emotes for various thresholds of change in price between the open and close of a candle. For example, unicorn candles are any candles that gain 25% or more from opening price to closing price.
Price/Volume Value HistogramAn interesting implementation of mine to measure an asset changes based on asset price velocity and volume velocity. The indicator acts as asset value calculator. Long and Short.
==Points System Rules==
UPTRENDING
If Current Close is higher than previous Close and Current Volume is bigger than previous Volume: Adds Close Points and Volume Points
Otherwise check
If Current Close is higher than previous Close: Adds Only Close Points
DOWNTRENDING
If Current Close is lower than previous Close and Current Volume is bigger than previous Volume: Reduces Close Points and Volume Points
Otherwise check
If Current Close is lower than previous Close: Reduces Only Close Points
==Plotting==
Result of the values are summed up to a histogram.
Obviously on increasing prices and volume the histogram will be above zero line and on the Bullish side (green color), otherwise, on the Bearish side (red color).
You can't cheat the price movement, it's just what it is.
Optional to smooth it by EMA (set to true by default).
Like if you Like and Enjoy!
Follow for upcoming indicators.

Renko MTF - Traditional and ATRSomehow there aren't too many renko bars that have the traditional setting built-in so I put one up. This one has the option to choose between Traditional and ATR, the size number corresponds to the option that was chosen. And just in case if anyone wanted, I put up a multi-time frame option to choose the time frame the bars take place. D is for day, W is for week, flat numbers are in minutes, and leaving it blank looks at the current time frame the chart is in. The calculation comes from how Tradingview handles renko bars.
Renko bars don't paint a color unless the market moves a certain amount based on its settings. When the market moves up it turns green, if it moves down it turns red, simple color changes alone can say a lot. They're a good way to try to find trends somewhat objectively and seem to be a good way to eliminate time and can replace other time-based indicators that can whipsaw or lag. The bars have a tendency to repeat themselves so it's a good way to find trends. There aren't too many settings for the box size, most people either just choose 5, 10, 14, etc where as other indicators have many options that differ on different markets. The numbers can be chosen easily enough to pick a sweet spot with just a single input where other indicators such as MACD have multiple inputs to pick the right number that can make it difficult to choose from(although it won't be as precise as a MACD would sometimes but can be worth the objectiveness and consistency and same setting repeatability in different markets in my opinion). Some example strategies could be to use them as an alternative trailing stop, finding trends, a simple color change for entry and exit on top of other strategies, etc. It can do the job of many in an all in one price action type indicator(although not better all the time, it can come close enough). Despite all this, it does seem to depend on which time-frame it's being looked at, how TV does the calculation for it, and how one can use this with the lack of practical information on it out there.

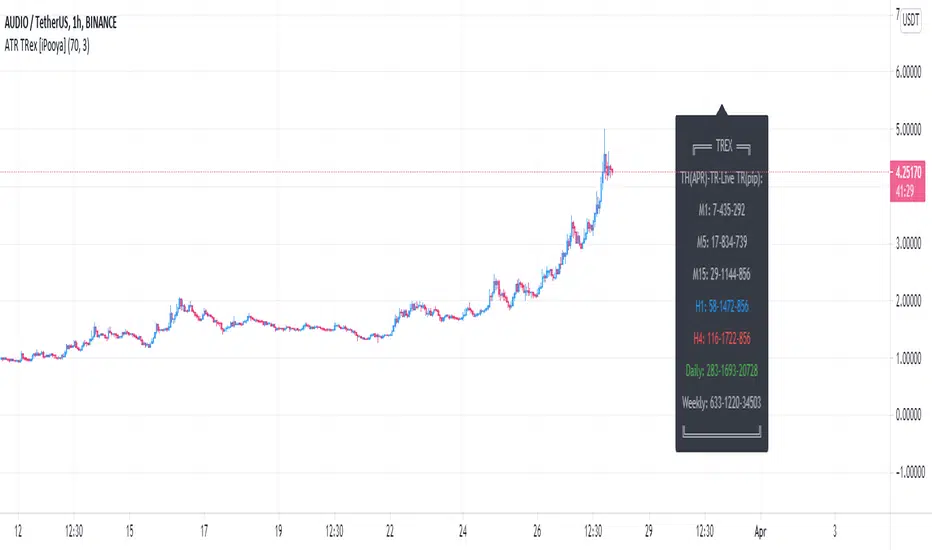
ATR TRex [ipooya]To appreciate dear Mr.Khakestar efforts I have converted his mt4 ATR formula to pine script. All credits go to him.
you can view the ATR result of each candle in the past:
The first black number is the ATR of the M1 chart.
The second black number is the ATR of the M5chart.
The third black number is the ATR of the M15 chart.
The fourth black number is the ATR of the H1 chart.
The fifth black number is the ATR of the H4 chart.
The sixth black number is the ATR of the Daily chart.
The seventh black number is the ATR of the Weekly chart.
**and the second number of every line is live ATR ( current ATR candle)
What makes this ATR formula so different?
This formula invented by Mr.Khakestar and it shows the power of the price to move in each cycle of the chart. We can use it in RTM strategy and Price Action trading. To learn how to use it you need to learn TRex strategy (Presented by Mr.Khakestart for free in Persian).
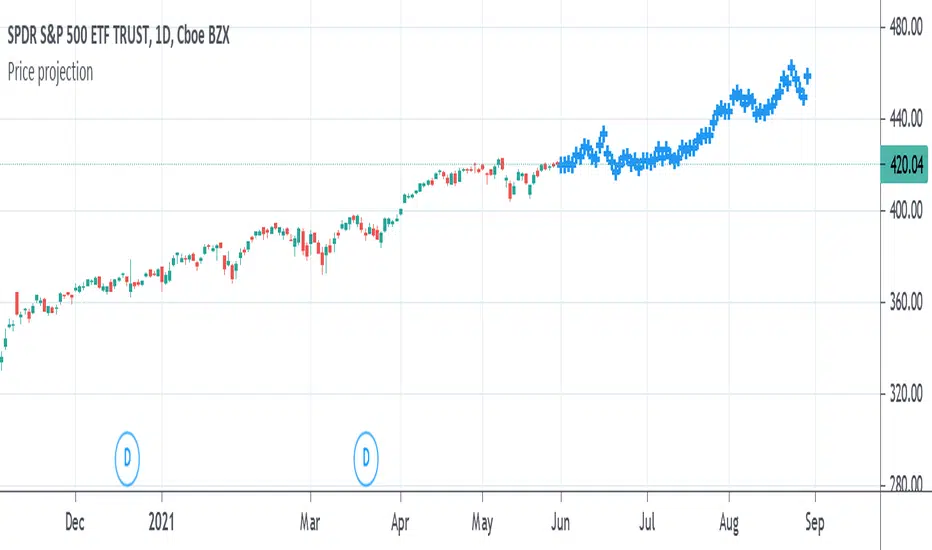
Backwards price projection - few bars ahead reverse chartEver wondered what the chart would look like if it's flipped upside down and flipped horizontally into the future? The idea is that when there is a trend, a repeating pattern tends to occur. Going backwards and projecting that movement into the future can supposedly show what the future price will be.
Somehow I haven't found anyone try it like this and I am currently trying to find a way to use a reversed moving average or plot of some kind to project further ahead. TV at the moment does not allow offsets on candle plot(as far as I know) and I am only allowed a certain number of plots to go on the chart, so I put as many price moves ahead as I could to project the future price. It's a bit sloppy with all those forced plots but it gets the job done. I'll see if I can improve it with a moving average or something and possibly make a strategy out of it in the future.
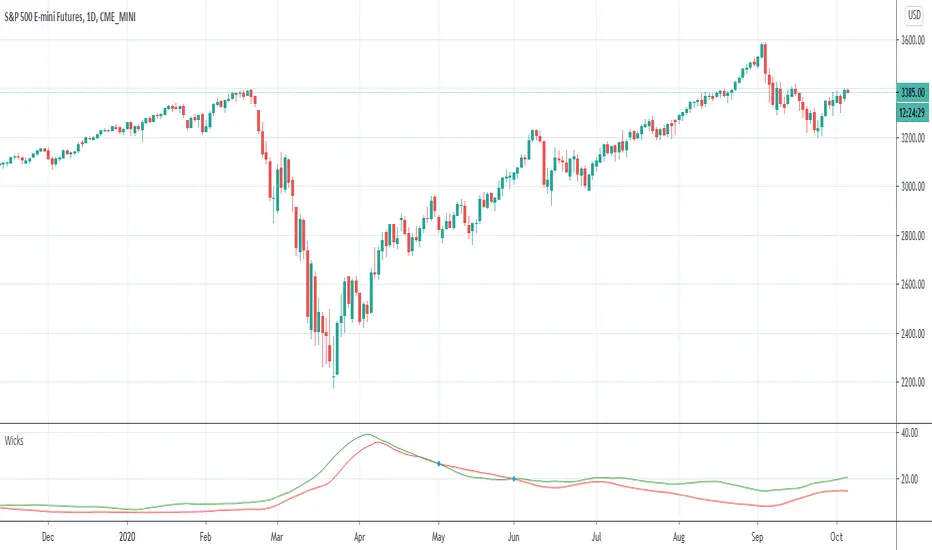
Moving Average of Upper and Lower Wicks with optional smoothingIn the book, The New Technical Trader by Tushar Chande and Stanley Kroll there is a part that talks about candlestick analysis and how the wicks play a role on how the price will behave. When wick lengths increase then there could be uncertainty. Weakening of support and resistance levels can also be seen by the size of the candlestick wicks or shadows. Shoutouts to Mango2Juice from Tradingview and the The Academy of Forex for helping me out in making this and providing the moving averages function.
When combined with other indicators or strategies, I find that this increases their accuracy when used correctly. For those that believe in price action, this might be worth a try. The book has only a brief section on candlestick wicks but it is one of the most interesting ideas I found. The book likes to include a simple moving average in its indicators with a certain length to provide a smoothing type of effect or a sort of extra indicator for the other to be above to give off quicker signals at the cost of accuracy. For this indicator it acts as a smoothing type effect which I put in because it is hard to see the slope and direction of where the moving averages of the wicks are going. The type of moving averages to use and the correct lengths are questionable and are not explained well in the book. If anyone can figure out a good use for this or know better settings or tips, please let me know.