Ben D"s IndicatorIt Auto Draws and Detects, Channels draws buy and sell signals based on over bought, oversold and a few other indicators. It works on all time frames! Enjoy! Leave a comment if you like it.
Auto

Scaling_mastery:Free TrendlinesScaling_mastery Trendlines is a clean, trading-ready smart trendline tool built for the Scaling_mastery community.
It automatically finds swing highs/lows and draws dynamic trendlines or channels that stay locked to price, on any symbol and any timeframe.
🔧 Modes
Trendline type
Wicks – classic trendlines anchored on candle wicks (high/low).
Bodies – trendlines anchored on candle bodies (open/close), great for closing structure.
Channel – 3-line channel:
outer lines form a band around price
middle line runs through the centre of the channel
thickness is adjustable (Small / Medium / Large).
Trend strength
Controls how strong the pivots must be to form a line.
Weak → more lines, reacts faster.
Medium → balanced, good for most pairs.
Strong → only the cleanest swings, higher-probability trendlines.
🎨 Visual controls
Max support / resistance lines – cap how many lines are kept on chart.
Show broken lines – hide broken trendlines or keep them for structure history.
Extend lines – None / Right / Both.
Support / Resistance colors – separate colors for active vs broken.
Channel thickness – Small / Medium / Large (0.5% / 1% / 2% of price).
Channel outer lines – color for channel edges.
Channel middle line – color + style (dotted / dashed / solid).
Broken lines are automatically faded + dotted, so you can instantly see what’s still respected and what’s already been taken out.
🧠 How to use
Add the indicator to any chart.
Start with:
Trendline type: Wicks
Trend strength: Strong
Max lines: 1–2 for both support & resistance
Once you like the behavior, experiment with:
Switching between Wicks / Bodies / Channel
Adjusting Channel thickness and Trend strength
Use the lines as a visual confluence tool with your own strategy:
HTF trend direction
LTF entries / retests
Liquidity grabs around broken lines
This script doesn’t generate entries or risk management – it’s designed to give you clean, reliable structure so you can execute your own edge.
⚠️ Disclaimer
This tool is for educational and visual purposes only and is not financial advice.
Always do your own research and manage risk.

Gabriel's Squeeze Momentum📊 Gabriel’s Squeeze Momentum — Deluxe Volatility + Momentum Suite
An advanced, all-in-one squeeze & momentum framework that times volatility compression/expansion and trend shifts, with optional CVD (cumulative volume delta) momentum, ATR zone context, Discontinued Signal Lines (DSL) scalps, Colored DMI trend label, Williams VIX Fix (WVF) low-volatility exhaustion pings, Buff’s VTTI/VPCI volume confirmation, and real-time divergence detection.
What it does:
Discover Squeezes. They occur when volatility contracts, often preceding significant price moves.
Measures momentum with a fast, ATR-normalized linear regression—optionally on Price or CVD—so you see direction and “how hard it’s pushing.”
🧭 Signal Legend ~ Colors the squeeze so you instantly know regime:
🟡 / 🟣 (Tight/Very Tight): Coiled spring; prepare a plan.
🔴 / ⚫ = (Regular/Wide): Watch for Divergences between Price and Momentum.
🟢 (Fired): Expansion started; trade with momentum cross and bias.
Adds context bands at ±1/±2/±3 ATR (“trend / expansion / OB-OS”) to filter late or weak signals.
DSL (Discontinued Signal Lines) give early scalp flips on momentum vs. adaptive bands.
DMI label & triangles communicate trend strength and whether +DI / −DI is in control.
Williams VIX Fix flags capitulation/exhaustion style spikes (with optional VIX proxy).
VTTI/VPCI modules confirm when volume aligns with price trend or contradicts it.
Divergences (regular & hidden) auto-draw with optional live (may repaint) or on-close.
🎢 Squeeze Momentum — How the Logic Works 🎢
The Squeeze Momentum model is built on the principle of volatility compression and expansion. In markets, periods of low volatility are often followed by explosive moves, while high volatility eventually contracts. The “squeeze” seeks to identify these compression phases and prepare traders for the likely expansion that follows.
This indicator achieves that by comparing Bollinger Bands (BB) to Keltner Channels (KC).
Bands: Bollinger vs. Keltner
Bollinger Bands (BB): Calculated using a Simple Moving Average (SMA) of price and standard deviations (σ) of the closing price. The bands expand and contract depending on volatility.
Keltner Channels (KC): Built from an SMA plus/minus multiples of the Average True Range (ATR). Unlike some simplified squeeze indicators that approximate ATR, this implementation uses a true ATR-based KC, ensuring accuracy across different assets and timeframes.
By comparing whether the Bollinger Bands are inside or outside the Keltner Channels, the indicator identifies different squeeze regimes, each representing a distinct volatility environment.
📦 Regime Colors
The squeeze states are color-coded for quick interpretation:
🔹Wide Squeeze (⚫): BB inside KC with a high ATR multiplier. Extremely low volatility, often before major expansion.
🔹Normal Squeeze (🔴): BB inside KC with a moderate ATR multiplier (about 25% more sensitive than Wide). Typical compression setting.
🔹Narrow Squeeze (🟡): BB inside KC with a lower ATR multiplier (about 50% more sensitive than Wide). Signals tighter compression.
🔹Very Narrow Squeeze (🟣): BB inside KC with the lowest ATR multiplier (100% more sensitive than Wide). Indicates extreme coiling.
🔹Fired Squeeze (🟢): BB break outside KC. Marks the release of volatility and potential trend acceleration.
This multi-layered system improves upon classical SQZPRO by using precisely calculated Keltner Channels and multiple sensitivity levels, giving traders more granular information about volatility states.
🔒 Multi-Timeframe Support
The indicator automatically adjusts squeeze thresholds for different timeframes — hourly, 4-hour, daily, weekly, and monthly charts. Each regime has been manually tuned for its timeframe, allowing traders to use the same tool whether scalping, swing trading, or holding longer-term positions.
🎯 Momentum Core
Detecting a squeeze is only half the equation — the indicator also includes a momentum engine to determine direction and strength.
Price momentum is measured as the distance of Close from its Highest High and Lowest Low range, smoothed with a Simple Moving Average, and refined with Linear Regression.
This value is then divided by ATR, normalizing momentum relative to volatility.
Optionally, CVD Mode (Cumulative Volume Delta ÷ Volume) can replace price momentum for assets where order-flow and volume dynamics dominate (e.g., crypto).
🦆 Signal Line
Momentum is paired with a Simple Moving Average signal line:
🔹Bullish: Momentum > Signal.
🔹Bearish: Momentum < Signal.
This crossover logic provides directional bias and filters for false squeezes.
🚀 When to Use Price vs. CVD
CVD Mode (Crypto, FX with tick volume): Best for assets with strong volume/order-flow signals.
Price Mode (Equities, Commodities, Higher TFs): Best for assets with irregular or thin volume data.
🛢️ATR Zones (context filter) 🛢️
Its design is straightforward yet effective: it measures the difference between the current price from its highest highs, lowest lows, and a moving average over a chosen period, then expresses that difference in terms of the Average True Range (ATR) over the same period. By normalizing price deviations against volatility, ATR provides a clear sense of how far and how fast price is moving relative to its “normal” range.
Interpreting the Zone
Positive Values: When it is above zero, price is trading above its HH, LL, and moving average, suggesting bullish momentum. The higher the value, the stronger the momentum relative to volatility.
Negative Values: When the Momentum is below zero, price is trading below its HH, LL, and moving average, signaling bearish momentum. The deeper the reading, the stronger the downside pressure.
Magnitude Matters: Because the Momentum is expressed in ATR units, traders can immediately gauge whether the move is small (less than 1 ATR), moderate (1–2 ATRs), or extreme (3+ ATRs). This makes it especially useful for assessing overbought or oversold conditions in a normalized way.
Strengths:
🔹Volatility-Normalized: Unlike simple squeeze momentum oscillators that have different OB/OS levels, this Momentum adjusts for volatility. This makes signals more consistent across assets with different volatility profiles.
🔹Simplicity:
±1 ATR: trending zone (bulls above +1, bears below −1)
±2 ATR: expansion (keep, add, or trail). Stretch/risk of mean reversion.
±3 ATR: potential exhaustion/mean-revert zone.
🔹Momentum Clarity: By framing momentum in ATR terms, it is easier to distinguish between a small deviation from trend and a genuinely significant move. Sometimes it is a good sign that it trend to ±3/2 ATR, looks for similar directional moves.
Color: The script shades +2/+3 (OB) and −2/−3 (OS) areas and provides swing alerts at ±1 ATR.
💚 What Are Discontinued Signal Lines (DSL)? 💚
In technical analysis, one of the most common tools for smoothing out noisy data is the signal line. This concept appears in many indicators, such as the MACD or stochastic oscillator, where the raw value of an indicator is compared to a smoothed version of itself. The signal line acts as a lagging filter, making it easier to identify shifts in momentum, crossovers, and directional changes.
While useful, the classic signal line approach has limitations. By design, a single smoothed line introduces lag, which means traders may receive signals later than ideal. Additionally, a one-size-fits-all smoothing process often struggles to adapt to different levels of volatility or rapidly changing market conditions.
This is where Discontinued Signal Lines (DSL) come in. DSL is an advanced extension of the traditional signal line concept. Instead of relying on just one smoothed comparison, DSL employs multiple adaptive lines that adjust dynamically to the current state of the indicator. These adaptive lines effectively “discontinue” the dependence on a single, fixed smoothing method, producing a more flexible and nuanced representation of market conditions.
How DSL Works?
Traditional Signal Line: Compares an the Momentum against its own moving average. Provides crossover signals when the raw indicator value moves above or below the smoothed line.
Strength: reduces noise. Weakness: delayed signals and limited adaptability.
DSL Extension: Uses multiple adaptive lines that respond differently to the indicator’s current behavior. Instead of one static moving average, the DSL approach creates faster and slower “reaction lines.” These lines adapt dynamically, capturing acceleration or deceleration in the indicator’s state.
Result: Traders see how momentum is evolving across multiple adaptive thresholds. This reduces false signals and improves responsiveness in volatile conditions.
Benefits of Discontinued Signal Lines
🔹Nuanced Trend Detection
DSL doesn’t just flag when momentum changes direction—it shows the quality of that shift, highlighting whether it is gaining strength, losing steam, or consolidating.
🔹Adaptability Across Markets
Because DSL adjusts to the Momentum’s own dynamics, it works well across different asset classes and timeframes, from equities and futures to forex and crypto.
🔹Earlier Signal Recognition
Multiple adaptive lines allow traders to spot developing trends earlier than with a single smoothed signal line, without being overwhelmed by raw indicator noise.
🔹Better Confirmation
DSL is particularly useful for confirmation. If both adaptive lines agree then a fill is applied in the direction, confidence in the trend is higher as the color turns bull/bear.
🔹Practical Uses
Momentum Trading: Spot acceleration or deceleration in trend strength.
Trend Confirmation: Verify whether a breakout has momentum behind it.
Noise Filtering: Smooth out erratic moves while retaining adaptability.
⚖️ Colored Directional Movement Index (CDMI) ⚖️
The Directional Movement Index (DMI), created by J. Welles Wilder, is one of the most respected trend-following indicators in technical analysis. It is actually a family of three separate indicators combined into one: the +DI (Positive Directional Indicator), the –DI (Negative Directional Indicator), and the ADX (Average Directional Index). Together, they measure not only whether the market is trending but also the strength of that trend. Traders have used the DMI for decades to identify trend direction, gauge momentum, and filter out periods of market noise.
However, despite its reliability, the traditional DMI can be challenging to interpret. Reading three separate lines at once and extracting meaningful signals requires both experience and careful observation. This complexity often discourages newer traders from fully utilizing its power.
The Colored Directional Movement Index (CDMI) is a modern reinterpretation of Wilder’s classic tool. It condenses the same information into a single visual line while using color, shape, and density to communicate what’s happening beneath the surface. The goal is simple: make the DMI’s insights faster to read, easier to act upon, and more intuitive to integrate into trading decisions.
Key Features of CDMI
🔹Color Scale for Trend Strength
The main triangle changes its base color depending on the strength of the DI reading. Dark Red or Green, colors correspond to stronger trends, while faded Gray or lighter yellow tones signal weaker or fading trends. This makes it visually clear when the market is consolidating versus trending strongly.
🔹Color Density for Momentum
Beyond strength, the CDMI uses color density to represent momentum in the trend’s strength. If the ADX is rising (trend gaining momentum), the triangles grows more darker. If the ADX is falling (trend losing momentum), the triangle becomes paler. This provides an instant sense of whether a trend is accelerating or decelerating.
🔹Directional Triangles for Trend Direction
To replace the separate +DI and –DI lines, the CDMI plots small triangle shapes along the bottom axis. An upward-facing triangle indicates that +DI is dominant, confirming bullish direction. A downward-facing triangle signals –DI dominance, confirming bearish direction. This way, both strength and direction are shown without the clutter of multiple overlapping lines.
🔹Label Display for Detailed Values
For traders who want precise data alongside the visuals, CDMI includes a label that shows:
Current trend strength (ADX value).
Current +DI and –DI values.
Momentum status of the ADX (rising or falling).
Historical values of DMI readings, so traders can track how the indicator has evolved over time.
Tooltips are also available to explain “How to read the colored DMI line”, making this version more beginner-friendly.
Why CDMI Matters
The CDMI retains the proven reliability of Wilder’s DMI while solving its biggest drawback—interpretation difficulty. Instead of juggling three separate plots, traders get a single, information-rich line supplemented with intuitive shapes and labels. This streamlined format makes trend verification, momentum analysis, and signal confirmation much faster.
For trading applications, the CDMI can help:
Confirm Entries by showing whether the market is trending strongly enough to justify a position.
Avoid False Signals by filtering out periods of low ADX (weak trend).
Enhance Timing by tracking momentum shifts in trend strength.
By simplifying the complexity of the original DMI into an elegant, color-coded tool, the CDMI makes one of technical analysis’ most advanced indicators practical for everyday use.
😅 The VIX, the Williams Vix Fix, and Market Bottoms 😎
The VIX, formally known as the CBOE Volatility Index, has long been considered one of the most reliable indicators for spotting major market bottoms. Often referred to as the “fear gauge,” it measures the market’s expectation of volatility in the S&P 500 over the next 30 days. When fear grips investors and volatility spikes, the VIX rises sharply. Historically, these moments of extreme fear often coincide with powerful buying opportunities, as markets have a tendency to rebound once panic selling exhausts itself.
Larry Williams, a well-known trader and author, developed the Williams Vix Fix as a way to replicate the insights of the VIX across any tradable asset. While the VIX itself is tied specifically to S&P 500 options, Williams wanted a tool that could capture similar panic-driven dynamics in stocks, futures, forex, and other markets where the VIX is not directly applicable. His “fix” uses price action and volatility formulas to approximate the same emotional extremes reflected in the official VIX, creating almost identical results in practice. This makes the Williams Vix Fix a powerful addition to the trader’s toolbox, allowing the same principle that works on U.S. equities to be applied universally.
One of the most important characteristics of both the VIX and the Williams Vix Fix is that they are far more reliable at signaling market bottoms than market tops. The reason is psychological as much as it is mathematical. At market bottoms, fear and panic are widespread. Retail investors often capitulate, selling in a frenzy as prices drop. This panic drives volatility higher, producing the spikes we see in the VIX. At the same time, professional traders and institutions—those with larger capital and more disciplined strategies—tend to step in when volatility is stretched. They buy when others are fearful, using the panic of retail investors as an opportunity to acquire assets at discounted prices. This confluence of retail panic and institutional buying power is what makes the VIX such a strong bottom-finding tool.
In contrast, at market tops, the dynamic is very different. Tops tend not to be marked by panic or fear. Instead, they form quietly as enthusiasm fades, liquidity dries up, and buying interest wanes. Investors are often complacent, assuming prices will continue to rise, while professional money begins distributing their positions. Because there is no surge in fear, volatility remains muted, and the VIX does not offer a clear warning. This is why traders who rely on the VIX or the Williams Vix Fix must understand its limitations: it is exceptional for detecting bottoms but less useful for anticipating tops.
For traders, the lesson is straightforward. When you see the VIX or Williams Vix Fix spiking to extreme levels, it often indicates a high-probability environment for a rebound. These tools should not be used in isolation, but when combined with support levels, sentiment indicators, and market breadth, they can provide some of the most reliable bottom-fishing signals available. While no indicator is perfect, few have stood the test of time as consistently as the VIX—and thanks to Williams’ adaptation, its power can now be applied to nearly every market.
Indicator Signals (Great in risk-off charts):
🔹Flags spike events (tops/bottoms) with both original and filtered (AE/FE) criteria.
🔹Great as a risk overlay: tighten stops into AE/FE, or require “no spike” to enter.
🤯 Volume Comfirmation: VTTI & VPCI (Buff Dormeier) 🤯
Volume Trend Technical Indicator (VTTI)
The Volume Trend Technical Indicator (VTTI) is a momentum-style tool that analyzes how volume trends interact with price movement. Unlike basic volume measures that simply report how many shares or contracts were traded, the VTTI evaluates whether volume is expanding or contracting in the same direction as the prevailing price trend. The underlying logic is that healthy trends are supported by rising volume, while weakening trends often occur on shrinking volume.
At its core, VTTI looks at the rate of change in volume compared to price movements. By smoothing and normalizing these relationships, the indicator helps traders determine whether momentum is accelerating, decelerating, or diverging.
Rising VTTI: Suggests that volume is confirming the current price trend, strengthening the case for continuation. Flips BG Green after crossing it's signal.
Falling VTTI: Indicates that the trend may be losing participation, often a sign of possible consolidation or reversal. Flips BG Red after crossing it's signal.
Traders often use VTTI to filter entries and exits. For example, if price breaks out but VTTI does not rise above zero, the breakout may lack conviction. On the other hand, when both price and VTTI are aligned, probability of continuation improves.
Volume Price Confirmation Indicator (VPCI)
The Volume Price Confirmation Indicator (VPCI), developed by Buff Dormeier, takes the relationship between price and volume a step further. While traditional indicators like On-Balance Volume (OBV) or Chaikin Money Flow look at cumulative patterns, VPCI breaks price and volume into trend and volatility components and then recombines them to measure how well they confirm each other.
In essence, VPCI asks: “Does volume confirm what price is signaling?”
The formula integrates:
Price Trend Component – whether the market is trending upward or downward.
Volume Trend Component – whether trading activity supports that price trend.
Volatility Adjustments – to account for irregular swings.
The resulting oscillator fluctuates around a zero line:
Positive VPCI: Indicates that price and volume trends are in agreement (bullish confirmation).
Negative VPCI: Suggests that price and volume are diverging (bearish warning or false move).
Crossovers of Zero: Can serve as potential buy or sell signals, depending on context.
A key strength of VPCI is its sensitivity to divergence. When prices continue rising but VPCI begins falling, it often foreshadows a weakening rally. Conversely, a rising VPCI during a flat or down market can highlight early accumulation.
VTTI (Entry Signal) vs. VPCI (Exit Signal)
While both indicators study price-volume dynamics, their focus differs:
VTTI is simpler, emphasizing the trend of volume relative to price for momentum confirmation.
VPCI is more advanced, decomposing both price and volume into multiple components to produce a nuanced oscillator.
Used together, they provide complementary insights. VTTI helps quickly spot whether volume is supporting a move, while VPCI offers deeper confirmation and highlights subtle divergences.
Note: The Up/Down Volume Alert works better on the 4 HR, for Daily scalps or 30 minute for HR scalps. Intraday it's 2/10 minute.
🦅 Divergence toolkit 🦅
Divergences in Technical Analysis
Divergence occurs when the price action of an asset moves in one direction while a technical indicator, such as RSI, MACD, or Momentum, moves in the opposite direction. This disagreement between price and indicator often signals a shift in underlying market dynamics. Traders use divergences to anticipate either potential reversals or continuations in trends.
There are two main types of divergences: regular divergences, which typically precede reversals, and hidden divergences, which suggest continuation of the current trend.
Regular Divergence (Reversal Signals)
A regular divergence occurs when price and indicator disagree during a trend extension. These divergences signal that momentum is no longer fully supporting the current trend and that a reversal may be imminent.
🔹Regular Bullish Divergence
Price Action: Forms a lower low.
Indicator: Forms a higher low.
Interpretation: Price is making new lows, but the indicator is gaining strength. This suggests that selling pressure is weakening, and a reversal to the upside may occur.
Example: RSI rising while price dips to fresh lows.
🔹Regular Bearish Divergence
Price Action: Forms a higher high.
Indicator: Forms a lower high.
Interpretation: Price is reaching new highs, but the indicator shows weakening momentum. This implies that buying pressure is fading, warning of a potential downside reversal.
Example: MACD histogram falling while price makes higher highs.
Regular divergences are often spotted near the end of trends and are most powerful when aligned with key support/resistance levels or overbought/oversold conditions.
Hidden Divergence (Continuation Signals)
A hidden divergence occurs during retracements within a trend. Unlike regular divergences, hidden divergences suggest that the prevailing trend still has strength and is likely to continue.
🔹Hidden Bullish Divergence
Price Action: Forms a higher low.
Indicator: Forms a lower low.
Interpretation: Price is retracing within an uptrend, but the indicator is overshooting downward. This shows that momentum remains intact, supporting continuation upward.
🔹Hidden Bearish Divergence
Price Action: Forms a lower high.
Indicator: Forms a higher high.
Interpretation: Price is retracing within a downtrend, while the indicator overshoots upward. This indicates that bearish momentum remains strong, supporting continuation downward.
Hidden divergences often appear during pullbacks, helping traders time entries in the direction of the prevailing trend.
Practical Use of Divergences
🔹Trend Reversal Alerts – Regular divergences are early warnings that a trend may be ending.
🔹Trend Continuation Signals – Hidden divergences help confirm that retracements are simply pauses, not full reversals.
🔹Confluence with Other Tools – Divergences are more reliable when combined with support/resistance, candlestick patterns, or volume analysis.
🔹Multi-Timeframe Analysis – Spotting divergences on higher timeframes often produces stronger signals.
🕭🔔🛎️ Alert 🛎️🔔🕭
🔹Squeeze
🟢 Fired Squeeze
⚫ Low (Wide) Squeeze / 🔴 Normal / 🟡 Tight / 🟣 Very Tight
🔹Momentum
🐂 Bullish Trend Reversal (Crossover of Momentum and Signal from sub −2)
🐻 Bearish Trend Reversal (Crossover of Momentum and Signal from above +2)
📈 Bullish Swing (cross above +1 ATR) / 📉 Bearish Swing (cross below −1 ATR)
🔹DSL
💚 Bullish DSL Scalp / 💔 Bearish DSL Scalp
🔹Volume
🎯 Strong Up Volume (VPCI > 0 and VTTI up)
⏳ Strong Down Volume (VPCI < 0 and VTTI down)
🔹Divergences
🦅 Bullish, 🦆 Bearish, 🦅 Bullish Hidden, 🦆 Bearish Hidden
Management: Search Vanguard ETFs in your browser, look up full list of VOO holdings. Download it, or copy paste all the ticker symbols. Place that with a AI, just ask it to place , in between each ticker. NVDA, TSLA, AVGO, etc. Create a new watchlist, in the + add all tickers separated by commas. Place a watchlist alert ⚠️ only available for premium + subscribers.
Practical playbook
1) Classic Squeeze Break
Setup: 🔴(D)/🟡(2D)/🟣(3D) squeeze → wait for 🟢(1HR) Fired.
Confirm: Momentum > Signal and above +1 ATR (or DMI strong & rising).
Manage: add on pullbacks that hold +1 ATR; scale near +2 ATR or WVF AE/FE.
2) DSL Scalp in Trend
Setup: Clear trend (DMI strong) + DSL bull/bear trigger in the direction of trend.
Filter: avoid tight/very tight yellow/purple unless you want micro-scalps.
Exit: opposite DSL or ATR midline loss.
3) Mean-Reversion Fade
Setup: Momentum extended to ±3 ATR, WVF spike, and a regular divergence.
Entry: Counter signal only when mom crosses back through ±3 ATR toward mid. Exit early if squeeze ⚫/🔴, Momentum may extend to ±3/2 ATR in the same direction.
Risk: reduce size; this is a fade, not trend following.
4) Volume-Confirmed Breakout
Setup: Squeeze → 🟢 Fired + VPCI > 0 and VTTI up → trend continuation.
Manage: trail behind +1 ATR (long) or −1 ATR (short). 9 SMA works good.
Inputs at a glance (key ones)
Mode: Price or CVD momentum; Squeeze Sensitivity (σ); Momentum Length; Signal Length; ATR Smoothing.
🧮 Colors:
SQZMOM: per squeeze regime, momentum, ATR fills.
DSL: On/Off, Fast/Slow, Length.
ATR Zones: Bullish/Bearish levels (±1), ±2/±3 zone lines & fills.
DMI: Lengths, key & weak thresholds, label on/off.
WVF/VIX: Lookbacks, bands, AE/FE toggles, VIX proxy symbol.
VTTI/VPCI: Fast/slow/signal (VTTI), Short/Long (VPCI), and volume source (Tick/CVD/NVI/PVI/OBV/PVT/AccDist/VWAP).
Divergences: Regular/Hidden toggles, Sensitivity %, Lifetime, Live vs On-Close, Lines/Labels.
🔎 Suggested defaults (feel free to tweak)
Calibration: Size Momentum, so that when it's above zero the asset is trending up. For the signal, it can be kept the same or lower.
Intraday (60–240m): σ = 2.0, 18~20, 3~5, DSL Fast, DMI key 23, weak 17.
Daily/Weekly: keep σ = 2.0, consider DSL Slow, DMI key 25, weak 20, widen ATR filters; lean on VPCI/VTTI (4-HR).
CVD mode: use where tick/volume quality is high (index futures, liquid equities, crypto majors).
🪟 Tips & caveats
Swing Screener: Favor liquid underlyings (index futures/ETFs, large caps). Large-Cap, 2 M Vol, Mid-Cap, 500K Vol. Squeeze: BB( 20) upper < KC (20) upper, and BB (20) lower > KC (20) lower. Optional: Price above 9 SMA, 21 SMA, and 50 SMA, they are my SMA of choice. 200 SMA too, unless you are willing to fish in a bear market. Vice-versa for shorts. Optional: ADX 4 HR > 17, or 23 depending on what you are looking for.
Scalp Screener: Same as above, change the D 9 SMA to 5, and the BB/KC from D to 1 HR. Scalps may last 2~3 days.
Position Screener: Change all daily setting to W, aside from Volume. Optional: PEG < 1.5, FCF > 0, ROA > 8% or ROE > 6%.
Good with Moving averages (9/21/50) and low-volume zones.
Position size by IV, ATR, and account risk. Consider stop/hedge rules around ±2/±3 ATR.
Let alerts stage your watchlist; act only on combined squeeze + momentum signals.
Divergences in live mode can repaint (Real-Time); for algo or alerts, use on-close.
Tight/Very tight squeezes are great for scalps but choppy; combine with DMI rising + VPCI>0.
±3 ATR is exhaustion context, not an auto-fade—look for WVF/Div/DSL confirmation.
For alerts, pair “Fired Squeeze + Bullish Swing” (or bearish) to avoid false starts.
🎯 How to Trade Entry ~ Recap:
Tight/very tight squeeze → fires → momentum crosses up (or DSL bull).
Exit/Flip: Momentum crosses down into/after expansion or hits +2/+3 ATR with fade signs. Filter: Avoid fresh longs at +3 ATR; avoid fresh shorts at −3 ATR unless fading with confirmation.
📐 Options Integrations
✅ Risk Reversal/Modified Risk Reversal (Bullish: Short Put + Long Call)
Use when: Squeeze fires up from 🟡/🟣 and momentum crosses above signal (or zero/DSL).
Playbook Entry: On or just after the bullish fire and momentum upcross. DMI or Volume supports trend as well.
Structure: Sell a put at/just below the −2 ATR reference (or recent swing support). Buy a call at/above the breakout zone (prior high/mid-range +1 to +2 ATR).
A classic risk reversal is a long call plus a short put. That’s a very bullish structure—you gain if the price rallies (via the call), and you collect a premium by selling a put. But it has a naked downside risk. The modified risk reversal fixes that by adding a long lower put (making the short put into a defined put credit spread).
Management: If momentum stays above signal, ride toward +2 → +3 ATR. Sell the put near the current price → receive big premium. Buy the lower put → spend part of that premium (risk cap). Buy the call above the current price → spend more, but the short put premium mostly pays for it.
Exits/Adjust: Momentum downcross or squeeze flips back on (new compression) → reduce. If price retests −1/−2 ATR and holds, you can roll the short put down/out.
Breakout = Big Success; No Breakout = you keep the initial credit. Reversal = Max loss is capped by the long lower put.
✅ Iron Condor (Neutral: Short OTM Put Spread + Short OTM Call Spread)
Use when: Squeeze is active (🟡/🟣), momentum is flat near zero, and there is no directional edge. 🟢 lasts for around 5~8 bars typically. I measure the historical duration of it, and wait for a range period to occur.
Playbook Entry: During compression, set wings outside ±2 ATR (or recent range extremes). I prefer identifying boxes where the rectangle pattern occurs on the chart.
Management: Time decay works while price remains trapped in the coil. High-winrate ~80%, but 1 loser can wipe most of the gains.
Exits/Adjust: If a squeeze fires and momentum breaks hard one way, close the losing side, consider converting to a vertical or rotating to a directional spread aligned with momentum.
4HR-Bullish, closing one wing:
Tip: Align daily/weekly context with your intraday entries. 9 > 50 on Weekly, similar on Daily. Sell premium into compression; switch to directional spreads on expansion and momentum confirmation.
✅ Naked Call/Puts (Directional: 10~30 Delta Calls)
Stick to naked calls and puts when the squeezes are fired from either 🔴 or ⚫.
Look for Strikes slightly out of the money with an OI and Volume spread less than <10%.
If Strike Date is >45, manage 21 Days before expiration. Scalp: Expiration Strikes of 1/4 of the Squeeze period. Leap: Expiration Strikes of 1.75x of the Squeeze period.
📐 Futures Integrations
Playbook Entry:
Verify if the squeeze on the hourly is red or green, and enter on the 2- or 5-minute during a similar squeeze state.
Trend-Following: Traditional 2 Renko Block above 21 SMA and Momentum is bullish, or vice versa. (2~ES, 5~NQ)
Structure: Go long at/just below the ATR reference (or recent swing support). Exit below the breakout zone (prior high/mid-range +1 to +2 ATR).
Management: If momentum stays above +1 ATR ride toward +2 → +3 ATR, etc. House-money, should be kept.
Exits/Adjust: Momentum downcross or squeeze flips back on (new compression) → exit. On Renko Charts, lower the sensitivity to 0.7~1. If price retests 0/−1/−2 ATR and holds, you can enter when the 9 SMA flips. The 50 SMA is better for Daily and up; I wouldn't trade against it then.
📌 FOMO Trading Playbook
Credits & License
Credits: @JF10R (Multi-Timeframe Squeeze), @BigBeluga (DSL), @OskarGallard (Colored DMI base), @ChrisMoody (WVF ideas), @PineCodersTASC (VTTI/VPCI), @EliCobra (Divergence toolkit).
License: Mozilla Public License 2.0 (MPL-2.0).
Author: © GabrielAmadeusLau

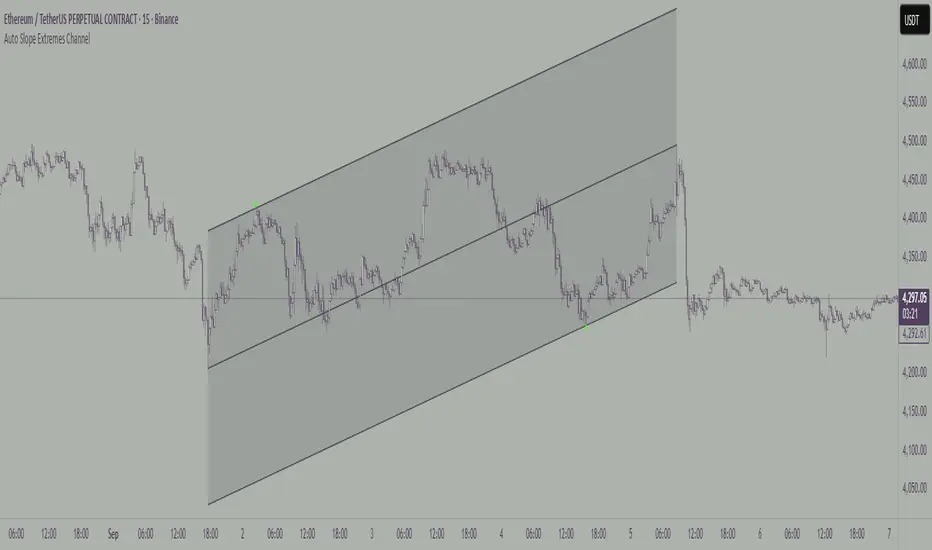
Auto Slope Extremes ChannelAuto Slope Extremes Channel
Expanding channel that locks onto the highest high and lowest low of the slope between A and B.
This indicator builds a dynamic channel between two anchors, A and B.
Unlike fixed-width channels, it adapts to the slope of the leg between A and B and expands until:
• The upper channel line touches the highest candle in that slope.
• The lower channel line touches the lowest candle in that slope.
This method ensures that the channel edges are defined only by the single most extreme high and the single most extreme low within the selected leg. No other candles in the range touch the edges.
A centerline is drawn midway between the two extremes, and small triangle markers highlight the exact candles that determine the upper and lower boundaries.
Features
• Anchored channel defined by two user-selected points (A and B).
• Expands to fit the highest high and lowest low of the slope between A and B.
• Optional centerline and channel fill.
• Extend lines left, right, or both.
• Customizable line widths and colours.
Adaptive Squeeze Momentum +Adaptive Squeeze Momentum+ (Auto-Timeframe Version)
Overview
Adaptive Squeeze Momentum+ is an enhanced volatility and momentum indicator designed to identify compression and expansion phases in price action. It is inspired by the classic Squeeze Momentum Indicator by LazyBear but introduces automatic parameter adaptation to any timeframe, making it simpler to use across different markets without manual configuration.
Concepts and Methodology
The script combines Bollinger Bands (BB) and Keltner Channels (KC) to detect periods when volatility contracts (squeeze) or expands (release).
A squeeze occurs when BB are inside KC, suggesting low volatility and potential breakout scenarios.
A squeeze release is detected when BB expand outside KC.
Momentum is derived using a linear regression applied to the difference between price and a midrange reference level.
Original Improvements
Compared to the original Squeeze Momentum Indicator, this version offers several enhancements:
Automatic Adaptation: BB and KC lengths and multipliers are dynamically adjusted based on the chart’s timeframe (from 1 minute up to 1 month), removing the need for manual tuning.
Simplified Visualization: A clean, minimalist histogram and clear squeeze state cross markers allow for faster interpretation.
Flexible Application: Designed to work consistently on intraday, daily, and higher timeframes across crypto, forex, stocks, and indices.
Features
Dynamic Squeeze Detection:
Gray Cross: Neutral (no squeeze detected)
Blue Cross: Active squeeze
Yellow Cross: Squeeze released
Momentum Histogram:
Positive/negative momentum shown with slope-based coloring.
Timeframe-Aware Parameters:
Automatically sets optimal BB/KC configurations.
Usage
Watch for blue crosses indicating an active squeeze phase that may precede a directional move.
Use the histogram color and slope to gauge momentum strength and direction.
Combine squeeze release signals with momentum confirmation for potential entries or exits.
Credits and Licensing
This script was inspired by LazyBear’s OLD “Squeeze Momentum Indicator” (). The implementation here significantly expands upon the original by introducing auto-adaptive parameters, restructured logic, and a new visualization approach. Published under the Mozilla Public License 2.0.
Disclaimer
This indicator is for educational purposes only and does not constitute financial advice. Use at your own risk.

Auto AI Trendlines [TradingFinder] Clustering & Filtering Trends🔵 Introduction
Auto AI trendlines Clustering & Filtering Trends Indicator, draws a variety of trendlines. This auto plotting trendline indicator plots precise trendlines and regression lines, capturing trend dynamics.
Trendline trading is the strongest strategy in the financial market.
Regression lines, unlike trendlines, use statistical fitting to smooth price data, revealing trend slopes. Trendlines connect confirmed pivots, ensuring structural accuracy. Regression lines adapt dynamically.
The indicator’s ascending trendlines mark bullish pivots, while descending ones signal bearish trends. Regression lines extend in steps, reflecting momentum shifts. As the trend is your friend, this tool aligns traders with market flow.
Pivot-based trendlines remain fixed once confirmed, offering reliable support and resistance zones. Regression lines, adjusting to price changes, highlight short-term trend paths. Both are vital for traders across asset classes.
🔵 How to Use
There are four line types that are seen in the image below; Precise uptrend (green) and downtrend (red) lines connect exact price extremes, while Pivot-based uptrend and downtrend lines use significant swing points, both remaining static once formed.
🟣 Precise Trendlines
Trendlines only form after pivot points are confirmed, ensuring reliability. This reduces false signals in choppy markets. Regression lines complement with real-time updates.
The indicator always draws two precise trendlines on confirmed pivot points, one ascending and one descending. These are colored distinctly to mark bullish and bearish trends. They remain fixed, serving as structural anchors.
🟣 Dynamic Regression Lines
Regression lines, adjusting dynamically with price, reflect the latest trend slope for real-time analysis. Use these to identify trend direction and potential reversals.
Regression lines, updated dynamically, reflect real-time price trends and extend in steps. Ascending lines are green, descending ones orange, with shades differing from trendlines. This aids visual distinction.
🟣 Bearish Chart
A Bullish State emerges when uptrend lines outweigh or match downtrend lines, with recent upward momentum signaling a potential rise. Check the trend count in the state table to confirm, using it to plan long positions.
🟣 Bullish Chart
A Bearish State is indicated when downtrend lines dominate or equal uptrend lines, with recent downward moves suggesting a potential drop. Review the state table’s trend count to verify, guiding short position entries. The indicator reflects this shift for strategic planning.
🟣 Alarm
Set alerts for state changes to stay informed of Bullish or Bearish shifts without constant monitoring. For example, a transition to Bullish State may signal a buying opportunity. Toggle alerts On or Off in the settings.
🟣 Market Status
A table summarizes the chart’s status, showing counts of ascending and descending lines. This real-time overview simplifies trend monitoring. Check it to assess market bias instantly.
Monitor the table to track line counts and trend dominance.
A higher count of ascending lines suggests bullish bias. This helps traders align with the prevailing trend.
🔵 Settings
Number of Trendlines : Sets total lines (max 10, min 3), balancing chart clarity and trend coverage.
Max Look Back : Defines historical bars (min 50) for pivot detection, ensuring robust trendlines.
Pivot Range : Sets pivot sensitivity (min 2), adjusting trendline precision to market volatility.
Show Table Checkbox : Toggles display of a table showing ascending/descending line counts.
Alarm : Enable or Disable the alert.
🔵 Conclusion
The multi slopes indicator, blending pivot-based trendlines and dynamic regression lines, maps market trends with precision. Its dual approach captures both structural and short-term momentum.
Customizable settings, like trendline count and pivot range, adapt to diverse trading styles. The real-time table simplifies trend monitoring, enhancing efficiency. It suits forex, stocks, and crypto markets.
While trendlines anchor long-term trends, regression lines track intraday shifts, offering versatility. Contextual analysis, like price action, boosts signal reliability. This indicator empowers data-driven trading decisions.

ROC + SMI Auto Adjust
This indicator combines the Rate of Change (ROC) and the Stochastic Momentum Index (SMI) with automatically adjusted parameters for different time frames (short, medium, long). It normalizes the ROC to match the SMI levels, displays the ROC as a histogram and the SMI as lines, highlights overbought/oversold zones and includes a settings table. Ideal for analyzing momentum on different time frames.
Key Features:
Automatic Parameter Adjustment:
The script detects the current chart time frame (e.g. 1-minute, 1-hour, daily) and adjusts the parameters for the ROC and SMI accordingly.
Parameters such as ROC length, SMI length and smoothing periods are optimized for short, medium and long term time frames.
Rate of Change (ROC):
ROC measures the percentage change in price over a specified period.
The script normalizes the ROC values to match the SMI range, making it easier to compare the two indicators on the same scale.
The ROC is displayed as a histogram, where positive values are colored green and negative values are colored red.
Stochastic Momentum Index (SMI):
SMI is a momentum oscillator that identifies overbought and oversold conditions.
The script calculates the SMI and its signal line, plotting them on the chart.
Overbought and oversold levels are displayed as dotted lines for convenience.
SMI and SMI Signal Crossover:
When the main SMI crosses the signal line from below upwards, it may be a buy signal (bullish signal).
When the SMI crosses the signal line from above downwards, it may be a sell signal (bearish signal).
Configurable Inputs:
Users can use the automatically adjusted settings or manually override the parameters (e.g. ROC length, SMI length, smoothing periods).
Overbought and oversold levels for SMI are also configurable.
Parameter Table:
A table is displayed on the chart showing the current parameters (e.g. timeframe, ROC length, SMI length) for transparency and debugging.
The position of the table is configurable (e.g. top left, bottom right).
How it works:
The script first detects the chart timeframe and classifies it as short-term (e.g. 1M, 5M), medium-term (e.g. 1H, 4H) or long-term (e.g. D1, W1).
Based on the timeframe, it sets default values for the ROC and SMI parameters.
ROC and SMI are calculated and normalized so that they can be compared on the same scale.
ROC is displayed as a histogram, while SMI and its signal line are displayed as lines.
Overbought and oversold levels are displayed as horizontal lines.
Use cases:
Trend identification: ROC helps to identify the strength of the trend, while SMI indicates overbought/oversold conditions.
Momentum analysis: The combination of ROC and SMI provides insight into both price momentum and potential reversals.
Time frame flexibility: The auto-adjustment feature makes the script suitable for scalping (short-term), swing trading (medium-term) and long-term investing.

*Auto Backtest & Optimize EngineFull-featured Engine for Automatic Backtesting and parameter optimization. Allows you to test millions of different combinations of stop-loss and take profit parameters, including on any connected indicators.
⭕️ Key Futures
Quickly identify the optimal parameters for your strategy.
Automatically generate and test thousands of parameter combinations.
A simple Genetic Algorithm for result selection.
Saves time on manual testing of multiple parameters.
Detailed analysis, sorting, filtering and statistics of results.
Detailed control panel with many tooltips.
Display of key metrics: Profit, Win Rate, etc..
Comprehensive Strategy Score calculation.
In-depth analysis of the performance of different types of stop-losses.
Possibility to use to calculate the best Stop-Take parameters for your position.
Ability to test your own functions and signals.
Customizable visualization of results.
Flexible Stop-Loss Settings:
• Auto ━ Allows you to test all types of Stop Losses at once(listed below).
• S.VOLATY ━ Static stop based on volatility (Fixed, ATR, STDEV).
• Trailing ━ Classic trailing stop following the price.
• Fast Trail ━ Accelerated trailing stop that reacts faster to price movements.
• Volatility ━ Dynamic stop based on volatility indicators.
• Chandelier ━ Stop based on price extremes.
• Activator ━ Dynamic stop based on SAR.
• MA ━ Stop based on moving averages (9 different types).
• SAR ━ Parabolic SAR (Stop and Reverse).
Advanced Take-Profit Options:
• R:R: Risk/Reward ━ sets TP based on SL size.
• T.VOLATY ━ Calculation based on volatility indicators (Fixed, ATR, STDEV).
Testing Modes:
• Stops ━ Cyclical stop-loss testing
• Pivot Point Example ━ Example of using pivot points
• External Example ━ Built-in example how test functions with different parameters
• External Signal ━ Using external signals
⭕️ Usage
━ First Steps:
When opening, select any point on the chart. It will not affect anything until you turn on Manual Start mode (more on this below).
The chart will immediately show the best results of the default Auto mode. You can switch Part's to try to find even better results in the table.
Now you can display any result from the table on the chart by entering its ID in the settings.
Repeat steps 3-4 until you determine which type of Stop Loss you like best. Then set it in the settings instead of Auto mode.
* Example: I flipped through 14 parts before I liked the first result and entered its ID so I could visually evaluate it on the chart.
Then select the stop loss type, choose it in place of Auto mode and repeat steps 3-4 or immediately follow the recommendations of the algorithm.
Now the Genetic Algorithm at the bottom right will prompt you to enter the Parameters you need to search for and select even better results.
Parameters must be entered All at once before they are updated. Enter recommendations strictly in fields with the same names.
Repeat steps 5-6 until there are approximately 10 Part's left or as you like. And after that, easily pour through the remaining Parts and select the best parameters.
━ Example of the finished result.
━ Example of use with Takes
You can also test at the same time along with Take Profit. In this example, I simply enabled Risk/Reward mode and immediately specified in the TP field Maximum RR, Minimum RR and Step. So in this example I can test (3-1) / 0.1 = 20 Takes of different sizes. There are additional tips in the settings.
━
* Soon you will start to understand how the system works and things will become much easier.
* If something doesn't work, just reset the engine settings and start over again.
* Use the tips I have left in the settings and on the Panel.
━ Details:
Sort ━ Sorting results by Score, Profit, Trades, etc..
Filter ━ Filtring results by Score, Profit, Trades, etc..
Trade Type ━ Ability to disable Long\Short but only from statistics.
BackWin ━ Backtest Window Number of Candle the script can test.
Manual Start ━ Enabling it will allow you to call a Stop from a selected point. which you selected when you started the engine.
* If you have a real open position then this mode can help to save good Stop\Take for it.
1 - 9 Сheckboxs ━ Allow you to disable any stop from Auto mode.
Ex Source - Allow you to test Stops/Takes from connected indicators.
Connection guide:
//@version=6
indicator("My script")
rsi = ta.rsi(close, 14)
buy = not na(rsi) and ta.crossover (rsi, 40) // OS = 40
sell = not na(rsi) and ta.crossunder(rsi, 60) // OB = 60
Signal = buy ? +1 : sell ? -1 : 0
plot(Signal, "🔌Connector🔌", display = display.none)
* Format the signal for your indicator in a similar style and then select it in Ex Source.
⭕️ How it Works
Hypothesis of Uniform Distribution of Rare Elements After Mixing.
'This hypothesis states that if an array of N elements contains K valid elements, then after mixing, these valid elements will be approximately uniformly distributed.'
'This means that in a random sample of k elements, the proportion of valid elements should closely match their proportion in the original array, with some random variation.'
'According to the central limit theorem, repeated sampling will result in an average count of valid elements following a normal distribution.'
'This supports the assumption that the valid elements are evenly spread across the array.'
'To test this hypothesis, we can conduct an experiment:'
'Create an array of 1,000,000 elements.'
'Select 1,000 random elements (1%) for validation.'
'Shuffle the array and divide it into groups of 1,000 elements.'
'If the hypothesis holds, each group should contain, on average, 1~ valid element, with minor variations.'
* I'd like to attach more details to My hypothesis but it won't be very relevant here. Since this is a whole separate topic, I will leave the minimum part for understanding the engine.
Practical Application
To apply this hypothesis, I needed a way to generate and thoroughly mix numerous possible combinations. Within Pine, generating over 100,000 combinations presents significant challenges, and storing millions of combinations requires excessive resources.
I developed an efficient mechanism that generates combinations in random order to address these limitations. While conventional methods often produce duplicates or require generating a complete list first, my approach guarantees that the first 10% of possible combinations are both unique and well-distributed. Based on my hypothesis, this sampling is sufficient to determine optimal testing parameters.
Most generators and randomizers fail to accommodate both my hypothesis and Pine's constraints. My solution utilizes a simple Linear Congruential Generator (LCG) for pseudo-randomization, enhanced with prime numbers to increase entropy during generation. I pre-generate the entire parameter range and then apply systematic mixing. This approach, combined with a hybrid combinatorial array-filling technique with linear distribution, delivers excellent generation quality.
My engine can efficiently generate and verify 300 unique combinations per batch. Based on the above, to determine optimal values, only 10-20 Parts need to be manually scrolled through to find the appropriate value or range, eliminating the need for exhaustive testing of millions of parameter combinations.
For the Score statistic I applied all the same, generated a range of Weights, distributed them randomly for each type of statistic to avoid manual distribution.
Score ━ based on Trade, Profit, WinRate, Profit Factor, Drawdown, Sharpe & Sortino & Omega & Calmar Ratio.
⭕️ Notes
For attentive users, a little tricks :)
To save time, switch parts every 3 seconds without waiting for it to load. After 10-20 parts, stop and wait for loading. If the pause is correct, you can switch between the rest of the parts without loading, as they will be cached. This used to work without having to wait for a pause, but now it does slower. This will save a lot of time if you are going to do a deeper backtest.
Sometimes you'll get the error “The scripts take too long to execute.”
For a quick fix you just need to switch the TF or Ticker back and forth and most likely everything will load.
The error appears because of problems on the side of the site because the engine is very heavy. It can also appear if you set too long a period for testing in BackWin or use a heavy indicator for testing.
Manual Start - Allow you to Start you Result from any point. Which in turn can help you choose a good stop-stick for your real position.
* It took me half a year from idea to current realization. This seems to be one of the few ways to build something automatic in backtest format and in this particular Pine environment. There are already better projects in other languages, and they are created much easier and faster because there are no limitations except for personal PC. If you see solutions to improve this system I would be glad if you share the code. At the moment I am tired and will continue him not soon.
Also You can use my previosly big Backtest project with more manual settings(updated soon)

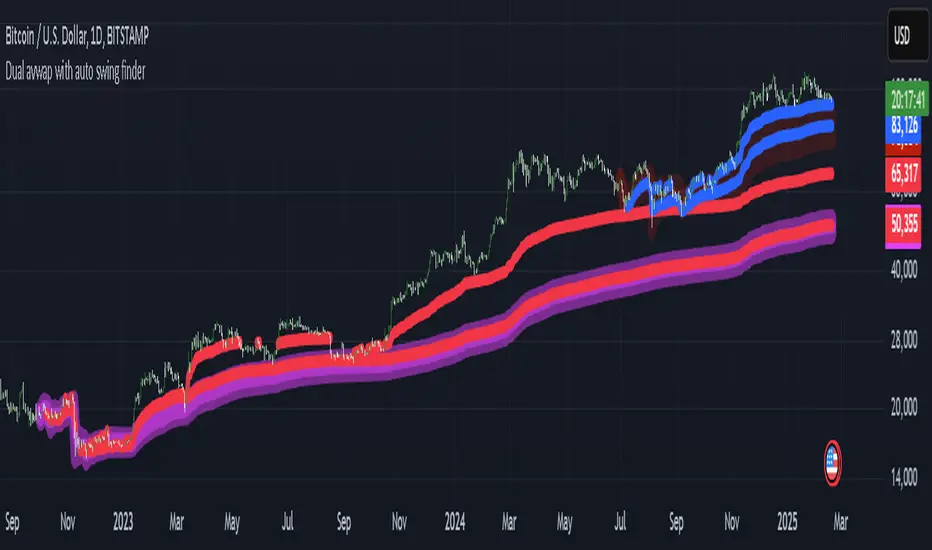
My auto dual avwap with Auto swing low/pivot low finderWelcome to My Auto Dual AVWAP with Auto Swing Low/Pivot Low Finder – an open-source TradingView indicator designed to enhance your technical analysis toolbox. This indicator is published under the Mozilla Public License 2.0 and is available for anyone to study, modify, and distribute.
Key Features
Auto Pivot/Swing Low Finder:
In addition to VWAP lines, the indicator incorporates an automatic detection mechanism for swing lows/pivot lows. This feature assists in identifying potential support areas and price reversals, further enhancing your trading strategy.
Dual VWAP Calculation with high/low range:
The indicator calculates two separate volume-weighted average price (VWAP) lines based on different price inputs (low and high prices) and defined time sessions. This allows traders to gain a more nuanced view of market activity during specific trading periods.
Customizable Time Sessions:
You can specify distinct start and end times for each VWAP calculation session. This flexibility helps you align the indicator with your preferred trading hours or market sessions, making it adaptable to various time zones and trading styles.
Easy to Customize:
With clear code structure and detailed comments, the script is designed to be accessible even for traders who want to customize or extend its functionality. Whether you're a seasoned coder or just starting out, the code is written with transparency in mind.
How It Works
Session Initialization:
The script sets up two distinct time sessions using user-defined start and end times. For each session, it detects the beginning of the trading period to reset cumulative values.
Cumulative Calculations:
During each session, the indicator accumulates the product of price and volume as well as the total volume. The VWAP is then computed as the ratio of these cumulative values.
Dual Data Sources:
Two separate data inputs (using low and high prices) are used to calculate two VWAP lines. This dual approach provides a broader perspective on market trends and can help in identifying dynamic support and resistance levels.
Visualization:
The calculated VWAP lines are plotted directly on your chart with distinct colors and thickness settings for easy visualization. This makes it simple to interpret the data at a glance.
Why Use This Indicator?
Whether you are a day trader, swing trader, or simply looking to refine your market analysis, My Auto Dual AVWAP with Auto Swing Low/Pivot Low Finder offers a robust set of features that can help you identify key price levels and improve your decision-making process. Its open-source nature invites collaboration and customization, ensuring that you can tailor it to fit your unique trading style.
Feel free to explore, modify, and share this indicator. Happy trading!
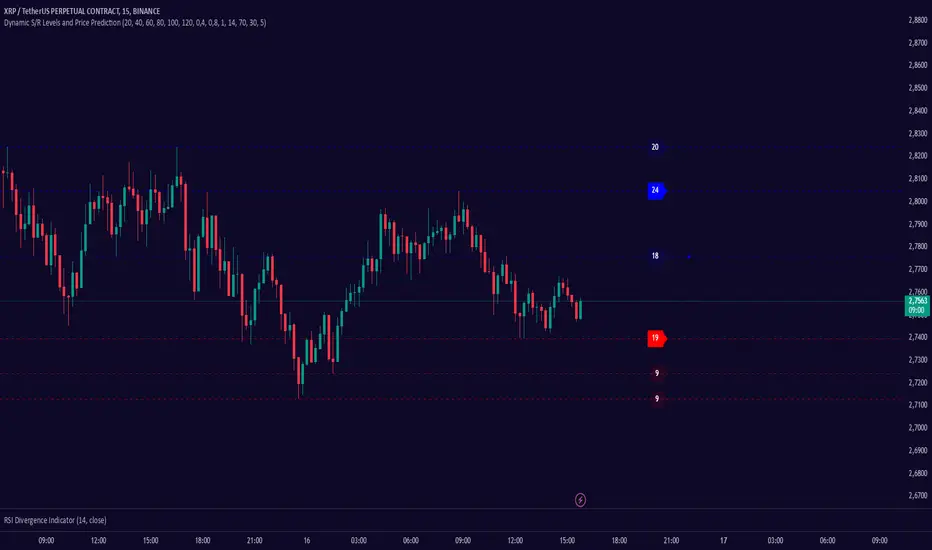
Dynamic S/R Levels: Edge FinderOverview
The Dynamic S/R Levels: Edge Finder indicator is designed to identify dynamic support and resistance levels based on historical price action. It uses a combination of price extremes (highs and lows) over user-defined lookback periods, weighted moving averages (WMAs), and touch-count analysis to provide actionable insights into key market levels.
This tool is ideal for traders who want to:
Identify dynamic support and resistance zones.
Understand the strength of these levels based on price touches.
Make informed decisions using clear, adaptive levels.
How It Works
Dynamic Levels Calculation:
The indicator calculates dynamic support levels using the lowest lows and dynamic resistance levels using the highest highs over user-defined lookback periods (e.g., 20, 40, 60 bars, etc.).
These levels are updated dynamically as new price data becomes available.
Touch Count Analysis:
The indicator counts how many times the price has touched or come close to each support/resistance level within the lookback period.
Levels with more touches are considered stronger and are highlighted accordingly.
Weighted Moving Averages (WMAs):
The indicator uses 50-period and 100-period WMAs to identify the closest support/resistance levels to the current trend.
Levels near these WMAs are given additional weight, as they are more likely to act as significant barriers.
Level Merging:
If two support or resistance levels are too close to each other (based on the minimum distance percentage), the weaker level (with fewer touches) is removed to avoid clutter.
Visualization:
Support levels are displayed as dashed red lines, and resistance levels are displayed as dashed blue lines.
Each level is labeled with its corresponding touch count, allowing traders to quickly assess its strength.
How to Interpret the Indicator
Strong Support/Resistance Levels:
Levels with higher touch counts (e.g., 5, 10, or more) are considered stronger and are more likely to hold in the future.
Use these levels to plan entries, exits, or stop-loss placements.
Proximity to WMAs:
Levels closest to the 50-period or 100-period WMA are more significant, especially in trending markets.
These levels often act as dynamic barriers where price reactions are more likely.
Breakouts and Rejections:
If the price breaks through a strong resistance level, it may indicate a potential bullish trend.
If the price rejects a strong support level, it may indicate a potential bearish trend.
Always confirm breakouts or rejections with additional analysis (e.g., volume, candlestick patterns).
Level Merging:
Merged levels indicate areas of high confluence, where multiple support/resistance zones overlap.
These areas are particularly important for decision-making, as they represent stronger market reactions.
Key Features
Customizable Lookback Periods: Adjust the lookback periods for each dynamic level to suit your trading style.
Touch Count Labels: Quickly identify the strength of each level based on the number of price touches.
Adaptive Levels: The indicator dynamically updates levels based on recent price action.
Clean Visualization: Levels are automatically merged to avoid clutter and provide a clear view of the market structure.
Usage Tips
Trend Identification: Combine the indicator with trend-following tools (e.g., moving averages, trendlines) to confirm the overall market direction.
Risk Management: Use the identified levels to set stop-loss orders or take-profit targets.
Timeframe Flexibility: The indicator works on all timeframes, but it is particularly effective on higher timeframes (e.g., 1H, 4H, Daily) for more reliable levels.
Example Scenarios
Bounce Trade:
If the price approaches a strong support level (high touch count) and shows signs of rejection (e.g., bullish candlestick patterns), consider a long position with a stop-loss below the support level.
Breakout Trade:
If the price breaks above a strong resistance level with high volume, consider a long position with a target at the next resistance level.
Range-Bound Market:
In a sideways market, use the support and resistance levels to identify range boundaries and trade bounces between them.
Disclaimer
Dynamic S/R Levels: Edge Finder is a technical analysis tool designed to identify dynamic support and resistance levels based on historical price action. It is intended for informational and educational purposes only. This indicator does not provide financial, investment, or trading advice. Users are solely responsible for their trading decisions and should conduct their own research and analysis before making any trades. The developer of this tool is not liable for any financial losses or damages resulting from the use of this indicator. Trading in financial markets involves risk, and you should only trade with capital you can afford to lose.
Nen Star Harmonic Pattern [TradingFinder] NenStar Reversal Auto🔵 Introduction
The Nen-Star Harmonic Pattern is an advanced reversal pattern in technical analysis, designed to identify market trend changes and predict key price reversal points. This pattern is defined by a combination of Fibonacci ratios and critical concepts such as Potential Reversal Zones (PRZ), market structure, and corrective waves.
The key points of this pattern include X, A, B, C, and D, and it appears in both bullish and bearish forms. In its bullish form, the pattern resembles the letter M, while in its bearish form, it takes the shape of W. The critical Fibonacci ratios for this pattern are 0.382 to 0.786 for the XA wave, 1.13 to 1.414 for the AB wave, and 1.272 to 2.618 for the BC wave.
The Nen-Star Harmonic Pattern is one of the most precise tools for identifying market reversals and executing reversal trades. Traders can use it to pinpoint optimal entry and exit points and benefit from high risk-to-reward ratios.
By emphasizing Fibonacci retracement levels, XABCD waves, the formation of bullish and bearish patterns, and precise trade entry points, this pattern has become a practical tool in advanced technical analysis.
Bullish Nen-Star Pattern :
Bearish Nen-Star Pattern :
🔵 How to Use
The Nen-Star Harmonic Pattern indicator allows traders to automatically identify the bullish and bearish structures of this pattern and locate optimal entry and exit points. By accurately analyzing Fibonacci ratios and determining points X, A, B, C, and D, the indicator highlights Potential Reversal Zones (PRZ) on the chart. Traders can rely on the generated signals to manage their trades with greater precision.
🟣 Bullish Nen-Star Pattern
The bullish Nen-Star pattern begins with a price increase from point X to point A, followed by a retracement to point B, which lies between 0.382 and 0.786 of the XA wave.
After this retracement, the price moves to point C, located between 1.13 and 1.414 of the AB wave. The final movement is a price decline to point D, which is between 1.272 and 2.618 of the BC wave and 1.13 to 1.272 of the XA wave.
Point D : Serves as the key Potential Reversal Zone (PRZ).
Entry : A buy trade is initiated at point D, signaling the end of the corrective movement and the beginning of a price increase.
Price Targets :
61.8% retracement of the CD wave
Point A
Point C
1.272 and 1.618 extensions of the CD wave if resistance at point C is broken
Stop Loss : Placed slightly below point D.
🟣 Bearish Nen-Star Pattern
The bearish Nen-Star pattern starts with a price decrease from point X to point A, followed by a retracement to point B, which lies between 0.382 and 0.786 of the XA wave.
After this retracement, the price moves to point C, located between 1.13 and 1.414 of the AB wave. The final movement is a price increase to point D, which is between 1.272 and 2.618 of the BC wave and 1.13 to 1.272 of the XA wave.
Point D : Serves as the key Potential Reversal Zone (PRZ).
Entry : A sell trade is initiated at point D, signaling the end of the corrective movement and the beginning of a price decline.
Price Targets :
61.8% retracement of the CD wave
Point A
Point C
1.272 and 1.618 extensions of the CD wave if support at point C is broken
Stop Loss : Placed slightly above point D.
🔵 Setting
🟣 Logical Setting
ZigZag Pivot Period : You can adjust the period so that the harmonic patterns are adjusted according to the pivot period you want. This factor is the most important parameter in pattern recognition.
Show Valid Forma t: If this parameter is on "On" mode, only patterns will be displayed that they have exact format and no noise can be seen in them. If "Off" is, the patterns displayed that maybe are noisy and do not exactly correspond to the original pattern.
Show Formation Last Pivot Confirm : if Turned on, you can see this ability of patterns when their last pivot is formed. If this feature is off, it will see the patterns as soon as they are formed. The advantage of this option being clear is less formation of fielded patterns, and it is accompanied by the latest pattern seeing and a sharp reduction in reward to risk.
Period of Formation Last Pivot : Using this parameter you can determine that the last pivot is based on Pivot period.
🟣 Genaral Setting
Show : Enter "On" to display the template and "Off" to not display the template.
Color : Enter the desired color to draw the pattern in this parameter.
LineWidth : You can enter the number 1 or numbers higher than one to adjust the thickness of the drawing lines. This number must be an integer and increases with increasing thickness.
LabelSize : You can adjust the size of the labels by using the "size.auto", "size.tiny", "size.smal", "size.normal", "size.large" or "size.huge" entries.
🟣 Alert Setting
Alert : On / Off
Message Frequency : This string parameter defines the announcement frequency. Choices include: "All" (activates the alert every time the function is called), "Once Per Bar" (activates the alert only on the first call within the bar), and "Once Per Bar Close" (the alert is activated only by a call at the last script execution of the real-time bar upon closing). The default setting is "Once per Bar".
Show Alert Time by Time Zone : The date, hour, and minute you receive in alert messages can be based on any time zone you choose. For example, if you want New York time, you should enter "UTC-4". This input is set to the time zone "UTC" by default.
🔵 Conclusion
The Nen-Star Harmonic Pattern is a highly effective analytical tool in global financial markets, playing a crucial role in identifying reversal points and market trend changes. By leveraging Fibonacci principles and price structure, this pattern enables precise analysis across various assets, including stocks, cryptocurrencies, forex, and commodities.
Traders operating in global markets can use this pattern to identify high risk-to-reward trading opportunities. Its clear entry and exit points, defined Potential Reversal Zones (PRZ), and accurate price targets make it an excellent tool for risk management and profitability enhancement.
In the global context, the Nen-Star pattern is widely used by professional analysts in both advanced and emerging markets due to its versatility in analyzing long-term and short-term charts. Beyond trend prediction, it enhances trading strategies and optimizes investment decisions.
Combining this pattern with complementary tools such as volume analysis, technical indicators, and macroeconomic conditions can provide traders with deeper market insights, helping them capitalize on global opportunities.

PineConnectorLibrary "PineConnector"
This library is a comprehensive alert webhook text generator for PineConnector. It contains every possible alert syntax variation from the documentation, along with some debugging functions.
To use it, just import the library (eg. "import ZenAndTheArtOfTrading/PineConnector/1 as pc") and use pc.buy(licenseID) to send an alert off to PineConnector - assuming all your webhooks etc are set up correctly.
View the PineConnector documentation for more information on how to send the commands you're looking to send (all of this library's function names match the documentation).
all()
Usage: pc.buy(pc_id, freq=pc.all())
Returns: "all"
once_per_bar()
Usage: pc.buy(pc_id, freq=pc.once_per_bar())
Returns: "once_per_bar"
once_per_bar_close()
Usage: pc.buy(pc_id, freq=pc.once_per_bar_close())
Returns: "once_per_bar_close"
na0(value)
Checks if given value is either 'na' or 0. Useful for streamlining scripts with float user setting inputs which default values to 0 since na is unavailable as a user input default.
Parameters:
value (float) : The value to check
Returns: True if the given value is 0 or na
getDecimals()
Calculates how many decimals are on the quote price of the current market.
Returns: The current decimal places on the market quote price
truncate(number, decimals)
Truncates the given number. Required params: mumber.
Parameters:
number (float) : Number to truncate
decimals (int) : Decimal places to cut down to
Returns: The input number, but as a string truncated to X decimals
getPipSize(multiplier)
Calculates the pip size of the current market.
Parameters:
multiplier (int) : The mintick point multiplier (1 by default, 10 for FX/Crypto/CFD but can be used to override when certain markets require)
Returns: The pip size for the current market
toWhole(number)
Converts pips into whole numbers. Required params: number.
Parameters:
number (float) : The pip number to convert into a whole number
Returns: The converted number
toPips(number)
Converts whole numbers back into pips. Required params: number.
Parameters:
number (float) : The whole number to convert into pips
Returns: The converted number
debug(txt, tooltip, displayLabel)
Prints to console and generates a debug label with the given text. Required params: txt.
Parameters:
txt (string) : Text to display
tooltip (string) : Tooltip to display (optional)
displayLabel (bool) : Turns on/off chart label (default: off)
Returns: Nothing
order(licenseID, command, symbol, parameters, accfilter, comment, secret, freq, debug)
Generates an alert string. Required params: licenseID, command.
Parameters:
licenseID (string) : Your PC license ID
command (string) : Command to send
symbol (string) : The symbol to trigger this order on
parameters (string) : Other optional parameters to include
accfilter (float) : Optional minimum account balance filter
comment (string) : Optional comment (maximum 20 characters)
secret (string) : Optional secret key (must be enabled in dashboard)
freq (string) : Alert frequency. Default = "all", options = "once_per_bar", "once_per_bar_close" and "none"
debug (bool) : Turns on/off debug label
Returns: An alert string with valid PC syntax based on supplied parameters
market_order(licenseID, buy, risk, sl, tp, betrigger, beoffset, spread, trailtrig, traildist, trailstep, atrtimeframe, atrperiod, atrmultiplier, atrshift, atrtrigger, symbol, accfilter, comment, secret, freq, debug)
Generates a market entry alert with relevant syntax commands. Required params: licenseID, buy, risk.
Parameters:
licenseID (string) : Your PC license ID
buy (bool) : true=buy/long, false=sell/short
risk (float) : Risk quantity (according to EA settings)
sl (float) : Stop loss distance in pips or price
tp (float) : Take profit distance in pips or price
betrigger (float) : Breakeven will be activated after the position gains this number of pips
beoffset (float) : Offset from entry price. This is the amount of pips you'd like to protect
spread (float) : Enter the position only if the spread is equal or less than the specified value in pips
trailtrig (float) : Trailing stop-loss will be activated after a trade gains this number of pips
traildist (float) : Distance of the trailing stop-loss from current price
trailstep (float) : Moves trailing stop-loss once price moves to favourable by a specified number of pips
atrtimeframe (int) : ATR Trailing Stop timeframe, only updates once per bar close. Options: 1, 5, 15, 30, 60, 240, 1440
atrperiod (int) : ATR averaging period
atrmultiplier (float) : Multiple of ATR to utilise in the new SL computation, default = 1
atrshift (int) : Relative shift of price information, 0 uses latest candle, 1 uses second last, etc. Default = 0
atrtrigger (int) : Activate the trigger of ATR Trailing after market moves favourably by a number of pips. Default = 0 (instant)
symbol (string) : The symbol to trigger this order on (defaults to current symbol)
accfilter (float) : Optional minimum account balance filter
comment (string) : Optional comment (maximum 20 characters)
secret (string) : Optional secret key (must be enabled in dashboard)
freq (string) : Alert frequency. Default = "all", options = "once_per_bar", "once_per_bar_close" and "none"
debug (bool) : Turns on/off debug label
Returns: A market order alert string with valid PC syntax based on supplied parameters
buy(licenseID, risk, sl, tp, betrigger, beoffset, spread, trailtrig, traildist, trailstep, atrtimeframe, atrperiod, atrmultiplier, atrshift, atrtrigger, symbol, accfilter, comment, secret, freq, debug)
Generates a market buy alert with relevant syntax commands. Required params: licenseID, risk.
Parameters:
licenseID (string) : Your PC license ID
risk (float) : Risk quantity (according to EA settings)
sl (float) : Stop loss distance in pips or price
tp (float) : Take profit distance in pips or price
betrigger (float) : Breakeven will be activated after the position gains this number of pips
beoffset (float) : Offset from entry price. This is the amount of pips you'd like to protect
spread (float) : Enter the position only if the spread is equal or less than the specified value in pips
trailtrig (float) : Trailing stop-loss will be activated after a trade gains this number of pips
traildist (float) : Distance of the trailing stop-loss from current price
trailstep (float) : Moves trailing stop-loss once price moves to favourable by a specified number of pips
atrtimeframe (int) : ATR Trailing Stop timeframe, only updates once per bar close. Options: 1, 5, 15, 30, 60, 240, 1440
atrperiod (int) : ATR averaging period
atrmultiplier (float) : Multiple of ATR to utilise in the new SL computation, default = 1
atrshift (int) : Relative shift of price information, 0 uses latest candle, 1 uses second last, etc. Default = 0
atrtrigger (int) : Activate the trigger of ATR Trailing after market moves favourably by a number of pips. Default = 0 (instant)
symbol (string) : The symbol to trigger this order on (defaults to current symbol)
accfilter (float) : Optional minimum account balance filter
comment (string) : Optional comment (maximum 20 characters)
secret (string) : Optional secret key (must be enabled in dashboard)
freq (string) : Alert frequency. Default = "all", options = "once_per_bar", "once_per_bar_close" and "none"
debug (bool) : Turns on/off debug label
Returns: A market order alert string with valid PC syntax based on supplied parameters
sell(licenseID, risk, sl, tp, betrigger, beoffset, spread, trailtrig, traildist, trailstep, atrtimeframe, atrperiod, atrmultiplier, atrshift, atrtrigger, symbol, accfilter, comment, secret, freq, debug)
Generates a market sell alert with relevant syntax commands. Required params: licenseID, risk.
Parameters:
licenseID (string) : Your PC license ID
risk (float) : Risk quantity (according to EA settings)
sl (float) : Stop loss distance in pips or price
tp (float) : Take profit distance in pips or price
betrigger (float) : Breakeven will be activated after the position gains this number of pips
beoffset (float) : Offset from entry price. This is the amount of pips you'd like to protect
spread (float) : Enter the position only if the spread is equal or less than the specified value in pips
trailtrig (float) : Trailing stop-loss will be activated after a trade gains this number of pips
traildist (float) : Distance of the trailing stop-loss from current price
trailstep (float) : Moves trailing stop-loss once price moves to favourable by a specified number of pips
atrtimeframe (int) : ATR Trailing Stop timeframe, only updates once per bar close. Options: 1, 5, 15, 30, 60, 240, 1440
atrperiod (int) : ATR averaging period
atrmultiplier (float) : Multiple of ATR to utilise in the new SL computation, default = 1
atrshift (int) : Relative shift of price information, 0 uses latest candle, 1 uses second last, etc. Default = 0
atrtrigger (int) : Activate the trigger of ATR Trailing after market moves favourably by a number of pips. Default = 0 (instant)
symbol (string) : The symbol to trigger this order on (defaults to current symbol)
accfilter (float) : Optional minimum account balance filter
comment (string) : Optional comment (maximum 20 characters)
secret (string) : Optional secret key (must be enabled in dashboard)
freq (string) : Alert frequency. Default = "all", options = "once_per_bar", "once_per_bar_close" and "none"
debug (bool) : Turns on/off debug label
Returns: A market order alert string with valid PC syntax based on supplied parameters
closeall(licenseID, comment, secret, freq, debug)
Closes all open trades at market regardless of symbol. Required params: licenseID.
Parameters:
licenseID (string) : Your PC license ID
comment (string) : Optional comment to include (max 20 characters)
secret (string) : Optional secret key (must be enabled in dashboard)
freq (string) : Alert frequency. Default = "all", options = "once_per_bar", "once_per_bar_close" and "none"
debug (bool) : Turns on/off debug label
Returns: The required alert syntax as a string
closealleaoff(licenseID, comment, secret, freq, debug)
Closes all open trades at market regardless of symbol, and turns the EA off. Required params: licenseID.
Parameters:
licenseID (string) : Your PC license ID
comment (string) : Optional comment to include (max 20 characters)
secret (string) : Optional secret key (must be enabled in dashboard)
freq (string) : Alert frequency. Default = "all", options = "once_per_bar", "once_per_bar_close" and "none"
debug (bool) : Turns on/off debug label
Returns: The required alert syntax as a string
closelong(licenseID, symbol, comment, secret, freq, debug)
Closes all long trades at market for the given symbol. Required params: licenseID.
Parameters:
licenseID (string) : Your PC license ID
symbol (string) : Symbol to act on (defaults to current symbol)
comment (string) : Optional comment to include (max 20 characters)
secret (string) : Optional secret key (must be enabled in dashboard)
freq (string) : Alert frequency. Default = "all", options = "once_per_bar", "once_per_bar_close" and "none"
debug (bool) : Turns on/off debug label
Returns: The required alert syntax as a string
closeshort(licenseID, symbol, comment, secret, freq, debug)
Closes all open short trades at market for the given symbol. Required params: licenseID.
Parameters:
licenseID (string) : Your PC license ID
symbol (string) : Symbol to act on (defaults to current symbol)
comment (string) : Optional comment to include (max 20 characters)
secret (string) : Optional secret key (must be enabled in dashboard)
freq (string) : Alert frequency. Default = "all", options = "once_per_bar", "once_per_bar_close" and "none"
debug (bool) : Turns on/off debug label
Returns: The required alert syntax as a string
closelongshort(licenseID, symbol, comment, secret, freq, debug)
Closes all open trades at market for the given symbol. Required params: licenseID.
Parameters:
licenseID (string) : Your PC license ID
symbol (string) : Symbol to act on (defaults to current symbol)
comment (string) : Optional comment to include (max 20 characters)
secret (string) : Optional secret key (must be enabled in dashboard)
freq (string) : Alert frequency. Default = "all", options = "once_per_bar", "once_per_bar_close" and "none"
debug (bool) : Turns on/off debug label
Returns: The required alert syntax as a string
closelongbuy(licenseID, risk, symbol, comment, secret, freq, debug)
Close all long positions and open a new long at market for the given symbol with given risk/contracts. Required params: licenseID.
Parameters:
licenseID (string) : Your PC license ID
risk (float) : Risk or contracts (according to EA settings)
symbol (string) : Symbol to act on (defaults to current symbol)
comment (string) : Optional comment to include (max 20 characters)
secret (string) : Optional secret key (must be enabled in dashboard)
freq (string) : Alert frequency. Default = "all", options = "once_per_bar", "once_per_bar_close" and "none"
debug (bool) : Turns on/off debug label
Returns: The required alert syntax as a string
closeshortsell(licenseID, risk, symbol, comment, secret, freq, debug)
Close all short positions and open a new short at market for the given symbol with given risk/contracts. Required params: licenseID, risk.
Parameters:
licenseID (string) : Your PC license ID
risk (float) : Risk or contracts (according to EA settings)
symbol (string) : Symbol to act on (defaults to current symbol)
comment (string) : Optional comment to include (max 20 characters)
secret (string) : Optional secret key (must be enabled in dashboard)
freq (string) : Alert frequency. Default = "all", options = "once_per_bar", "once_per_bar_close" and "none"
debug (bool) : Turns on/off debug label
Returns: The required alert syntax as a string
newsltplong(licenseID, sl, tp, symbol, accfilter, comment, secret, freq, debug)
Updates the stop loss and/or take profit of any open long trades on the given symbol with the given values. Required params: licenseID, sl and/or tp.
Parameters:
licenseID (string) : Your PC license ID
sl (float) : Stop loss pips or price (according to EA settings)
tp (float) : Take profit pips or price (according to EA settings)
symbol (string) : Symbol to act on (defaults to current symbol)
accfilter (float) : Optional minimum account balance filter
comment (string) : Optional comment to include (max 20 characters)
secret (string) : Optional secret key (must be enabled in dashboard)
freq (string) : Alert frequency. Default = "all", options = "once_per_bar", "once_per_bar_close" and "none"
debug (bool) : Turns on/off debug label
Returns: The required alert syntax as a string
newsltpshort(licenseID, sl, tp, symbol, accfilter, comment, secret, freq, debug)
Updates the stop loss and/or take profit of any open short trades on the given symbol with the given values. Required params: licenseID, sl and/or tp.
Parameters:
licenseID (string) : Your PC license ID
sl (float) : Stop loss pips or price (according to EA settings)
tp (float) : Take profit pips or price (according to EA settings)
symbol (string) : Symbol to act on (defaults to current symbol)
accfilter (float) : Optional minimum account balance filter
comment (string) : Optional comment to include (max 20 characters)
secret (string) : Optional secret key (must be enabled in dashboard)
freq (string) : Alert frequency. Default = "all", options = "once_per_bar", "once_per_bar_close" and "none"
debug (bool) : Turns on/off debug label
Returns: The required alert syntax as a string
closelongpct(licenseID, symbol, comment, secret, freq, debug)
Close a percentage of open long positions (according to EA settings). Required params: licenseID.
Parameters:
licenseID (string) : Your PC license ID
symbol (string) : Symbol to act on (defaults to current symbol)
comment (string) : Optional comment to include (max 20 characters)
secret (string) : Optional secret key (must be enabled in dashboard)
freq (string) : Alert frequency. Default = "all", options = "once_per_bar", "once_per_bar_close" and "none"
debug (bool) : Turns on/off debug label
Returns: The required alert syntax as a string
closeshortpct(licenseID, symbol, comment, secret, freq, debug)
Close a percentage of open short positions (according to EA settings). Required params: licenseID.
Parameters:
licenseID (string) : Your PC license ID
symbol (string) : Symbol to act on (defaults to current symbol)
comment (string) : Optional comment to include (max 20 characters)
secret (string) : Optional secret key (must be enabled in dashboard)
freq (string) : Alert frequency. Default = "all", options = "once_per_bar", "once_per_bar_close" and "none"
debug (bool) : Turns on/off debug label
Returns: The required alert syntax as a string
closelongvol(licenseID, risk, symbol, comment, secret, freq, debug)
Close all open long contracts on the current symbol until the given risk value is remaining. Required params: licenseID, risk.
Parameters:
licenseID (string) : Your PC license ID
risk (float) : The quantity to leave remaining
symbol (string) : Symbol to act on (defaults to current symbol)
comment (string) : Optional comment to include (max 20 characters)
secret (string) : Optional secret key (must be enabled in dashboard)
freq (string) : Alert frequency. Default = "all", options = "once_per_bar", "once_per_bar_close" and "none"
debug (bool) : Turns on/off debug label
Returns: The required alert syntax as a string
closeshortvol(licenseID, risk, symbol, comment, secret, freq, debug)
Close all open short contracts on the current symbol until the given risk value is remaining. Required params: licenseID, risk.
Parameters:
licenseID (string) : Your PC license ID
risk (float) : The quantity to leave remaining
symbol (string) : Symbol to act on (defaults to current symbol)
comment (string) : Optional comment to include (max 20 characters)
secret (string) : Optional secret key (must be enabled in dashboard)
freq (string) : Alert frequency. Default = "all", options = "once_per_bar", "once_per_bar_close" and "none"
debug (bool) : Turns on/off debug label
Returns: The required alert syntax as a string
limit_order(licenseID, buy, price, risk, sl, tp, betrigger, beoffset, spread, trailtrig, traildist, trailstep, atrtimeframe, atrperiod, atrmultiplier, atrshift, atrtrigger, symbol, accfilter, comment, secret, freq, debug)
Generates a limit order alert with relevant syntax commands. Required params: licenseID, buy, price, risk.
Parameters:
licenseID (string) : Your PC license ID
buy (bool) : true=buy/long, false=sell/short
price (float) : Price or pips to set limit order (according to EA settings)
risk (float) : Risk quantity (according to EA settings)
sl (float) : Stop loss distance in pips or price
tp (float) : Take profit distance in pips or price
betrigger (float) : Breakeven will be activated after the position gains this number of pips
beoffset (float) : Offset from entry price. This is the amount of pips you'd like to protect
spread (float) : Enter the position only if the spread is equal or less than the specified value in pips
trailtrig (float) : Trailing stop-loss will be activated after a trade gains this number of pips
traildist (float) : Distance of the trailing stop-loss from current price
trailstep (float) : Moves trailing stop-loss once price moves to favourable by a specified number of pips
atrtimeframe (int) : ATR Trailing Stop timeframe, only updates once per bar close. Options: 1, 5, 15, 30, 60, 240, 1440
atrperiod (int) : ATR averaging period
atrmultiplier (float) : Multiple of ATR to utilise in the new SL computation, default = 1
atrshift (int) : Relative shift of price information, 0 uses latest candle, 1 uses second last, etc. Default = 0
atrtrigger (int) : Activate the trigger of ATR Trailing after market moves favourably by a number of pips. Default = 0 (instant)
symbol (string) : The symbol to trigger this order on (defaults to current symbol)
accfilter (float) : Optional minimum account balance filter
comment (string) : Optional comment (maximum 20 characters)
secret (string) : Optional secret key (must be enabled in dashboard)
freq (string) : Alert frequency. Default = "all", options = "once_per_bar", "once_per_bar_close" and "none"
debug (bool) : Turns on/off debug label
Returns: A limit order alert string with valid PC syntax based on supplied parameters
buylimit(licenseID, price, risk, sl, tp, betrigger, beoffset, spread, trailtrig, traildist, trailstep, atrtimeframe, atrperiod, atrmultiplier, atrshift, atrtrigger, symbol, accfilter, comment, secret, freq, debug)
Generates a buylimit order alert with relevant syntax commands. Required params: licenseID, price, risk.
Parameters:
licenseID (string) : Your PC license ID
price (float) : Price or pips to set limit order (according to EA settings)
risk (float) : Risk quantity (according to EA settings)
sl (float) : Stop loss distance in pips or price
tp (float) : Take profit distance in pips or price
betrigger (float) : Breakeven will be activated after the position gains this number of pips
beoffset (float) : Offset from entry price. This is the amount of pips you'd like to protect
spread (float) : Enter the position only if the spread is equal or less than the specified value in pips
trailtrig (float) : Trailing stop-loss will be activated after a trade gains this number of pips
traildist (float) : Distance of the trailing stop-loss from current price
trailstep (float) : Moves trailing stop-loss once price moves to favourable by a specified number of pips
atrtimeframe (int) : ATR Trailing Stop timeframe, only updates once per bar close. Options: 1, 5, 15, 30, 60, 240, 1440
atrperiod (int) : ATR averaging period
atrmultiplier (float) : Multiple of ATR to utilise in the new SL computation, default = 1
atrshift (int) : Relative shift of price information, 0 uses latest candle, 1 uses second last, etc. Default = 0
atrtrigger (int) : Activate the trigger of ATR Trailing after market moves favourably by a number of pips. Default = 0 (instant)
symbol (string) : The symbol to trigger this order on (defaults to current symbol)
accfilter (float) : Optional minimum account balance filter
comment (string) : Optional comment (maximum 20 characters)
secret (string) : Optional secret key (must be enabled in dashboard)
freq (string) : Alert frequency. Default = "all", options = "once_per_bar", "once_per_bar_close" and "none"
debug (bool) : Turns on/off debug label
Returns: A limit order alert string with valid PC syntax based on supplied parameters
selllimit(licenseID, price, risk, sl, tp, betrigger, beoffset, spread, trailtrig, traildist, trailstep, atrtimeframe, atrperiod, atrmultiplier, atrshift, atrtrigger, symbol, accfilter, comment, secret, freq, debug)
Generates a selllimit order alert with relevant syntax commands. Required params: licenseID, price, risk.
Parameters:
licenseID (string) : Your PC license ID
price (float) : Price or pips to set limit order (according to EA settings)
risk (float) : Risk quantity (according to EA settings)
sl (float) : Stop loss distance in pips or price
tp (float) : Take profit distance in pips or price
betrigger (float) : Breakeven will be activated after the position gains this number of pips
beoffset (float) : Offset from entry price. This is the amount of pips you'd like to protect
spread (float) : Enter the position only if the spread is equal or less than the specified value in pips
trailtrig (float) : Trailing stop-loss will be activated after a trade gains this number of pips
traildist (float) : Distance of the trailing stop-loss from current price
trailstep (float) : Moves trailing stop-loss once price moves to favourable by a specified number of pips
atrtimeframe (int) : ATR Trailing Stop timeframe, only updates once per bar close. Options: 1, 5, 15, 30, 60, 240, 1440
atrperiod (int) : ATR averaging period
atrmultiplier (float) : Multiple of ATR to utilise in the new SL computation, default = 1
atrshift (int) : Relative shift of price information, 0 uses latest candle, 1 uses second last, etc. Default = 0
atrtrigger (int) : Activate the trigger of ATR Trailing after market moves favourably by a number of pips. Default = 0 (instant)
symbol (string) : The symbol to trigger this order on (defaults to current symbol)
accfilter (float) : Optional minimum account balance filter
comment (string) : Optional comment (maximum 20 characters)
secret (string) : Optional secret key (must be enabled in dashboard)
freq (string) : Alert frequency. Default = "all", options = "once_per_bar", "once_per_bar_close" and "none"
debug (bool) : Turns on/off debug label
Returns: A limit order alert string with valid PC syntax based on supplied parameters
stop_order(licenseID, buy, price, risk, sl, tp, betrigger, beoffset, spread, trailtrig, traildist, trailstep, atrtimeframe, atrperiod, atrmultiplier, atrshift, atrtrigger, symbol, accfilter, comment, secret, freq, debug)
Generates a stop order alert with relevant syntax commands. Required params: licenseID, buy, price, risk.
Parameters:
licenseID (string) : Your PC license ID
buy (bool) : true=buy/long, false=sell/short
price (float) : Price or pips to set limit order (according to EA settings)
risk (float) : Risk quantity (according to EA settings)
sl (float) : Stop loss distance in pips or price
tp (float) : Take profit distance in pips or price
betrigger (float) : Breakeven will be activated after the position gains this number of pips
beoffset (float) : Offset from entry price. This is the amount of pips you'd like to protect
spread (float) : Enter the position only if the spread is equal or less than the specified value in pips
trailtrig (float) : Trailing stop-loss will be activated after a trade gains this number of pips
traildist (float) : Distance of the trailing stop-loss from current price
trailstep (float) : Moves trailing stop-loss once price moves to favourable by a specified number of pips
atrtimeframe (int) : ATR Trailing Stop timeframe, only updates once per bar close. Options: 1, 5, 15, 30, 60, 240, 1440
atrperiod (int) : ATR averaging period
atrmultiplier (float) : Multiple of ATR to utilise in the new SL computation, default = 1
atrshift (int) : Relative shift of price information, 0 uses latest candle, 1 uses second last, etc. Default = 0
atrtrigger (int) : Activate the trigger of ATR Trailing after market moves favourably by a number of pips. Default = 0 (instant)
symbol (string) : The symbol to trigger this order on (defaults to current symbol)
accfilter (float) : Optional minimum account balance filter
comment (string) : Optional comment (maximum 20 characters)
secret (string) : Optional secret key (must be enabled in dashboard)
freq (string) : Alert frequency. Default = "all", options = "once_per_bar", "once_per_bar_close" and "none"
debug (bool) : Turns on/off debug label
Returns: A stop order alert string with valid PC syntax based on supplied parameters
buystop(licenseID, price, risk, sl, tp, betrigger, beoffset, spread, trailtrig, traildist, trailstep, atrtimeframe, atrperiod, atrmultiplier, atrshift, atrtrigger, symbol, accfilter, comment, secret, freq, debug)
Generates a buystop order alert with relevant syntax commands. Required params: licenseID, price, risk.
Parameters:
licenseID (string) : Your PC license ID
price (float) : Price or pips to set limit order (according to EA settings)
risk (float) : Risk quantity (according to EA settings)
sl (float) : Stop loss distance in pips or price
tp (float) : Take profit distance in pips or price
betrigger (float) : Breakeven will be activated after the position gains this number of pips
beoffset (float) : Offset from entry price. This is the amount of pips you'd like to protect
spread (float) : Enter the position only if the spread is equal or less than the specified value in pips
trailtrig (float) : Trailing stop-loss will be activated after a trade gains this number of pips
traildist (float) : Distance of the trailing stop-loss from current price
trailstep (float) : Moves trailing stop-loss once price moves to favourable by a specified number of pips
atrtimeframe (int) : ATR Trailing Stop timeframe, only updates once per bar close. Options: 1, 5, 15, 30, 60, 240, 1440
atrperiod (int) : ATR averaging period
atrmultiplier (float) : Multiple of ATR to utilise in the new SL computation, default = 1
atrshift (int) : Relative shift of price information, 0 uses latest candle, 1 uses second last, etc. Default = 0
atrtrigger (int) : Activate the trigger of ATR Trailing after market moves favourably by a number of pips. Default = 0 (instant)
symbol (string) : The symbol to trigger this order on (defaults to current symbol)
accfilter (float) : Optional minimum account balance filter
comment (string) : Optional comment (maximum 20 characters)
secret (string) : Optional secret key (must be enabled in dashboard)
freq (string) : Alert frequency. Default = "all", options = "once_per_bar", "once_per_bar_close" and "none"
debug (bool) : Turns on/off debug label
Returns: A stop order alert string with valid PC syntax based on supplied parameters
sellstop(licenseID, price, risk, sl, tp, betrigger, beoffset, spread, trailtrig, traildist, trailstep, atrtimeframe, atrperiod, atrmultiplier, atrshift, atrtrigger, symbol, accfilter, comment, secret, freq, debug)
Generates a sellstop order alert with relevant syntax commands. Required params: licenseID, price, risk.
Parameters:
licenseID (string) : Your PC license ID
price (float) : Price or pips to set limit order (according to EA settings)
risk (float) : Risk quantity (according to EA settings)
sl (float) : Stop loss distance in pips or price
tp (float) : Take profit distance in pips or price
betrigger (float) : Breakeven will be activated after the position gains this number of pips
beoffset (float) : Offset from entry price. This is the amount of pips you'd like to protect
spread (float) : Enter the position only if the spread is equal or less than the specified value in pips
trailtrig (float) : Trailing stop-loss will be activated after a trade gains this number of pips
traildist (float) : Distance of the trailing stop-loss from current price
trailstep (float) : Moves trailing stop-loss once price moves to favourable by a specified number of pips
atrtimeframe (int) : ATR Trailing Stop timeframe, only updates once per bar close. Options: 1, 5, 15, 30, 60, 240, 1440
atrperiod (int) : ATR averaging period
atrmultiplier (float) : Multiple of ATR to utilise in the new SL computation, default = 1
atrshift (int) : Relative shift of price information, 0 uses latest candle, 1 uses second last, etc. Default = 0
atrtrigger (int) : Activate the trigger of ATR Trailing after market moves favourably by a number of pips. Default = 0 (instant)
symbol (string) : The symbol to trigger this order on (defaults to current symbol)
accfilter (float) : Optional minimum account balance filter
comment (string) : Optional comment (maximum 20 characters)
secret (string) : Optional secret key (must be enabled in dashboard)
freq (string) : Alert frequency. Default = "all", options = "once_per_bar", "once_per_bar_close" and "none"
debug (bool) : Turns on/off debug label
Returns: A stop order alert string with valid PC syntax based on supplied parameters
cancel_neworder(licenseID, order, price, risk, sl, tp, betrigger, beoffset, spread, trailtrig, traildist, trailstep, atrtimeframe, atrperiod, atrmultiplier, atrshift, atrtrigger, symbol, accfilter, comment, secret, freq, debug)
Cancel + place new order template function.
Parameters:
licenseID (string) : Your PC license ID
order (string) : Cancel order type
price (float) : Price or pips to set limit order (according to EA settings)
risk (float) : Risk quantity (according to EA settings)
sl (float) : Stop loss distance in pips or price
tp (float) : Take profit distance in pips or price
betrigger (float) : Breakeven will be activated after the position gains this number of pips
beoffset (float) : Offset from entry price. This is the amount of pips you'd like to protect
spread (float) : Enter the position only if the spread is equal or less than the specified value in pips
trailtrig (float) : Trailing stop-loss will be activated after a trade gains this number of pips
traildist (float) : Distance of the trailing stop-loss from current price
trailstep (float) : Moves trailing stop-loss once price moves to favourable by a specified number of pips
atrtimeframe (int) : ATR Trailing Stop timeframe, only updates once per bar close. Options: 1, 5, 15, 30, 60, 240, 1440
atrperiod (int) : ATR averaging period
atrmultiplier (float) : Multiple of ATR to utilise in the new SL computation, default = 1
atrshift (int) : Relative shift of price information, 0 uses latest candle, 1 uses second last, etc. Default = 0
atrtrigger (int) : Activate the trigger of ATR Trailing after market moves favourably by a number of pips. Default = 0 (instant)
symbol (string) : The symbol to trigger this order on (defaults to current symbol)
accfilter (float) : Optional minimum account balance filter
comment (string) : Optional comment (maximum 20 characters)
secret (string) : Optional secret key (must be enabled in dashboard)
freq (string) : Alert frequency. Default = "all", options = "once_per_bar", "once_per_bar_close" and "none"
debug (bool) : Turns on/off debug label
Returns: A stop order alert string with valid PC syntax based on supplied parameters
cancellongbuystop(licenseID, price, risk, sl, tp, betrigger, beoffset, spread, trailtrig, traildist, trailstep, atrtimeframe, atrperiod, atrmultiplier, atrshift, atrtrigger, symbol, accfilter, comment, secret, freq, debug)
Cancels all long orders with the specified symbol and places a new buystop order. Required params: licenseID, price, risk.
Parameters:
licenseID (string) : Your PC license ID
price (float) : Price or pips to set limit order (according to EA settings)
risk (float) : Risk quantity (according to EA settings)
sl (float) : Stop loss distance in pips or price
tp (float) : Take profit distance in pips or price
betrigger (float) : Breakeven will be activated after the position gains this number of pips
beoffset (float) : Offset from entry price. This is the amount of pips you'd like to protect
spread (float) : Enter the position only if the spread is equal or less than the specified value in pips
trailtrig (float) : Trailing stop-loss will be activated after a trade gains this number of pips
traildist (float) : Distance of the trailing stop-loss from current price
trailstep (float) : Moves trailing stop-loss once price moves to favourable by a specified number of pips
atrtimeframe (int) : ATR Trailing Stop timeframe, only updates once per bar close. Options: 1, 5, 15, 30, 60, 240, 1440
atrperiod (int) : ATR averaging period
atrmultiplier (float) : Multiple of ATR to utilise in the new SL computation, default = 1
atrshift (int) : Relative shift of price information, 0 uses latest candle, 1 uses second last, etc. Default = 0
atrtrigger (int) : Activate the trigger of ATR Trailing after market moves favourably by a number of pips. Default = 0 (instant)
symbol (string) : The symbol to trigger this order on (defaults to current symbol)
accfilter (float) : Optional minimum account balance filter
comment (string) : Optional comment (maximum 20 characters)
secret (string) : Optional secret key (must be enabled in dashboard)
freq (string) : Alert frequency. Default = "all", options = "once_per_bar", "once_per_bar_close" and "none"
debug (bool) : Turns on/off debug label
Returns: A stop order alert string with valid PC syntax based on supplied parameters
cancellongbuylimit(licenseID, price, risk, sl, tp, betrigger, beoffset, spread, trailtrig, traildist, trailstep, atrtimeframe, atrperiod, atrmultiplier, atrshift, atrtrigger, symbol, accfilter, comment, secret, freq, debug)
Cancels all long orders with the specified symbol and places a new buylimit order. Required params: licenseID, price, risk.
Parameters:
licenseID (string) : Your PC license ID
price (float) : Price or pips to set limit order (according to EA settings)
risk (float) : Risk quantity (according to EA settings)
sl (float) : Stop loss distance in pips or price
tp (float) : Take profit distance in pips or price
betrigger (float) : Breakeven will be activated after the position gains this number of pips
beoffset (float) : Offset from entry price. This is the amount of pips you'd like to protect
spread (float) : Enter the position only if the spread is equal or less than the specified value in pips
trailtrig (float) : Trailing stop-loss will be activated after a trade gains this number of pips
traildist (float) : Distance of the trailing stop-loss from current price
trailstep (float) : Moves trailing stop-loss once price moves to favourable by a specified number of pips
atrtimeframe (int) : ATR Trailing Stop timeframe, only updates once per bar close. Options: 1, 5, 15, 30, 60, 240, 1440
atrperiod (int) : ATR averaging period
atrmultiplier (float) : Multiple of ATR to utilise in the new SL computation, default = 1
atrshift (int) : Relative shift of price information, 0 uses latest candle, 1 uses second last, etc. Default = 0
atrtrigger (int) : Activate the trigger of ATR Trailing after market moves favourably by a number of pips. Default = 0 (instant)
symbol (string) : The symbol to trigger this order on (defaults to current symbol)
accfilter (float) : Optional minimum account balance filter
comment (string) : Optional comment (maximum 20 characters)
secret (string) : Optional secret key (must be enabled in dashboard)
freq (string) : Alert frequency. Default = "all", options = "once_per_bar", "once_per_bar_close" and "none"
debug (bool) : Turns on/off debug label
Returns: A stop order alert string with valid PC syntax based on supplied parameters
cancelshortsellstop(licenseID, price, risk, sl, tp, betrigger, beoffset, spread, trailtrig, traildist, trailstep, atrtimeframe, atrperiod, atrmultiplier, atrshift, atrtrigger, symbol, accfilter, comment, secret, freq, debug)
Cancels all short orders with the specified symbol and places a sellstop order. Required params: licenseID, price, risk.
Parameters:
licenseID (string) : Your PC license ID
price (float) : Price or pips to set limit order (according to EA settings)
risk (float) : Risk quantity (according to EA settings)
sl (float) : Stop loss distance in pips or price
tp (float) : Take profit distance in pips or price
betrigger (float) : Breakeven will be activated after the position gains this number of pips
beoffset (float) : Offset from entry price. This is the amount of pips you'd like to protect
spread (float) : Enter the position only if the spread is equal or less than the specified value in pips
trailtrig (float) : Trailing stop-loss will be activated after a trade gains this number of pips
traildist (float) : Distance of the trailing stop-loss from current price
trailstep (float) : Moves trailing stop-loss once price moves to favourable by a specified number of pips
atrtimeframe (int) : ATR Trailing Stop timeframe, only updates once per bar close. Options: 1, 5, 15, 30, 60, 240, 1440
atrperiod (int) : ATR averaging period
atrmultiplier (float) : Multiple of ATR to utilise in the new SL computation, default = 1
atrshift (int) : Relative shift of price information, 0 uses latest candle, 1 uses second last, etc. Default = 0
atrtrigger (int) : Activate the trigger of ATR Trailing after market moves favourably by a number of pips. Default = 0 (instant)
symbol (string) : The symbol to trigger this order on (defaults to current symbol)
accfilter (float) : Optional minimum account balance filter
comment (string) : Optional comment (maximum 20 characters)
secret (string) : Optional secret key (must be enabled in dashboard)
freq (string) : Alert frequency. Default = "all", options = "once_per_bar", "once_per_bar_close" and "none"
debug (bool) : Turns on/off debug label
Returns: A stop order alert string with valid PC syntax based on supplied parameters
cancelshortselllimit(licenseID, price, risk, sl, tp, betrigger, beoffset, spread, trailtrig, traildist, trailstep, atrtimeframe, atrperiod, atrmultiplier, atrshift, atrtrigger, symbol, accfilter, comment, secret, freq, debug)
Cancels all short orders with the specified symbol and places a selllimit order. Required params: licenseID, price, risk.
Parameters:
licenseID (string) : Your PC license ID
price (float) : Price or pips to set limit order (according to EA settings)
risk (float) : Risk quantity (according to EA settings)
sl (float) : Stop loss distance in pips or price
tp (float) : Take profit distance in pips or price
betrigger (float) : Breakeven will be activated after the position gains this number of pips
beoffset (float) : Offset from entry price. This is the amount of pips you'd like to protect
spread (float) : Enter the position only if the spread is equal or less than the specified value in pips
trailtrig (float) : Trailing stop-loss will be activated after a trade gains this number of pips
traildist (float) : Distance of the trailing stop-loss from current price
trailstep (float) : Moves trailing stop-loss once price moves to favourable by a specified number of pips
atrtimeframe (int) : ATR Trailing Stop timeframe, only updates once per bar close. Options: 1, 5, 15, 30, 60, 240, 1440
atrperiod (int) : ATR averaging period
atrmultiplier (float) : Multiple of ATR to utilise in the new SL computation, default = 1
atrshift (int) : Relative shift of price information, 0 uses latest candle, 1 uses second last, etc. Default = 0
atrtrigger (int) : Activate the trigger of ATR Trailing after market moves favourably by a number of pips. Default = 0 (instant)
symbol (string) : The symbol to trigger this order on (defaults to current symbol)
accfilter (float) : Optional minimum account balance filter
comment (string) : Optional comment (maximum 20 characters)
secret (string) : Optional secret key (must be enabled in dashboard)
freq (string) : Alert frequency. Default = "all", options = "once_per_bar", "once_per_bar_close" and "none"
debug (bool) : Turns on/off debug label
Returns: A stop order alert string with valid PC syntax based on supplied parameters
cancellong(licenseID, symbol, accfilter, comment, secret, freq, debug)
Cancels all pending long orders with the specified symbol. Required params: licenseID.
Parameters:
licenseID (string) : Your PC license ID
symbol (string) : Symbol to act on (defaults to current symbol)
accfilter (float) : Optional minimum account balance filter
comment (string) : Optional comment to include (max 20 characters)
secret (string) : Optional secret key (must be enabled in dashboard)
freq (string) : Alert frequency. Default = "all", options = "once_per_bar", "once_per_bar_close" and "none"
debug (bool) : Turns on/off debug label
Returns: A cancel long alert command
cancelshort(licenseID, symbol, accfilter, comment, secret, freq, debug)
Cancels all pending short orders with the specified symbol. Required params: licenseID.
Parameters:
licenseID (string) : Your PC license ID
symbol (string) : Symbol to act on (defaults to current symbol)
accfilter (float) : Optional minimum account balance filter
comment (string) : Optional comment to include (max 20 characters)
secret (string) : Optional secret key (must be enabled in dashboard)
freq (string) : Alert frequency. Default = "all", options = "once_per_bar", "once_per_bar_close" and "none"
debug (bool) : Turns on/off debug label
Returns: A cancel short alert command
newsltpbuystop(licenseID, sl, tp, symbol, accfilter, comment, secret, freq, debug)
Updates the stop loss and/or take profit of any pending buy stop orders on the given symbol. Required params: licenseID, sl and/or tp.
Parameters:
licenseID (string) : Your PC license ID
sl (float) : Stop loss pips or price (according to EA settings)
tp (float) : Take profit pips or price (according to EA settings)
symbol (string) : Symbol to act on (defaults to current symbol)
accfilter (float) : Optional minimum account balance filter
comment (string) : Optional comment to include (max 20 characters)
secret (string) : Optional secret key (must be enabled in dashboard)
freq (string) : Alert frequency. Default = "all", options = "once_per_bar", "once_per_bar_close" and "none"
debug (bool) : Turns on/off debug label
Returns: The required alert syntax as a string
newsltpbuylimit(licenseID, sl, tp, symbol, accfilter, comment, secret, freq, debug)
Updates the stop loss and/or take profit of any pending buy limit orders on the given symbol. Required params: licenseID, sl and/or tp.
Parameters:
licenseID (string) : Your PC license ID
sl (float) : Stop loss pips or price (according to EA settings)
tp (float) : Take profit pips or price (according to EA settings)
symbol (string) : Symbol to act on (defaults to current symbol)
accfilter (float) : Optional minimum account balance filter
comment (string) : Optional comment to include (max 20 characters)
secret (string) : Optional secret key (must be enabled in dashboard)
freq (string) : Alert frequency. Default = "all", options = "once_per_bar", "once_per_bar_close" and "none"
debug (bool) : Turns on/off debug label
Returns: The required alert syntax as a string
newsltpsellstop(licenseID, sl, tp, symbol, accfilter, comment, secret, freq, debug)
Updates the stop loss and/or take profit of any pending sell stop orders on the given symbol. Required params: licenseID, sl and/or tp.
Parameters:
licenseID (string) : Your PC license ID
sl (float) : Stop loss pips or price (according to EA settings)
tp (float) : Take profit pips or price (according to EA settings)
symbol (string) : Symbol to act on (defaults to current symbol)
accfilter (float) : Optional minimum account balance filter
comment (string) : Optional comment to include (max 20 characters)
secret (string) : Optional secret key (must be enabled in dashboard)
freq (string) : Alert frequency. Default = "all", options = "once_per_bar", "once_per_bar_close" and "none"
debug (bool) : Turns on/off debug label
Returns: The required alert syntax as a string
newsltpselllimit(licenseID, sl, tp, symbol, accfilter, comment, secret, freq, debug)
Updates the stop loss and/or take profit of any pending sell limit orders on the given symbol. Required params: licenseID, sl and/or tp.
Parameters:
licenseID (string) : Your PC license ID
sl (float) : Stop loss pips or price (according to EA settings)
tp (float) : Take profit pips or price (according to EA settings)
symbol (string) : Symbol to act on (defaults to current symbol)
accfilter (float) : Optional minimum account balance filter
comment (string) : Optional comment to include (max 20 characters)
secret (string) : Optional secret key (must be enabled in dashboard)
freq (string) : Alert frequency. Default = "all", options = "once_per_bar", "once_per_bar_close" and "none"
debug (bool) : Turns on/off debug label
Returns: The required alert syntax as a string
eaoff(licenseID, secret, freq, debug)
Turns the EA off. Required params: licenseID.
Parameters:
licenseID (string) : Your PC license ID
secret (string) : Optional secret key (must be enabled in dashboard)
freq (string) : Alert frequency. Default = "all", options = "once_per_bar", "once_per_bar_close" and "none"
debug (bool) : Turns on/off debug label
Returns: The required alert syntax as a string
eaon(licenseID, secret, freq, debug)
Turns the EA on. Required params: licenseID.
Parameters:
licenseID (string) : Your PC license ID
secret (string) : Optional secret key (must be enabled in dashboard)
freq (string) : Alert frequency. Default = "all", options = "once_per_bar", "once_per_bar_close" and "none"
debug (bool) : Turns on/off debug label
Returns: The required alert syntax as a string

Trend Direction Sequence | Auto-Multi-TimeframeThe main benefit of this indicator is the ability to see multiple higher timeframes at ones to get a better overview of signals that could mark possible trend reversals with more weight than those on the selected timeframe. Since the higher timeframes are calculated automatically, the user needs to set a Period Multiplier that multiplies the selected timeframe several times to determine the higher timeframes. Equal periods are filtered out. And the current highest timeframe is capped at 1 year by TradingView.
It is possible to alter the sequence Count Limit and the underlying Wavelength. The Wavelength defines the distance between the starting and ending candle. This builds the minimum condition to find a trend. A longer Wavelength means that the distortions between the start and end candle can be bigger, so it can become easier to find a trending sequence. But be careful not to set the length too high as this could mean that the resulting sequence does not really represent a trend anymore. The Count Limit defines the completion of a trending sequence. A higher number makes it more difficult to find a completed sequence, but also makes the result more reliable. If the Wavelength is changed, the Count Limit should be adjusted accordingly.
There is also a qualifier for the completion of a sequence. A completed sequence only will be labeled on the chart, if it is proved that the lowest low/highest high of the last two candlesticks of a period is lower/higher than that of the previous two candlesticks. It does not require the trend to be continuous on the last candlestick. On the contrary, a trend shift may already have begun.
By default, the labeling of completed sequences will appear on the highs and lows of the specific periods. Because the higher periods will take time and several candlesticks to appear, the labels will be redrawn accordingly. As an option it is possible to disable the Count Limit for completed sequences so that the labels will be fluently redrawn until the corresponding sequences are interrupted by trend breaks. Only activate this option, if it can serve a plausible strategy.
The count status of all sequences in the specific timeframe periods is listed in a table. Also the results of the trends in higher timeframes are accumulated and combined into an overall trend. Positive trends are counted as positive, negative in the opposite case. To see the resulting Trend Shift Signals, the user can set a filter under 100% so that not all of them will be filtered out and therefore labeled on the chart (this signals cannot be redrawn). An “External Indicator Analysis Overlay” can be used to analyze the profitability with the provided Trend Shift Signal (TSS) which switches from 0 to 1, if the trend becomes positive or from 0 to -1, if the trend becomes negative.

Binance Auto Spot-Futures Premium/Discount -CheThis Script is based in the 2020 @Plumptoiletduck script
Special thanks to @tartigradia for the Auto Detect code for the Binance pair.
It tells us the difference in price between Spot and Perpetual Futures.
Now I incorporated the function that automatically detects the pair we are in to show the premium/discount of that pair.
You never need to select the currency you are in the script anymore!
It is specially designed for Binance coins, it includes all perpetuals.
How to use it?
Usually if the Futures are higher than the Spot it indicates that we are in an over exposure zone of longs in futures.
If the spot is cheaper than the futures it means that the futures are more fearful.
You can use this script with an Open Interest script to get an idea of what is going on.
Other examples:
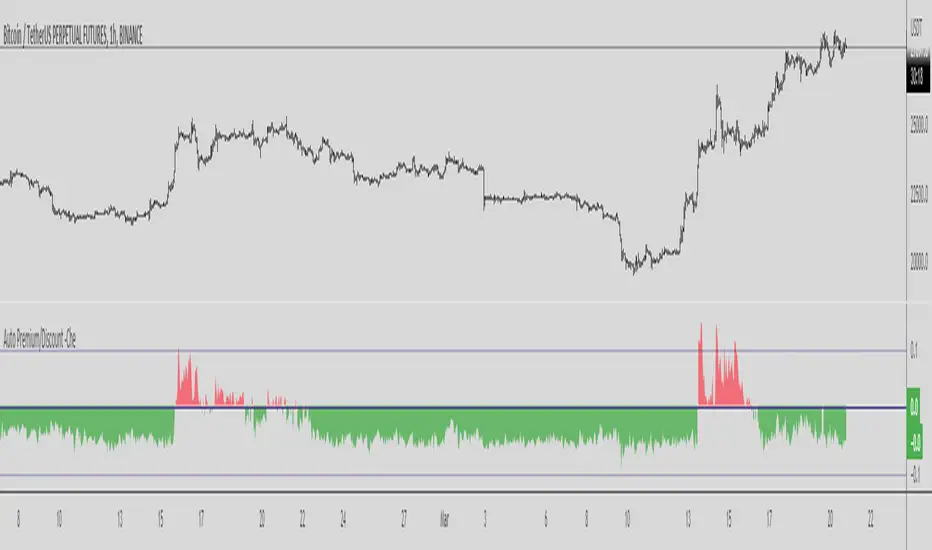
Tailored-Custom Hamonic Patterns█ OVERVIEW
We have included by default 3 known Patterns. The Bat, the Butterfly and the Gartley. But have you ever wondered how effective other,
not yet known models could be? Don't ask yourself the question anymore, it's time to find out for yourself! You have the option to customize
your own Patterns with the Backtesting tool and set Retracement Ratios and Targets for your own Patterns. In addition to this, in order to determine
the Trend at a glance and make Pattern detection more efficient, we have linked the calculation of Patterns to Bands of several types to choose
from (Bollinger, Keltner, Donchian) that you can select from a drop-down menu in the settings and play with the Multiplier
and the Adaptive Length of the Patterns to see how it affects the success rate in the Backtesting table.
█ HOW DOES IT WORK?
- Harmonic Patterns
-Pattern Names, Colors, Style etc… Everything is customizable.
-Dynamic Adaptative Length with Min/Max Length.
- XAB/ABC Ratio
-Min/Max XAB/ABC Configurable Ratio for each Pattern to create your own Patterns.
(This is really the particular option of this Indicator, because it allows you to be able to Backtest in real time
after having played at configuring your own Ratios)
- Bands
-Contrary to the original logic of the HeWhoMustNotBeNamed script, here when the price breaks out of the upper Bands
(example, Bollinger band, Keltner Channel or Donchian Channel) , with a predetermined Minimum and Maximum Length and Multiplier, we can consider
the Trend to be Bearish (and not Bullish) and similarly when the price breaks down in the lower band, we can consider the Trend
to be Bullish (not Bearish) . We have also added the middle line of the Channels (which can be useful for 'Scalper' type Traders.
-The Length of the Bands Filter is directly related to the Dynamic Length of the Patterns.
-You can use a drop-down menu to select from the following Bands Filters :
SMA, EMA, HMA, RMA, WMA, VWMA, HIGH/LOW, LINREG, MEDIAN.
-Sticky and Adaptive Bands options has been included.
- Projections
-BD/CD Projection Ratio configurable for each Pattern.
(Projections are visible as Dotted Lines which we can choose to Extend or not)
- Targets
-Target, PRZ and Stop Levels are set to optimal values based on individual Patterns. (The PRZ Level corresponds to point D
of the detected Pattern so its value should always be 0) but you can change the Targets value (defined in %) as you wish.
Again here, you have the option to fully configure the Style and Extend the Lines or not.
- Backtesting Table
-As said previously, with the possibility of testing the Success Rate of each of the 3 Customizable Patterns,
this option is part of the logic of this Indicator.
- Alerts
-We originally believe that this Indicator does not even need Alerts. But we still decided to include at least one Alert
that you can set for when a new Pattern is detected.
█ NOTES
Thanks to HeWhoMustNotBeNamed for his permission to reuse some part of his zigzag scripts.
Remember to only make a decision once you are sure of your analysis. Good trading sessions to everyone and don't forget,
risk management remains the most important!
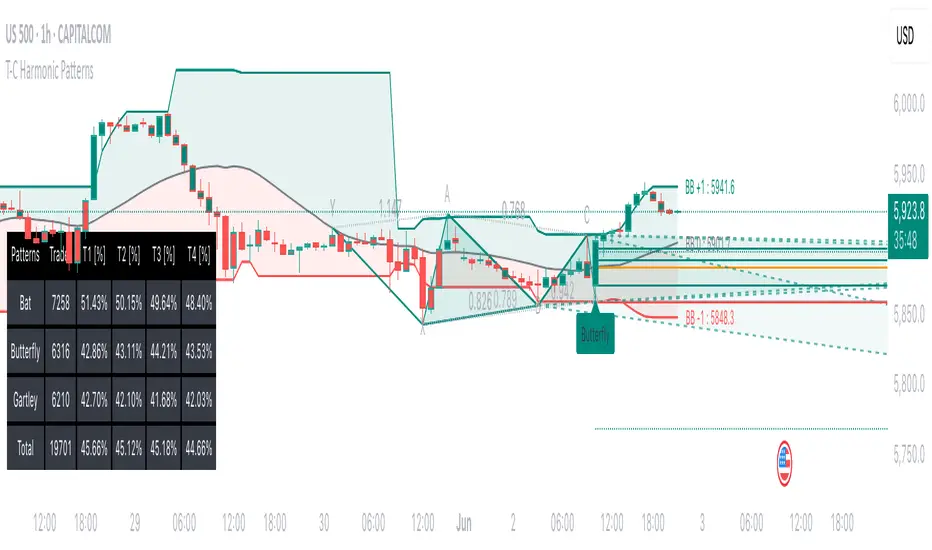
Trend Movement S1-TMIdea:
This script combines: Moving Average (MA), Directional Movement (DMI), MACD
When condition of long or short position from all mentioned indicator are met script opens position. Once trend changes, it closes the position.
Then add some filter conditions to avoid noise.
Concept:
(Note that we take the close to get the closing price)
-Using only cross up down with MA will give a reversal point, but the downside is that it can be noisy.
-MACD will show the current trend detected by cross point.
-Then the +DI , -DI , ADX values are taken into account to confirm the price direction and movement strength.
-This strategy solves this problem by combining 2 more moving averages called 2 trend lines 1 long and 1 short. When the short line crosses up, it will show that the price trend is increasing (at this time the background between these 2 lines will be green) and vice versa (red). To determine if the current trend is bullish or bearish . This will avoid buying when price tend to go down.
-However, there will be many points where some more complex logic is needed. It will add conditions and calculate the probabilities before triggering the signals (You can see them through the item symbols B1, B2, ... ).
How it works:
1. The thin line is stand for short term moving average, and the thick line is stand for long term moving average.
If thin lines cross the thick lines, their color and background will turn green, the price is tend to go up (Uptrend).
If thin lines cross down thick lines, their color and background will turn red, the price is tend to go down (Downtrend).
2. Ability to check the checkbox in setting to show the Golden/De*ath cross.
The yellow symbol "+" is the Golden cross.
The black symbol "+" is the De*th cross.
3. Buy and Sell are show clearly on strategy as the buy and sell point. The default source from bar is CLOSE
4. Setting "Buy only" it using for spot market.
5. When "Not buy in down trend" is checked, it will not trigger buy when in down trend (thin lines cross down thick lines like description in 1.)
6. Setting High spread will call Close buy when it match the High spread bar with the High spread % value
7. It provides setting "Back test From date/To date" for backtest feature. You can set "BacktestFrom date" as the begin of test period. If check box "Using To Date" is check: "Backtest To Date" will be the end of test period.
Suitable time frames:
4h, 1D, 1W
* Please note that this logic does not attempt to predict future prices or 100% accurate signal; Strategy Tester are available to test the profitability of this strategy.
(INVITE ONLY indicator. Please direct message or visit website to try it out)
Hope you guys enjoy!
Examples:
BTCUSD 4H
TSLA 4H

Support & Resistance Trendlines with PP + Fib. Channel█ Support & Resistance Trendlines with Pivot Points + Fibonacci Channel
This script automatically draw support and resistance trend lines based on pivot points and add a fibonacci channel.
It will show potential patterns with the help of support and resistance lines as well as breakout target and pullback entry with the fibonacci extension and retracement levels.
It is based on atolelole's script, I only made it more configurable so please check out his script.
I added the possibility to change values and add additional retracement and extension levels.
I also made it customizable with the possibility to change lines color, width and style.


Auto Linear Trend Target x16Experienced traders always tell us that “Never trade against the trend.” or “Trend is our friend.”. Yes sure, no one wants to trade against the trend. However, there are a lot of trends with different types and cycles, then which trend to follow, which trend they are mentioning? This tool (also known as ALTT x16, Laser Net x16) will support us in identifying different linear trends with different cycles. Nearest history-based targets are also added for our convenience of completeness.
Markets: All.
Timeframes: All. Recommendation: 30m and above.
Periods: Up to 16.
Usage: The higher period of a trend, the more strength it has. Enter when price breakouts a trend line and exit at the nearest trend line and target.

Auto Round levels by Script051This indicator is designed to show psychological levels/round levels.
The difference between this version and the others is that :
It will automatically show round levels for each symbol you select without having to enter "tick value" manually.
Settings
Gap : If the value is equal to zero, the round levels will be found automatically, but if you change the value, the gap between the lines will be adjusted based on the value you specified.
X2 and /2 : doubles or halves the distance between round lines
Number of lines : Specifies the number of lines to be displayed

Auto Adjust SuperTrend Indicator SuperTrend
It is a standard ATR (Average True Range)-based Trailing Indicator. The indicator takes two default values ATR Period and Factor. The standard settings for Super Trend I have seen are 10,3 or 10,2. These settings will not work for all the instruments, and we end up manually changing these settings. This is where Auto-Adjust Supertrend adds value. Auto-Adjust SuperTrend finds the optimized settings for ATRPeriod and Multiple using a defined algorithm to check all the different ATR Periods and Factors. It backtests different combinations of ATR Period and Factors and Indicator switches to these profitable settings as soon as it detects most profitable setting among given range in the settings.
Default ATR Period : 10 to 20
Default Factor : 2 to 5
The above settings can be altered in the indicator settings. Please do keep in mind that the performance of the indicator reduces as we increase the default settings range.
Alerts are available as well
Pls contact me for access.
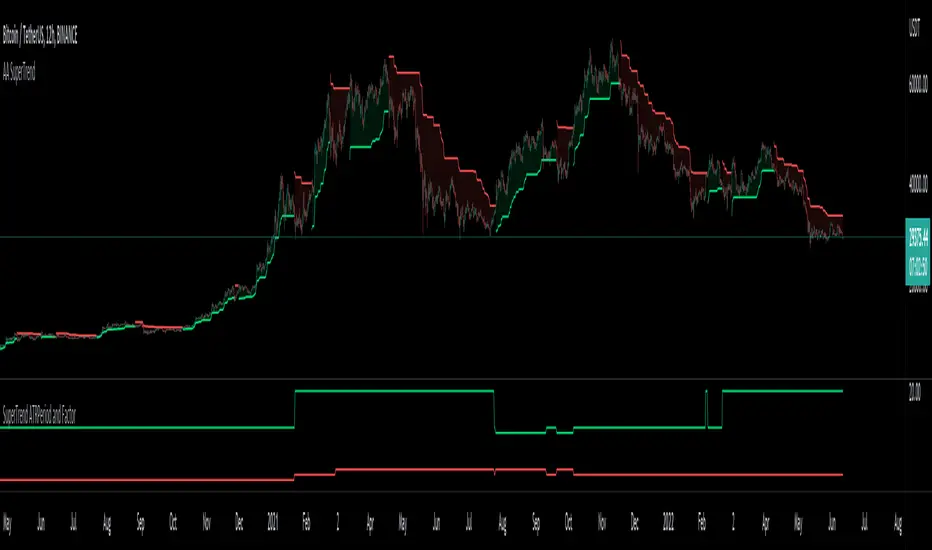
Automated Anchored VWAPThis was reasonably easy to put together and I can't find one that does this in the Library and I've been wanting one. Of course, the drawing tool is just fantastic, but sometimes it can be forgotten as new pivots emerge.
What you'll find elsewhere in the Library is a nice variety of fancier methods for determining an anchor point with labels, lines, timestamps and standard deviations.
This is just a simple script to pull the Anchored VWAP off of the most recent pivot and update that as new pivots become defined.
I wanted it to be really portable so it could easily work into other things you're working on while also keeping the chart reasonably clean.
The way this functions is as follows: A new pivot is found and VWAP is calculated from it. At that point the prior aVWAP is no longer tracked and it picks up from the new pivot .
Of course this means that the plot doesn't generate until the pivot is actually confirmed, which in turn means that the plot doesn't reach back to the pivot , it begins based on whatever "right bars" period you end up choosing.
I kind of like it that way, because you have your eyes on the one that matters until the new one matters.
The downside is that it doesn't track old pivots . The old aVWAP might still be in play. But if you track all of the old one's you'll have a 100 lines on your chart and no one wants that.
I recommend when you look back and think the old one is still in play, use the drawing tool to keep it on the chart.
Otherwise, let the script do the work for you.
Hope its helpful. Let me know what you think should be done to make it better.

HULL SUIT ,VORTEX,VOLUME OSC this strategy includes 3 free tradingview indicators
the 1st indicator is hull suit and the 2nd indicator is vortex and the final one is volume oscillator
for a long signal to be valid
the price must be above green hull suit line
, with new bullish cross on vortex , the blue line has to crossover the red line this would be anew signal to entr long position if volume oscillator above zero line , our stoploss must be under the recent lower low
and the risk to reward ratio will be 1.5
for a short signal to be valid , the price must be below red hull suit line
, with new cross on vortex , the red line has to crossover the blue line this would be anew signal to entr short position if volume oscillator above zero line ,
and lets see what happened to our trade
