Cyatophilum PSAR Bot Trader V2 [BACKTEST]A strategy built upon Parabolic Stop And Reverse.
This new version includes my whole Trend Detector / Stop Loss / Takeprofit / Trailing System.
Backtest

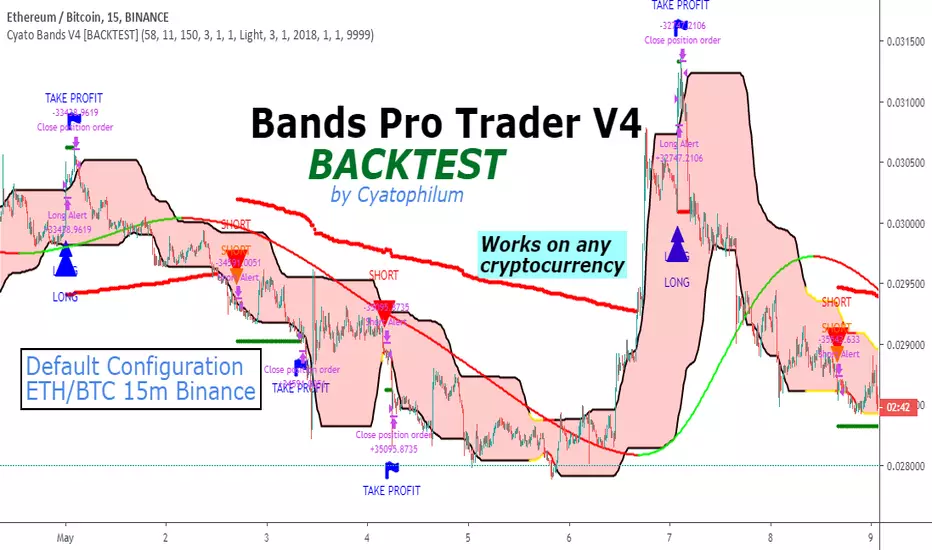
Cyatophilum Bands Pro Trader V5 [BACKTEST]Hi guys, I improved my script once again :)
This version includes a new feature.
Trailing Take Profit with % deviation.
For those seeing the indicator for the first time, it works like Donchian Channels with lag and a channel width condition to detect breakouts. On top of that I integrated a Stop Loss and Take Profit system to pinescript.
Backtest results below are calculated with :
Short + Long Strategy
0.05% Commission
100% of 10 000% equity per trade
Strategy data from 25/04/2019 to 18/05/2019
Default Configuration for BITFINEX:ETHBTC 3 minutes timeframe.
This version also has the Stop Loss / Take Profit system included in the previous version, plus a short / long setup distinction. For example you can choose a different stop loss % for long and for short trades.
Previous version:
This Backtest version is free to test. Just Leave a comment, thanks !
Get access to the Alert Setup version and automate the strategy today !
Purchase the Cyatophilum Indicators pack
I will publish backtests and configurations so make sure to follow me if you don't want to miss anything !
My Website - blockchainfiesta.com -
My Discord channel - discord.gg -

Bitcoin FREE BACKTEST Version BTCUSD 5m BITFINEXA strategy for trading BTC/USD in 5m timeframe.
The strategy includes long and short trades.
You can find the Alert Setup version below.

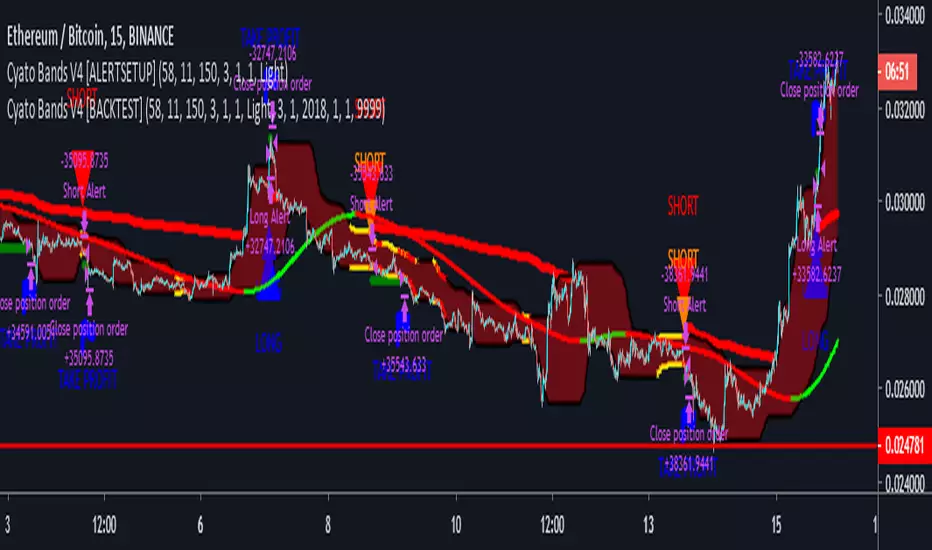
Cyatophilum Bands Pro Trader V4 [ALERTSETUP]> > PRESENTATION < <
This version includes a new feature, engineered to increase profitability.
About the backtest below:
Short + Long Strategy
0.05% Commission
10% of 10 000% equity per trade. Net Profit can be increased with a bigger % of equity.
Strategy data from 01/11/2019 to 30/04/2019
The Cyatophilum Bands, Trailing Stop Loss and Take Profit System are explained on here .
To automate the indicator, there are up to 8 different alerts that you can use:
1. LONG ENTRY
2. LONG EXIT
3. SHORT ENTRY
4. SHORT EXIT
5. TAKE PROFIT LONG
6. TAKE PROFIT SHORT
7. STOP LOSS LONG
8. STOP LOSS SHORT
The access to this indicator is included in the Cyatophilum Indicators pack available on my website .
To get a free trial, simply leave a comment, thank you very much for reading !
Previous version :
Cyatophilum Bands Pro Trader V4 [BACKTEST]This version includes a new feature, engineered to increase profitability.
About the backtest below:
Short + Long Strategy
0.05% Commission
10% of 10 000% equity per trade. Net Profit can be increased with a bigger % of equity.
Strategy data from 01/11/2019 to 30/04/2019
The Cyatophilum Bands, Trailing Stop Loss and Take Profit System are explained in the last version:
The access to this indicator and its Alert Setup version are included in the Cyatophilum Indicators pack available on my website blockchainfiesta.com
To get a free trial, leave a comment, thank you.
Great Expectations [LucF]Great Expectations helps traders answer the question: What is possible? It is a powerful question, yet exploration of the unknown always entails risk. A more complete set of questions better suited to traders could be:
What opportunity exists from any given point on a chart?
What portion of this opportunity can be realistically captured?
What risk will be incurred in trying to do so, and how long will it take?
Great Expectations is the result of an exploration of these questions. It is a trade simulator that generates visual and quantitative information to help strategy modelers visually identify and analyse areas of optimal expectation on charts, whether they are designing automated or discretionary strategies.
WARNING: Great Expectations is NOT an indicator that helps determine the current state of a market. It works by looking at points in the past from which the future is already known. It uses one definition of repainting extensively (i.e. it goes back in the past to print information that could not have been know at the time). Repainting understood that way is in fact almost all the indicator does! —albeit for what I hope is a noble cause. The indicator is of no use whatsoever in analyzing markets in real-time. If you do not understand what it does, please stay away!
This is an indicator—not a strategy that uses TradingView’s backtesting engine. It works by simulating trades, not unlike a backtest, but with the crucial difference that it assumes a trade (either long or short) is entered on all bars in the historic sample. It walks forward from each bar and determines possible outcomes, gathering individual trade statistics that in turn generate precious global statistics from all outcomes tested on the chart.
Great Expectations provides numbers summarizing trade results on all simulations run from the chart. Those numbers cannot be compared to backtest-produced numbers since all non-filtered bars are examined, even if an entry was taken on the bar immediately preceding the current one, which never happens in a backtest. This peculiarity does NOT invalidate Great Expectations calculations; it just entails that results be considered under a different light. Provided they are evaluated within the indicator’s context, they can be useful—sometimes even more than backtesting results, e.g. in evaluating the impact of parameter-fitting or variations in entry, exit or filtering strats.
Traders and strategy modelers are creatures of hope often suffering from blurred vision; my hope is that Great Expectations will help them appraise the validity of their setup and strat intuitions in a realistic fashion, preventing confirmation bias from obstructing perspective—and great expectations from turning into financial great deceptions.
USE CASES
You’ve identified what looks like a promising setup on other indicators. You load Great Expectations on the chart and evaluate if its high-expectation areas match locations where your setup’s conditions occur. Unless today is your lucky day, chances are the indicator will help you realize your setup is not as promising as you had hoped.
You want to get a rough estimate of the optimal trade duration for a chart and you don’t mind using the entry and exit strategies provided with the indicator. You use the trade length readouts of the indicator.
You’re experimenting with a new stop strategy and want to know how long it will keep you in trades, on average. You integrate your stop strategy in the indicator’s code and look at the average trade length it produces and the TST ratio to evaluate its performance.
You have put together your own entry and exit criteria and are looking for a filter that will help you improve backtesting results. You visually ascertain the suitability of your filter by looking at its results on the charts with great Expectations, to see if your filter is choosing its areas correctly.
You have a strategy that shows backtested trades on your chart. Great Expectations can help you evaluate how well your strategy is benefitting from high-opportunity areas while avoiding poor expectation spots.
You want more complete statistics on your set of strategies than what backtesting will provide. You use Great Expectations, knowing that it tests all bars in the sample that correspond to your criteria, as opposed to backtesting results which are limited to a subset of all possible entries.
You want to fool your friends into thinking you’ve designed the holy grail of indicators, something that identifies optimal opportunities on any chart; you show them the P&L cloud.
FEATURES
For one trade
At any given point on the chart, assuming a trade is entered there, Great Expectations shows you information specific to that trade simulation both on the chart and in the Data Window.
The chart can display:
the P & L Cloud which shows whether the trade ended profitably or not, and by how much,
the Opportunity & Risk Cloud which the maximum opportunity and risk the simulation encountered. When superimposed over the P & L cloud, you will see what I call the managed opportunity and risk, i.e the portion of maximum opportunity that was captured and the portion of the maximum risk that was incurred,
the target and if it was reached,
a background that uses a gradient to show different levels of trade length, P&L or how frequently the target was reached during simulation.
The Data Window displays more than 40 values on individual trades and global results. For any given trade you will know:
Entry/Exit levels, including slippage impact,
It’s outcome and duration,
P/L achieved,
The fraction of the maximum opportunity/risk managed by the trade.
For all trades
After going through all the possible trades on the chart, the indicator will provide you with a rare view of all outcomes expressed with the P&L cloud, which allows us to instantly see the most/least profitable areas of a chart using trade data as support, while also showing its relationship with the opportunity/risk encountered during the simulation. The difference between the two clouds is the managed opportunity and risk.
The Data Window will present you with numbers which we will go through later. Some of them are: average stop size, P/L, win rate, % opportunity managed, trade lengths for different types of trade outcomes and the TST (Target:Stop Travel) ratio.
Let’s see Great Expectations in action… and remember to open your Data Window!
INPUTS
Trade direction : You must first choose if you wish to look at long or short trades. Because of the way the indicator works and the amount of visual information on the chart, it is only practical to look at one type of trades at a time. The default is Longs.
Maximum trade Length (MaxL) : This is the maximum walk forward distance the simulator will go in analyzing outcomes from any given point in the past. It also determines the size of the dead zone among the chart’s last bars. A red background line identifies the beginning of the dead zone for which not enough bars have elapsed to analyze outcomes for the maximum trade length defined. If an ATR-based entry stop is used, that length is added to the wait time before beginning simulations, so that the first entry starts with a clean ATR value. On a sample of around 16000 bars, my tests show that the indicator runs into server errors at lengths of around 290, i.e. having completed ~4,6M simulation loop iterations. That is way too high a length anyways; 100 will usually be amply enough to ring out all the possibilities out of a simulation, and on shorter time frames, 30 can be enough. While making it unduly small will prevent simulations of expressing the market’s potential, the less you use, the faster the indicator will run. The default is 40.
Unrealized P&L base at End of Trade (EOT) : When a simulation ends and the trade is still open, we calculate unrealized P&L from an exit order executed from either the last in-trade stop on the previous bar, or the close of the last bar. You can readily see the impact of this selection on the chart, with the P&L cloud. The default is on the close.
Display : The check box besides the title does nothing.
Show target : Shows a green line displaying the trade’s target expressed as a multiple of X, i.e. the amplitude of the entry stop. I call this value “X” and use it as a unit to express profit and loss on a trade (some call it “R”). The line is highlighted for trades where the close reached the target during the trade, whether the trade ended in profit or loss. This is also where you specify the multiple of X you wish to use in calculating targets. The multiple is used even if targets are not displayed.
Show P&L Cloud : The cloud allows traders to see right away the profitable areas of the chart. The only line printed with the cloud is the “end of trade line” (EOT). The EOT line is the only way one can see the level where a trade ended on the chart (in the Data Window you can see it as the “Exit Fill” value). The EOT level for the trade determines if the trade ended in a profit or a loss. Its value represents one of the following:
- fill from order executed at close of bar where stop is breached during trade (which produces “Realized P/L”),
- simulation of a fill pseudo-fill at the user-defined EOT level (last close or stop level) if the trade runs its course through MaxL bars without getting stopped (producing Unrealized P/L).
The EOT line and the cloud fill print in green when the trade’s outcome is profitable and in red when it is not. If the trade was closed after breaching the stop, the line appears brighter.
Show Opportunity&Risk Cloud : Displays the maximum opportunity/risk that was present during the trade, i.e. the maximum and minimum prices reached.
Background Color Scheme : Allows you to choose between 3 different color schemes for the background gradients, to accommodate different types of chart background/candles. Select “None” if you don’t want a background.
Background source : Determines what value will be used to generate the different intensities of the gradient. You can choose trade length (brighter is shorter), Trade P&L (brighter is higher) or the number of times the target was reached during simulation (brighter is higher). The default is Trade Length.
Entry strat : The check box besides the title does nothing. The default strat is All bars, meaning a trade will be simulated from all bars not excluded by the filters where a MaxL bars future exists. For fun, I’ve included a pseudo-random entry strat (an indirect way of changing the seed is to vary the starting date of the simulation).
Show Filter State : Displays areas where the combination of filters you have selected are allowing entries. Filtering occurs as per your selection(s), whether the state is displayed or not. The effect of multiple selections is additive. The filters are:
1. Bar direction: Longs will only be entered if close>open and vice versa.
2. Rising Volume: Applies to both long and shorts.
3. Rising/falling MA of the length you choose over the number of bars you choose.
4. Custom indicator: You can feed your own filtering signal through this from another indicator. It must produce a signal of 1 to allow long entries and 0 to allow shorts.
Show Entry Stops :
1. Multiple of user-defined length ATR.
2. Fixed percentage.
3. Fixed value.
All entry stops are calculated using the entry fill price as a reference. The fill price is calculated from the current bar’s open, to which slippage is added if configured. This simulates the case where the strategy issued the entry signal on the previous bar for it to be executed at the next bar’s open.
The entry stop remains active until the in-trade stop becomes the more aggressive of the two stops. From then on, the entry stop will be ignored, unless a bar close breaches the in-trade stop, in which case the stop will be reset with a new entry stop and the process repeats.
Show In-trade stops : Displays in bright red the selected in-trade stop (be sure to read the note in this section about them).
1. ATR multiple: added/subtracted from the average of the two previous bars minimum/maximum of open/close.
2. A trailing stop with a deviation expressed as a multiple of entry stop (X).
3. A fixed percentage trailing stop.
Trailing stops deviations are measured from the highest/lowest high/low reached during the trade.
Note: There is a twist with the in-trade stops. It’s that for any given bar, its in-trade stop can hold multiple values, as each successive pass of the advancing simulation loops goes over it from a different entry points. What is printed is the stop from the loop that ended on that bar, which may have nothing to do with other instances of the trade’s in-trade stop for the same bar when visited from other starting points in previous simulations. There is just no practical way to print all stop values that were used for any given bar. While the printed entry stops are the actual ones used on each bar, the in-trade stops shown are merely the last instance used among many.
Include Slippage : if checked, slippage will be added/subtracted from order price to yield the fill price. Slippage is in percentage. If you choose to include slippage in the simulations, remember to adjust it by considering the liquidity of the markets and the time frame you’ll be analyzing.
Include Fees : if checked, fees will be subtracted/added to both realized an unrealized trade profits/losses. Fees are in percentage. The default fees work well for crypto markets but will need adjusting for others—especially in Forex. Remember to modify them accordingly as they can have a major impact on results. Both fees and slippage are included to remind us of their importance, even if the global numbers produced by the indicator are not representative of a real trading scenario composed of sequential trades.
Date Range filtering : the usual. Just note that the checkbox has to be selected for date filtering to activate.
DATA WINDOW
Most of the information produced by this indicator is made available in the Data Window, which you bring up by using the icon below the Watchlist and Alerts buttons at the right of the TV UI. Here’s what’s there.
Some of the information presented in the Data Window is standard trade data; other values are not so standard; e. g. the notions of managed opportunity and risk and Target:Stop Travel ratio. The interplay between all the values provided by Great Expectations is inherently complex, even for a static set of entry/filter/exit strats. During the constant updating which the habitual process of progressive refinement in building strategies that is the lot of strategy modelers entails, another level of complexity is no doubt added to the analysis of this indicator’s values. While I don’t want to sound like Wolfram presenting A New Kind of Science , I do believe that if you are a serious strategy modeler and spend the time required to get used to using all the information this indicator makes available, you may find it useful.
Trade Information
Entry Order : This is the open of the bar where simulation starts. We suppose that an entry signal was generated at the previous bar.
Entry Fill (including slip.) : The actual entry price, including slippage. This is the base price from which other values will be calculated.
Exit Order : When a stop is breached, an exit order is executed from the close of the bar that breached the stop. While there is no “In-trade stop” value included in the Data Window (other than the End of trade Stop previously discussed), this “Exit Order” value is how we can know the level where the trade was stopped during the simulation. The “Trade Length” value will then show the bar where the stop was breached.
Exit Fill (including slip.) : When the exit order is simulated, slippage is added to the order level to create the fill.
Chart: Target : This is the target calculated at the beginning of the simulation. This value also appear on the chart in teal. It is controlled by the multiple of X defined under the “Show Target” checkbox in the Inputs.
Chart: Entry Stop : This value also appears on the chart (the red dots under points where a trade was simulated). Its value is controlled by the Entry Strat chosen in the Inputs.
X (% Fill, including Fees) and X (currency) : This is the stop’s amplitude (Entry Fill – Entry Stop) + Fees. It represents the risk incurred upon entry and will be used to express P&L. We will show R expressed in both a percentage of the Entry Fill level (this value), and currency (the next value). This value represents the risk in the risk:reward ratio and is considered to be a unit of 1 so that RR can be expressed as a single value (i.e. “2” actually meaning “1:2”).
Trade Length : If trade was stopped, it’s the number of bars elapsed until then. The trade is then considered “Closed”. If the trade ends without being stopped (there is no profit-taking strat implemented, so the stop is the only exit strat), then the trade is “Open”, the length is MaxL and it will show in orange. Otherwise the value will print in green/red to reflect if the trade is winning/losing.
P&L (X) : The P&L of the trade, expressed as a multiple of X, which takes into account fees paid at entry and exit. Given our default target setting at 2 units of “X”, a trade that closes at its target will have produced a P&L of +2.0, i.e. twice the value of X (not counting fees paid at exit ). A trade that gets stopped late 50% further that the entry stop’s level will produce a P&L of -1.5X.
P&L (currency, including Fees) : same value as above, but expressed in currency.
Target first reached at bar : If price closed above the target during the trade (even if it occurs after the trade was stopped), this will show when. This value will be used in calculating our TST ratio.
Times Stop/Target reached in sim. : Includes all occurrences during the complete simulation loop.
Opportunity (X) : The highest/lowest price reached during a simulation, i.e. the maximum opportunity encountered, whether the trade was previously stopped or not, expressed as a multiple of X.
Risk (X) : The lowest/highest price reached during a simulation, i.e. the maximum risk encountered, whether the trade was previously stopped or not, expressed as a multiple of X.
Risk:Opportunity : The greater this ratio, the greater Opportunity is, compared to Risk.
Managed Opportunity (%) : The portion of Opportunity that was captured by the highest/low stop position, even if it occurred after a previous stop closed the trade.
Managed Risk (%) : The portion of risk that was protected by the lowest/highest stop position, even if it occurred after a previous stop closed the trade. When this value is greater than 100%, it means the trade’s stop is protecting more than the maximum risk, which is frequent. You will, however, never see close to those values for the Managed Opportunity value, since the stop would have to be higher than the Maximum opportunity. It is much easier to alleviate the risk than it is to lock in profits.
Managed Risk:Opportunity : The ratio of the two preceding values.
Managed Opp. vs. Risk : The Managed Opportunity minus the Managed Risk. When it is negative, which is most often is, it means your strat is protecting a greater portion of the risk than it captures opportunity.
Global Numbers
Win Rate(%) : Percentage of winning trades over all entries. Open trades are considered winning if their last stop/close (as per user selection) locks in profits.
Avg X%, Avg X (currency) : Averages of previously described values:.
Avg Profitability/Trade (APPT) : This measures expectation using: Average Profitability Per Trade = (Probability of Win × Average Win) − (Probability of Loss × Average Loss) . It quantifies the average expectation/trade, which RR alone can’t do, as the probabilities of each outcome (win/lose) must also be used to calculate expectancy. The APPT combine the RR with the win rate to yield the true expectancy of a strategy. In my usual way of expressing risk with X, APPT is the equivalent of the average P&L per trade expressed in X. An APPT of -1.5 means that we lose on average 1.5X/trade.
Equity (X), Equity (currency) : The cumulative result of all trade outcomes, expressed as a multiple of X. Multiplied by the Average X in currency, this yields the Equity in currency.
Risk:Opportunity, Managed Risk:Opportunity, Managed Opp. vs. Risk : The global values of the ones previously described.
Avg Trade Length (TL) : One of the most important values derived by going through all the simulations. Again, it is composed of either the length of stopped trades, or MaxL when the trade isn’t stopped (open). This value can help systems modelers shape the characteristics of the components they use to build their strategies.
Avg Closed Win TL and Avg Closed Lose TL : The average lengths of winning/losing trades that were stopped.
Target reached? Avg bars to Stop and Target reached? Avg bars to Target : For the trades where the target was reached at some point in the simulation, the number of bars to the first point where the stop was breached and where the target was reached, respectively. These two values are used to calculate the next value.
TST (Target:Stop Travel Ratio) : This tracks the ratio between the two preceding values (Bars to first stop/Bars to first target), but only for trades where the target was reached somewhere in the loop. A ratio of 2 means targets are reached twice as fast as stops.
The next values of this section are counts or percentages and are self-explanatory.
Chart Plots
Contains chart plots of values already describes.
NOTES
Optimization/Overfitting: There is a fine line between optimizing and overfitting. Tools like this indicator can lead unsuspecting modelers down a path of overfitting that often turns strategies into over-specialized beasts that do not perform elegantly when confronted to the real-world. Proven testing strategies like walk forward analysis will go a long way in helping modelers alleviate this risk.
Input tuning: Because the results generated by the indicator will vary with the parameters used in the active entry, filtering and exit strats, it’s important to realize that although it may be fun at first, just slapping the default settings on a chart and time frame will not yield optimal nor reliable results. While using ATR as often as possible (as I do in this indicator) is a good way to make strat parametrization adaptable, it is not a foolproof solution.
There is no data for the last MaxL bars of the chart, since not enough trade future has elapsed to run a simulation from MaxL bars back.
Modifying the code: I have tried to structure the code modularly, even if that entails a larger code base, so that you can adapt it to your needs. I’ve included a few token components in each of the placeholders designed for entry strategies, filters, entry stops and in-trade stops. This will hopefully make it easier to add your own. In the same spirit, I have also commented liberally.
You will find in the code many instances of standard trade management tasks that can be lifted to code TV strategies where, as I do in mine, you manage everything yourself and don’t rely on built-in Pine strategy functions to act on your trades.
Enjoy!
THANKS
To @scarf who showed me how plotchar() could be used to plot values without ruining scale.
To @glaz for the suggestion to include a Chandelier stop strat; I will.
To @simpelyfe for the idea of using an indicator input for the filters (if some day TV lets us use more than one, it will be useful in other modules of the indicator).
To @RicardoSantos for the random generator used in the random entry strat.
To all scripters publishing open source on TradingView; their code is the best way to learn.
To my trading buddies Irving and Bruno; who showed me way back how pro traders get it done.

Cyatophilum Bands Pro Trader V3 [BACKTEST]An Original Automated Strategy that can be used for Manual or Bot Trading, on any timeframe and market.
>> Presentation <<
How it works
No, these are NOT Bollinger Bands..
The Cyatophilum Bands are an original formula that I created. You will probably never find it anywhere else.
Their behavior is the following:
When they are horizontal it means the trend is going sideways and they represent supports (lower band) and resistances (upper band).
When they are climbing or falling it means the trend is either bullish or bearish and they represent Trend Lines.
The strategy enters Long on a Bull Breakout and enters Short on a Bear Breakout.
The exits are triggered either on a Trend Reversal, a Stop Loss or a Take Profit.
FEATURES
Take Profit System
Stop Loss System
Show Net profit Line
More features here
Finding a profitable configuration is GUARANTEED
0. Choose your symbol and timeframe. Then add the Backtest version to your chart. If at any time you decide to change your timeframe, go back to step 1.
1. Open the strategy tester and look at the buy & hold line.
If it is mostly climbing (last value greater than 0) then it means we are in a bull market. You should then opt or a long only strategy.
If it is mostly dropping (last value lower than 0) then it means we are in a bear market. You should then opt or a short only strategy.
Note : This first step is really important. Trading against the market has very little chances to succeed.
2. Go into the Strategy Input Parameters:
check "Enable Long Results" and uncheck "Enable Short Results" if you are in a long only strategy.
check "Enable Short Results" and uncheck "Enable Long Results" if you are in a short only strategy.
3. Open the Strategy Tester and open the Strategy Properties.
We are going to find the base parameters for the Bands.
The "Bands Lookback" is the main parameter to configure for any strategy. It corresponds to how strong of a support and resistance the bands will behave. The lower the timeframe, the higher lookback you will need. It can move from 10 to 60. For example 60 is a good value for a 3 minute timeframe. Try different values, and look at the "net profit" value in the Overview tab of the Strategy Tester. Keep the Lookback value that shows the best net profit value.
Then play with the "Bands Smoothing" from 2 to 20 and keep the best net profit value.
The "Band Smoothing" is used to reduce noise.
Usually, the default value (10) is what gives the best results.
From this point you should already be able to have a profitable strategy (net profit>0), but we can improve it using the Stop Loss and the Take Profit feature.
4. To activate the Stop Loss feature, click on the "SECURITY" checkbox
You should see horizontal red lines appear.
A Long/short exit alert will be triggered if the price were to cross this line. (A red Xcross will appear)
Choose the Stop Loss percentage.
On top of that, you can enable the feature "Trailing Stop". It will make the red line follow the price, at a speed that you can configure with the "Trailing Speed" parameter.
Now, sometimes a stop is triggered and it was just a fakeout. You can enable "Re-entries after a stop" to avoid missing additional opportunities.
5. To activate the Take Profit feature, click on the "TAKE PROFIT" checkbox
You should see horizontal green lines appear.
A Long/short exit alert will be triggered if the price were to cross this line. (A flag will appear)
Choose the Take Profit percentage.
A low takeprofit will provide a safer strategy but can reduce potential profits.
A higher takeprofit will increase risk but can provide higher potential profits.
6. Money Management
You can configure the backtest according to your own money management.
Let's say you have 10 000 $ as initial capital and want to trade only 5%, set the Order Size to 5% of Equity.
You can increase net profit by increasing the order size but this is at your own risk.
How to create alerts explained here
Sample Uses Cases
Use it literally anywhere
This indicator can be used on any timeframe and market (not only cryptocurrencies).
About the Backtest below
The Net Profit (Gross profit - Gross loss) is calculated with a commission of 0.05% on each order.
No leverage used. This is a long strategy.
Each trade is made with 10 % of equity from an inital capital of 10 000$. The net profit can be bigger by increasing the % of equity but this a trader's rule to minimise the risk.
I am selling access to all my indicators on my website : blockchainfiesta.com
To get a 2 days free trial, just leave a comment , thanks !
Join my Discord for help, configurations, requests, etc. discord.gg
Cyatophilum Bands Pro Trader V2 [BACKTEST]An Original Automated Strategy that can be used for Manual or Bot Trading, on any timeframe and market.
Presentation Page with video
How it works
If you haven't yet please check the ALERT SETUP description.
How to use
Use the specific Backtest options to:
Choose a time period
Enable/Disable Long and Short results
Show the Netprofit Line on chart (green line)
About the Backtest
The Net Profit (Gross profit - Gross loss) is calculated with a commission of 0.05% on each order.
Each trade is made with 100 % of equity from an inital capital of 4000$
No leverage used. Shorts and Longs results are enabled.
Note: You can use this backtest version for finding the best configuration for your favorite market/timeframe. I will also be there to help you.
Find more backtests and configurations on my Discord : discord.gg
Can be easily automated with Autoview.
Get the indicator today!

Smeared VCI BacktestThis is the strategy with backtest date range and trailing-stop / stop-loss for vitelot's Smeared VCI indicator:

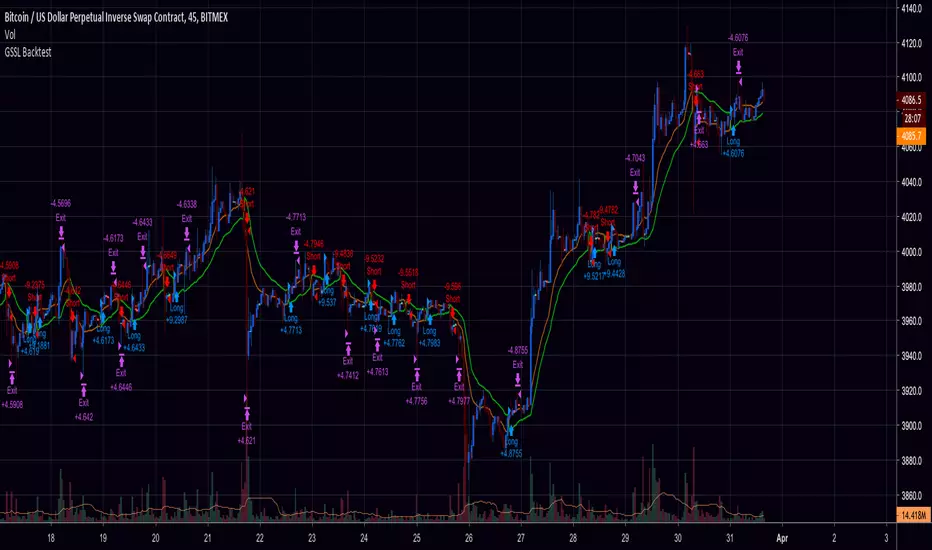
Generalized SSL Backtest w/ TSSLStrategy with Backtest Date Range and Trailing-Stop / Stop-Loss for vitelot's indicator:
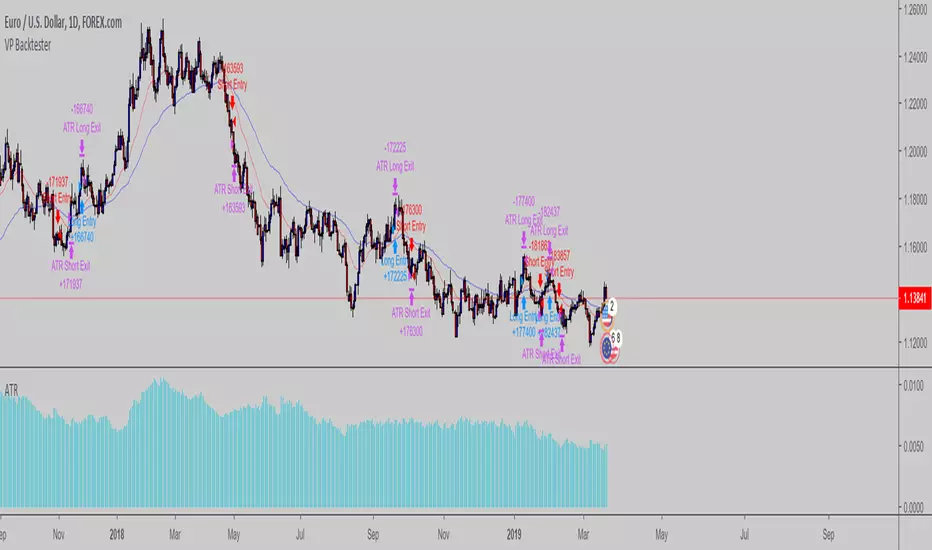
VP Backtester skeletonSimple backtesting skeleton script which uses ATR based stop & profit targets based on the no-nonsense forex way of trading
Commodity Selection Index Backtest The Commodity Selection Index ("CSI") is a momentum indicator. It was
developed by Welles Wilder and is presented in his book New Concepts in
Technical Trading Systems. The name of the index reflects its primary purpose.
That is, to help select commodities suitable for short-term trading.
A high CSI rating indicates that the commodity has strong trending and volatility
characteristics. The trending characteristics are brought out by the Directional
Movement factor in the calculation--the volatility characteristic by the Average
True Range factor.
Wilder's approach is to trade commodities with high CSI values (relative to other
commodities). Because these commodities are highly volatile, they have the potential
to make the "most money in the shortest period of time." High CSI values imply
trending characteristics which make it easier to trade the security.
The Commodity Selection Index is designed for short-term traders who can handle
the risks associated with highly volatile markets.
WARNING:
- For purpose educate only
- This script to change bars colors.

Backtest Larry Williams 9.1 ( exemplo) - JBBacktest simples para compra no rompimento do topo do primeiro candle que abre abaixo e fecha acima da ema de 9 periodos e venda no rompimento do fundo do primeiro candle que fecha abaixo da ema de 9

Three Outside Down Backtest This is a three candlestick bearish reversal pattern consisting of a bearish
engulfing pattern formed by the first two candlesticks then followed by a down
candlestick with a lower close than the prior candlestick.
WARNING:
- For purpose educate only
- This script to change bars colors.

Manual Back Test LinesI created this indicator to primarily manually test other indicators in replay mode.
To use this indicator generally you will:
Select trade type: long or short
Enter your ATR (enter the actual ATR). The indicator will then calculate and plot your SL and targets based on your values
Default Stop Loss is ATR * 1.5
Default Target 1 is ATR * 1.5
Default Target 2 is ATR * 3
Using this indicator on Replay mode is great. What you do is go back in time. Hit play and as the indicator(s) you use provide signals pause.
Pull up options:
Select trade type
Update ATR value
Change date to entry date. Typically if you are trading off the daily timeframe you are going to wait for your current day candle to close to provide signal. That would mean your entry would be on the next day.
Click play and watch, track and record how trade unfolds.
Future updates:
I'd like to be able to have some way to click one button and have it fire that enter trade right now on chart. Also I'm working on figuring out how to calculate the ATR on the entry date so that isn't required to be entered.
Finally, I'd like to have some auto calculation on when targets and SL are hit. I have this partially done but it's more important that I use this indicator than spend time or funds to update it to do that. But I do plan on updating.

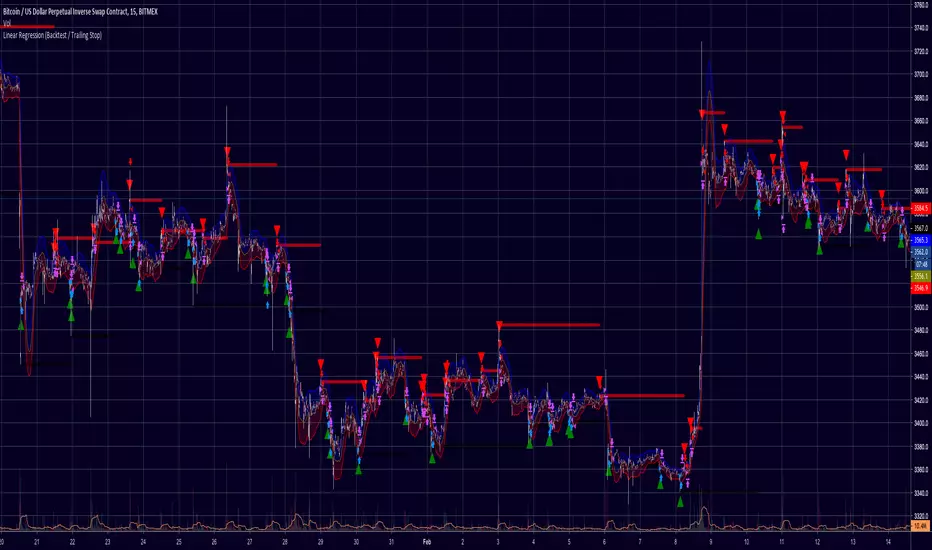
Linear Regression (Backtest / Trailing Stop)A Strategy with Backtest and Trailing Stop for Long/Short
Credits: Study by RafaelZioni - Thanks buddy!
Fisher Transform Multi-Timeframe Backtest (No Trailing)This is the Backtester without Trailing Stops
Credits to mortdiggiddy

[BACKTEST] CMYK-RMI-SMA◊ Introduction
This script makes use of three RMI's and SMA's, that indicate Overbought/Oversold on different Periods that correspond with Frequency’s that move the market.
◊ Origin
This is an update on █▓▒░ CMYK ♦ RMI ♦ TRIPLE ░▒▓█
◊ Usage
This script is intended for Automated Trading on the 1-5 minute chart.
◊ Features Summary
Two Part Indicator
Strategy Type Selection
Three RMI's SMA's
Trend adjustment
Pump/Dump Entry Delay
Pyramiding
Ignore first entries
Take Profit
Interval between Entries
Multiring Fix
Alert signal Seperation
◊ Community
Wanna try this script out ? need help resolving a problem ?
CMYK :: discord.gg
AUTOVIEW :: discordapp.com
TRADINGVIEW UNOFFICIAL :: discord.gg
◊ Setting up Autoview Alerts
Use the study version of this script, To set up The Alerts Autoview Picks up on.
Goto the CMYK Discord for support and Settings.
◊ Backtesting
Use the strategy version of this script for backtesting.
◊ Contact
Wanna try this script out ? need help resolving a problem ?
CMYK :: discord.gg
Happy trades!!!

Adaptive Zero Lag EMA v2 (Strategy w/ Backtest Date Range)This is a modified strategy including Date Range Selection for dasanc's incredible "Adaptive Zero Lag EMA v2":
The Original:

Fisher Transform Multi-Timeframe (Backtest)This is the Backtest Strategy for mortdiggiddy's "Fisher Transform Multi-Timeframe"
For more details check his study:

[BACKTEST] CMYK-RMI-TRIPLE IIThis is the same previous script but without the calculation of the Deribit index (for BITMEX users for example) that can give problems due to no connection with any of the 6 exchanges. Now use 'close' as source.
Settings for BTCUSD or XBTUSD
Best time frame: 5 minutes

[BACKTEST] CMYK-RMI-TRIPLEScript based on 3 RMI and the opening of long / short 'pyramiding' positions.
XBT:USD on BITMEX or BTC:USD on DERIBIT
Includes the calculation of the DERIBIT Index but can be used for any Crypto, the always overloaded BITMEX or even Forex, ...
Best timeframe: 5 minutes. A 5-minutes chart extended to the minimum is equal to a 1H chart.
¡NO REPAINT! : Alerts 'Once per bar'
It has take profit and it's so good that it doesn`t need Stop Loss
Original idea by MVPMC.
