One for AllOne for All (OFA) - Complete ICT Analysis Suite
Version 3.3.0 by theCodeman
📊 Overview
One for All (OFA) is a comprehensive TradingView indicator designed for traders who follow Inner Circle Trader (ICT) concepts. This all-in-one tool combines essential ICT analysis features—sessions, kill zones, previous period levels, and higher timeframe candles with Fair Value Gaps (FVGs) and Volume Imbalances (VIs)—into a single, highly customizable indicator. Whether you're a beginner learning ICT concepts or an experienced trader refining your edge, OFA provides the visual structure needed for precise market analysis and execution.
✨ Key Features
- 🏷️ Customizable Watermark**: Display your trading identity with customizable titles, subtitles, symbol info, and full style control
- 🌍 Trading Sessions**: Visualize Asian, London, and New York sessions with high/low lines, range boxes, and open/close markers
- 🎯 Kill Zones**: Highlight 5 critical ICT kill zones with precise timing and visual boxes
- 📈 Previous Period H/L**: Track Daily, Weekly, and Monthly highs/lows with customizable styles and lookback periods
- 🕐 Higher Timeframe Candles**: Display up to 5 HTF timeframes with OHLC trace lines, timers, and interval labels
- 🔍 FVG & VI Detection**: Automatically detect and visualize Fair Value Gaps and Volume Imbalances on HTF candles
- ⚙️ Universal Timezone Support**: Works globally with GMT-12 to GMT+14 timezone selection
- 🎨 Full Customization**: Control colors, styles, visibility, and layout for every feature
🚀 How to Use
Watermark Setup
The watermark overlay helps you identify your charts and maintain focus on your trading principles:
1. Enable/disable watermark via "Show Watermark" toggle
2. Customize the title (default: "Name") to display your trading name or account identifier
3. Set up to 3 subtitles (default: "Patience", "Confidence", "Execution") as trading reminders
4. Choose position (9 locations available), size, color, and transparency
5. Toggle symbol and timeframe display as needed
Use Case: Display your trading principles or account name for multi-monitor setups or content creation.
Trading Sessions Analysis
Sessions define market character and liquidity availability:
1. Enable "Show All Sessions" to visualize all three sessions
2. Adjust timezone to match your local market (default: UTC-5 for EST)
3. Customize session times if needed (defaults cover standard hours)
4. Enable session range boxes to see consolidation zones
5. Use session high/low lines to identify key levels for the current session
6. Enable open/close markers to track session transitions
Use Case: Identify which session you're trading in, track session highs/lows for liquidity, and anticipate session transition volatility.
Kill Zones Trading
Kill zones are ICT's high-probability trading windows:
1. Enable individual kill zones or use "Show All Kill Zones"
2. **Asian Kill Zone** (2000-0000 GMT): Early positioning and smart money accumulation
3. **London Kill Zone** (0300-0500 GMT): European market opening volatility
4. **NY AM Kill Zone** (0930-1100 EST): Post-NYSE open expansion
5. **NY Lunch Kill Zone** (1200-1300 EST): Midday consolidation or manipulation
6. **NY PM Kill Zone** (1330-1600 EST): Afternoon positioning and closes
7. Customize colors and times to match your trading style
8. Set max days display to control historical visibility (default: 30 days)
Use Case: Focus entries during high-probability windows. Watch for liquidity sweeps at kill zone openings and institutional positioning.
Previous Period High/Low Levels
Previous period levels act as magnetic price targets and support/resistance:
1. Enable Daily (PDH/PDL), Weekly (PWH/PWL), or Monthly (PMH/PML) levels individually
2. Set lookback period (how many previous periods to display)
3. Choose line style: Solid (current emphasis), Dashed (standard), or Dotted (subtle)
4. Customize colors per timeframe for visual hierarchy
5. Adjust line width (1-5) for visibility preference
6. Enable gradient effect to fade older periods
7. Position labels left or right based on chart layout
8. Customize label text for your preferred notation
Use Case: Identify key levels where price is likely to react. Daily levels work on intraday timeframes, Weekly on daily charts, Monthly for swing trading.
Higher Timeframe (HTF) Candles
HTF candles reveal the larger market context while trading lower timeframes:
1. Enable up to 5 HTF slots simultaneously (default: 5m, 15m, 1H, 4H, Daily)
2. Choose display mode: "Below Chart" (stacked rows) or "Right Side" (compact column)
3. Customize timeframe, colors (bull/bear), and titles for each slot
4. **OHLC Trace Lines**: Visual lines connecting HTF candle levels to chart bars
5. **HTF Timer**: Countdown showing time remaining until HTF candle close
6. **Interval Labels**: Display day of week (Daily+) or time (intraday) on each candle
7. For Daily candles: Choose open time (Midnight, 8:30, 9:30) to match your market structure preference
Use Case: Trade lower timeframes while respecting higher timeframe structure. Watch for HTF candle closes to confirm directional bias.
FVG & VI Detection
Fair Value Gaps and Volume Imbalances highlight inefficiencies that price often revisits:
1. **Fair Value Gaps (FVGs)**: Detected when HTF candle wicks don't overlap between 3 consecutive candles
- Bullish FVG: Gap between candle 1 high and candle 3 low (green box by default)
- Bearish FVG: Gap between candle 1 low and candle 3 high (red box by default)
2. **Volume Imbalances (VIs)**: Similar detection but focuses on body gaps
- Bullish VI: Gap between candle 1 close and candle 3 open
- Bearish VI: Gap between candle 1 open and candle 3 close
3. Enable FVG/VI detection per HTF slot individually
4. Customize colors and transparency for each imbalance type
5. Boxes appear on chart at formation and remain visible as retracement targets
**Use Case**: Identify high-probability retracement zones. Price often returns to fill FVGs and VIs before continuing the trend. Use as entry zones or profit targets.
🎨 Customization
OFA is built for flexibility. Every feature includes extensive customization options:
Visual Customization
- **Colors**: Independent color control for every element (sessions, kill zones, lines, labels, FVGs, VIs)
- **Transparency**: Adjust box and label transparency (0-100%) for clean charts
- **Line Styles**: Choose Solid, Dashed, or Dotted for previous period lines
- **Sizes**: Control text size, line width, and box borders
- **Positions**: Place watermark in 9 positions, labels left/right
Layout Control
- **HTF Display Mode**: "Below Chart" for detailed analysis, "Right Side" for space efficiency
- **Drawing Limits**: Set max days for sessions/kill zones to manage chart clutter
- **Lookback Periods**: Control how many previous periods to display (1-10)
- **Gradient Effects**: Enable fading for older previous period lines
Timing Adjustments
- **Timezone**: Universal GMT offset selector (-12 to +14) for global markets
- **Session Times**: Customize each session's start/end times
- **Kill Zone Times**: Adjust kill zone windows to match your market's characteristics
- **Daily Open**: Choose Midnight, 8:30, or 9:30 for Daily HTF candle open time
💡 Best Practices
1. Start Simple: Enable one feature at a time to learn how each element affects your analysis
2. Match Your Timeframe: Use Daily levels on intraday charts, Weekly on daily charts, HTF candles one or two levels above your trading timeframe
3. Kill Zone Focus: Concentrate your trading activity during kill zones for higher probability setups
4. HTF Confirmation: Wait for HTF candle closes before committing to directional bias
5. FVG/VI Entries: Look for price to return to unfilled FVGs/VIs for entry opportunities with favorable risk/reward
6. Customize Colors: Use a consistent color scheme that matches your chart theme and reduces visual fatigue
7. Reduce Clutter: Disable features you're not actively using in your current trading plan
8. Session Context: Understand which session controls the market—trade with session direction or anticipate reversals at session transitions
⚙️ Settings Guide
OFA organizes settings into logical groups for easy navigation:
- **═══ WATERMARK ═══**: Title, subtitles, position, style, symbol/timeframe display
- **═══ SESSIONS ═══**: Enable/disable sessions, times, colors, high/low lines, boxes, markers
- **═══ KILL ZONES ═══**: Individual kill zone toggles, times, colors, max days display
- **═══ PREVIOUS H/L - DAILY ═══**: Daily high/low lines, style, color, lookback, labels
- **═══ PREVIOUS H/L - WEEKLY ═══**: Weekly high/low lines, style, color, lookback, labels
- **═══ PREVIOUS H/L - MONTHLY ═══**: Monthly high/low lines, style, color, lookback, labels
- **═══ HTF CANDLES ═══**: Global display mode, layout settings
- **═══ HTF SLOT 1-5 ═══**: Individual HTF configuration (timeframe, colors, title, FVG/VI detection, trace lines, timer, interval labels)
Each setting includes tooltips explaining its function. Hover over any input for detailed guidance.
📝 Final Notes
One for All (OFA) represents a complete ICT analysis toolkit in a single indicator. By combining watermark customization, session visualization, kill zone highlighting, previous period levels, and higher timeframe candles with FVG/VI detection, OFA eliminates the need for multiple indicators cluttering your chart.
**Version**: 3.3.0
**Author**: theCodeman
**Pine Script**: v6
**License**: Mozilla Public License 2.0
Start with default settings to learn the indicator's structure, then customize extensively to match your personal trading style. Remember: tools provide information, but your edge comes from disciplined execution of a proven strategy.
Happy Trading! 📈
Candlestick analysis

Bitcoin Buy Signal D/WThis is a Bitcoin buy-signal indicator, very simple to use:
It only works on daily and weekly timeframes.
When the Tulu line is above the Hani line, and the price moves back into the Tulu–Hani range, it’s a good buying opportunity.
When the Tulu line is below the Hani line, it’s better to wait for the price to return to Tromsø before buying.
Whenever the price is below Tromsø , it’s always a good time to buy.
Candles that meet these conditions are highlighted in bright yellow to make them easy to spot.
To the moon! 🚀

VB-MainLiteVB-MainLite – v1.0 Initial Release
Overview
VB-MainLite is a consolidated market-structure and execution framework designed to streamline decision-making into a single chart-level view. The script combines multi-timeframe trend, volatility, volume, and liquidity signals into one cohesive visual layer, reducing indicator clutter while preserving depth of information for active traders.
Core Architecture
Trend Backbone – EMA 200
Dedicated EMA 200 acts as the primary trend filter and higher-timeframe bias reference.
Serves as the “spine” of the system for contextualizing all secondary signals (swings, reversals, volume events, etc.).
Custom MA Suite (Envelope Ready)
Four configurable moving averages with flexible source, length, and smoothing.
Default configuration (preset idea: “8/89 Envelope”):
MA #1: EMA 8 on high
MA #2: EMA 8 on low
MA #3: EMA 89 on high
MA #4: EMA 89 on low
All four are disabled by default to keep the chart minimal. Users can toggle them on from the Custom MAs group for envelope or cloud-style configurations.
Nadaraya–Watson Smoother (Swing Framework)
Gaussian-kernel Nadaraya–Watson regression applied to price (hl2) to build a smooth synthetic curve.
Two layers of functionality:
Swing labels (▲ / ▼) at inflection points in the smoothed curve.
Optional curve line that visually tracks the turning structure over the last ~500 bars.
Designed to surface early swing potential before standard MAs react.
Hull Moving Average (Trend Overlay)
Optional Hull MA (HMA) for faster trend visualization.
Color-coded by slope (buy/sell bias).
Default: off to prevent overloading the chart; can be enabled under Hull MA settings.
Momentum, Exhaustion & Pattern Engine
CCI-Based Bar Coloring
CCI applied to close with configurable thresholds.
Overbought / oversold CCI zones map directly into candle coloring to visually highlight short-term momentum extremes.
RSI Top / Bottom Exhaustion Finder
RSI logic applied separately to high-driven (tops) and low-driven (bottoms) sequences.
Plots:
Top arrows where high-side RSI stretches into high-risk territory.
Bottom arrows where low-side RSI indicates exhaustion on the downside.
Useful as confluence around the Nadaraya swing turns and EMA 200 regime.
Engulfing + MA Trend Engine (“Fat Bull / Fat Bear”)
Detects bullish and bearish engulfing patterns, then combines them with MA trend cross logic.
Only when both pattern and MA regime align does the engine flag:
Fat Bull (Engulf + MA aligned long)
Fat Bear (Engulf + MA aligned short)
Candles are marked via conditional barcolor to highlight strong, structured shifts in control.
Fat Finger Detection (Wick Spikes / Stop Runs)
Identifies abnormal wick extensions relative to the prior bar’s body range with configurable tolerance.
Supports detection of potential liquidity grabs, stop runs, or “excess” that may precede reversals or mean-reversion behavior.
Volume & Liquidity Intelligence
Bull Snort (Aggressive Buy Spikes)
Flags events where:
Volume is significantly above the 50-period average, and
Price closes in the upper portion of the bar and above prior close.
Plots a labeled marker below the bar to indicate aggressive upside initiative by buyers.
Pocket Pivots (Accumulation Flags)
Compares current volume vs prior 10 sessions with a filter on prior “up” days.
Highlights pocket pivot days where current green candle volume outclasses recent down-day volumes, suggesting stealth accumulation.
Delta Volume Core (Directional Volume by Price)
Internal volume-by-price style engine over a user-defined lookback.
Splits volume into up-close and down-close buckets across dynamic price bins.
Feeds into S&R and ICT zone logic to quantify where buying vs selling pressure built up.
Structural Context: S&R and ICT Zones
S&R Power Channel
Computes local high/low band over a configurable lookback window.
Renders:
Upper and lower S&R channel lines.
Shaded support / resistance zones using boxes.
Adds Buy Power / Sell Power metrics based on the ratio of up vs down bars inside the window, displayed directly in the zone overlays.
Drops ◈ markers where price interacts dynamically with the top or bottom band, highlighting reaction points.
ICT-Style Premium / Discount & Macro Zones
Two tiered structures:
Local Premium / Discount zones over a shorter SR window.
Macro Premium / Discount zones over a longer macro window.
Each zone:
Uses underlying directional volume to annotate accumulation vs distribution bias.
Provides Delta Volume Bias shading in the mid-band region, visually encoding whether local power flows are net-buying or net-selling.
Enables traders to quickly see whether current trade location is in a local/macro discount or premium context while still respecting volume profile.
Positioning Intelligence: PCD (Stocks)
Position Cost Distribution (PCD) – Stocks Only
Available for stock symbols on intraday up to daily timeframe (≤ 1D).
Uses:
TOTAL_SHARES_OUTSTANDING fundamentals,
Daily OHLCV snapshot, and
A bucketed distribution engine
to approximate cost basis distribution across price.
Outputs:
Horizontal “PCD bars” to the right of current price, density-scaled by estimated share concentration.
Color-coding by profitability relative to current price (profitable vs unprofitable positions).
Labels for:
Current price
Average cost
Profit ratio (share % below current price)
90% cost range
70% cost range
Range overlap as a measure of clustering / concentration.
Multi-Timeframe Trend: Two-Pole Gaussian Dashboard
Two-Pole Gaussian Filter (Line + Cloud)
Smooths a user-selected source (default: close) using a two-pole Gaussian filter with tunable alpha.
Plots:
A thin Gaussian trend line, and
A thick Gaussian “cloud” line with transparency, colored by slope vs past (offsetG).
Functions as a responsive trend backbone that is more sensitive than EMA 200 but less noisy than raw price.
Multi-Timeframe Gaussian Dashboard
Evaluates Gaussian trend direction across up to six timeframes (e.g., 1H / 2H / 4H / Daily / Weekly).
Renders a compact bottom-right table:
Header: symbol + overall bias arrow (up / down) based on average trend alignment.
Row of colored cells per timeframe (green for uptrend, magenta for downtrend) with human-readable TF labels (e.g., “60M”, “4H”, “1D”).
Gives an immediate read on whether intraday, swing, and higher-timeframe flows are aligned or fragmented.
Default Configuration & Usage Guidance
Default state after adding the script:
Enabled by default:
EMA 200 trend backbone
Nadaraya–Watson swing labels and curve
CCI bar coloring
RSI top/bottom arrows
Fat Bull / Fat Bear engine
Bull Snort & Pocket Pivots
S&R Power Channel
ICT Local + Macro zones
Two-pole Gaussian line + cloud + dashboard
PCD engine for stocks (auto-active where data is available)
Disabled by default (opt-in):
Custom MA suite (4x MAs, preset as EMA 8/8/89/89)
Hull MA overlay
How traders can use VB-MainLite in practice:
Use EMA 200 + Gaussian dashboard to define top-down directional bias and avoid trading directly against multi-TF trend.
Use Nadaraya swing labels, RSI exhaustion arrows, and CCI bar colors to time entries within that higher-timeframe bias.
Use Fat Bull / Fat Bear events as structured confirmation that both pattern and MA regime have flipped in the same direction.
Use Bull Snort, Pocket Pivots, and S&R / ICT zones to align execution with liquidity, volume, and location (premium vs discount).
On stocks, use PCD as a positioning map to understand trapped supply, support zones near crowded cost basis, and where profit-taking is likely.

Candle Points (Based on High/Low)Places a dot on the candle at the 25% 50% and 75% mark.
Candle body opacity needs to reduced to see the dots when then are within the candle body.

Today Low ± 50 LevelsThis script plots two dynamic horizontal lines based on today’s daily low. One line is placed 50 points above the low and the other 50 points below it. The lines update automatically each new day and appear on any timeframe

3:55 PM Candle High/Low Levels (ARADO VERSION)a lil better in smaller tfs. Its a veryyyyy cool indicator guys (thanks ivan)

Dynamic `request` demoPublish a new script-This should help people to make better analysis of the market

Candle Color FlipCandle Color Flip highlights potential short-term reversals caused by back-to-back candles closing in opposite colors.
The script:
Watches for a green candle that closes after a red candle without making a lower low, and for a red candle that closes after a green candle without making a higher high.
Plots compact markers on qualifying bars (green triangles below for red→green flips, red triangles above for green→red flips).
Offers alert conditions for both directions, so you can set notifications that fire only when a confirmed bar meets the flip rules.
Can also be used to determine exit points on trades by confirming reversals.
Use it to quickly spot where buyers or sellers may be stepping in while the prior candle’s extremes still hold. You can enable “Any alert() function call” for real-time notifications, or stick with bar-close alerts for confirmation.

PST Super Simple System v2.5+PinkSlips Trading was built to give traders real structure, real tools, and real support — without the confusion or false promises you find everywhere else. Everything we provide is focused on helping you trade with clarity and confidence.
Professional-Grade Indicators
We develop custom TradingView indicators designed to simplify your decision-making. Clean, reliable, and built to support consistent trading.
Daily Live Trading Sessions
Members can watch the market with us in real time. We walk through bias, key levels, trade execution, and risk management so you can learn the process step-by-step.
Personal Guidance and Trade Planning
Whether you need help building a strategy, fixing your discipline, or understanding your data, we offer direct support and tailored plans to help you improve faster.
A Focused, Results-Driven Community
PinkSlips Trading is built for traders who want to get better — not for hype. You’ll be surrounded by people who take trading seriously and are committed to long-term growth.

Institutional Moving Averages (50/100/200)A streamlined Moving Average suite designed for institutional-style trend analysis. This indicator plots the three most critical trend baselines used by traders and funds:
50 MA (Blue): Short-term trend and momentum.
100 MA (Orange): Medium-term support/resistance.
200 MA (Purple): Long-term trend definition (Bull/Bear line).
Features:
Fully Customizable: Switch between SMA, EMA, WMA, RMA, or HMA.
Clean Visuals: Optimized colors for dark and light themes.
Native Performance: Uses standard TradingView plotting for maximum speed and compatibility with the "Style" tab visibility settings.

PinkSlips Sauce IndicatorChecklist v4PinkSlips’ personal checklist assistant for catching clean trend moves.
It stacks EMAs (20/50/200), checks RSI strength, filters chop with ATR, then prints a simple YES/NO checklist so you know when the sauce is actually there.
What it does
EMA trend filter (bullish / bearish structure)
RSI confirmation for high-probability longs & shorts
ATR chop filter so you avoid dead zones
On-chart checklist box: trend up/down, ATR OK, long/short ready, last signal
Optional LONG/SHORT labels on the candles for execution
Use this as your pre–entry checklist so you stop forcing trades and only take the clean PinkSlips setups.

PST Bread Checklist v4Uses 50/200 EMA for higher-timeframe trend
Uses RSI zones + cross for entry
Adds volatility filter (ATR vs its own average)
Optional session filter (RTH 09:30–16:00)
Has a cooldown so you don’t get 10 labels in a row
Shows a checklist box + last signal

Trend Flip Exhaustion SignalsThis Pine Script is designed to generate buy and short trading signals based on a combination of technical indicators. It calculates fast and slow EMAs, RSI, a linear regression channel, and a simplified TTM squeeze histogram to measure momentum.
- Short signals trigger when price is above both EMAs, near the upper regression channel, momentum is weakening, volume is fading, and RSI is overbought.
- Buy signals trigger when price is below both EMAs, near the lower regression channel, momentum is strengthening, volume is surging, and RSI is oversold.
- Signals are displayed as labels anchored to price bars (with optional plotshape arrows for backup).
- The script also plots the EMAs and regression channel for visual context.
In short - it’s a trend‑following entry tool that highlights potential exhaustion points for shorts and potential reversals for buys, with clear on‑chart markers to guide decision‑making.

XAU Macro Regime + Mispricing OscillatorThis indicator is designed to measure the true macro environment behind gold (XAUUSD) and identify when price is aligned with macro flows or mispriced relative to them.
It combines a macro composite index, a mispricing spread oscillator, and automatic divergence detection into one tool.
1. Macro Composite Index (Regime Filter)
The top layer of the indicator constructs a macro regime score derived from:
A basket of gold FX pairs (XAUJPY, XAUAUD, XAUCHF, XAUNZD, XAUSGD)
The inverted DXY (to represent USD pressure on gold)
US30 (to capture global risk appetite and macro sentiment)
Each component is normalized and weighted, then combined into a composite macro index.
A smoothed baseline (SMA) is subtracted from this composite to form the Regime Line.
Interpretation
Regime > 0 (Green background):
Macro environment is supportive for gold.
XAUUSD is more likely to rise, consolidate, or mean revert upward.
Regime < 0 (Red background):
Macro environment is hostile for gold.
XAUUSD is more likely to fall, struggle, or mean revert downward.
This creates a macro trend filter that tells you when it is safer to prefer longs, shorts, or stay out.
2. Mispricing Spread Oscillator (Spread MACD)
The second layer measures the difference between XAUUSD and the macro composite index:
Spread = (Macro Composite) – (Normalized XAUUSD)
This spread is then smoothed into a signal line, and a histogram is plotted from their difference (MACD-style).
Interpretation
Spread > 0:
Gold is undervalued relative to macro conditions.
Macro strength > price strength.
Spread < 0:
Gold is overvalued relative to macro conditions.
Price strength > macro strength.
Spread crossing above signal:
Macro momentum turning bullish relative to price.
Spread crossing below signal:
Macro momentum turning bearish relative to price.
Green histogram: acceleration upward
Red histogram: acceleration downward
This oscillator captures mispricing, momentum shifts, and macro-pressure reversals.
3. Automatic Divergence Detection
The indicator automatically detects:
-Bullish Divergence-
XAUUSD makes a lower low
Spread makes a higher low
→ Price is weaker than macro reality → potential bullish reversal or mispricing reversion.
-Bearish Divergence-
XAUUSD makes a higher high
Spread makes a lower high
→ Price is stronger than macro reality → potential bearish reversal or exhaustion.
Labels (“Bull div” / “Bear div”) appear directly on the oscillator for clarity.
4. What The Indicator Seeks To Do
This indicator aims to answer the question:
“Is gold moving with the true macro pressure behind it, or diverging from it?”
Most gold indicators only watch XAUUSD price.
This one watches:
-gold cross-currency flows
-USD strength
-global risk sentiment
-gold’s relative position vs macro
-mispricing momentum
-divergence between price and macro reality
This creates a unique tool that:
-Detects when gold is overextended
-Detects when gold is undervalued
-Reveals hidden macro strength or weakness
-Highlights turning points and exhaustion
-Shows when a pullback is likely to end
-Shows when a rally is likely to fail
-Gives regime-aware trade direction (long vs short bias)
-Adds divergence labels for precision entries

DAS-Style RVOLDAS RVOL compares the current 1-minute volume to the average volume of that same minute over the past 14 trading days.
Example:
Current 10:00 AM 1-minute volume = 10M
Avg 10:00 AM 1-min volume over last 14 days = 1M
→ RVOL = 10.0 (or 1000%)
So this is time-of-day specific — not just average volume across the whole day.

Kịch bản của tôi//@version=6
indicator(title="Relative Strength Index", shorttitle="Gấu Trọc RSI", format=format.price, precision=2, timeframe="", timeframe_gaps=true)
rsiLengthInput = input.int(14, minval=1, title="RSI Length", group="RSI Settings")
rsiSourceInput = input.source(close, "Source", group="RSI Settings")
calculateDivergence = input.bool(false, title="Calculate Divergence", group="RSI Settings", display = display.data_window, tooltip = "Calculating divergences is needed in order for divergence alerts to fire.")
change = ta.change(rsiSourceInput)
up = ta.rma(math.max(change, 0), rsiLengthInput)
down = ta.rma(-math.min(change, 0), rsiLengthInput)
rsi = down == 0 ? 100 : up == 0 ? 0 : 100 - (100 / (1 + up / down))
rsiPlot = plot(rsi, "RSI", color=#7E57C2)
rsiUpperBand1 = hline(98, "RSI Upper Band1", color=#787B86)
rsiUpperBand = hline(70, "RSI Upper Band", color=#787B86)
midline = hline(50, "RSI Middle Band", color=color.new(#787B86, 50))
rsiLowerBand = hline(30, "RSI Lower Band", color=#787B86)
rsiLowerBand2 = hline(14, "RSI Lower Band2", color=#787B86)
fill(rsiUpperBand, rsiLowerBand, color=color.rgb(126, 87, 194, 90), title="RSI Background Fill")
midLinePlot = plot(50, color = na, editable = false, display = display.none)
fill(rsiPlot, midLinePlot, 100, 70, top_color = color.new(color.green, 0), bottom_color = color.new(color.green, 100), title = "Overbought Gradient Fill")
fill(rsiPlot, midLinePlot, 30, 0, top_color = color.new(color.red, 100), bottom_color = color.new(color.red, 0), title = "Oversold Gradient Fill")
// Smoothing MA inputs
GRP = "Smoothing"
TT_BB = "Only applies when 'SMA + Bollinger Bands' is selected. Determines the distance between the SMA and the bands."
maTypeInput = input.string("SMA", "Type", options = , group = GRP, display = display.data_window)
var isBB = maTypeInput == "SMA + Bollinger Bands"
maLengthInput = input.int(14, "Length", group = GRP, display = display.data_window, active = maTypeInput != "None")
bbMultInput = input.float(2.0, "BB StdDev", minval = 0.001, maxval = 50, step = 0.5, tooltip = TT_BB, group = GRP, display = display.data_window, active = isBB)
var enableMA = maTypeInput != "None"
// Smoothing MA Calculation
ma(source, length, MAtype) =>
switch MAtype
"SMA" => ta.sma(source, length)
"SMA + Bollinger Bands" => ta.sma(source, length)
"EMA" => ta.ema(source, length)
"SMMA (RMA)" => ta.rma(source, length)
"WMA" => ta.wma(source, length)
"VWMA" => ta.vwma(source, length)
// Smoothing MA plots
smoothingMA = enableMA ? ma(rsi, maLengthInput, maTypeInput) : na
smoothingStDev = isBB ? ta.stdev(rsi, maLengthInput) * bbMultInput : na
plot(smoothingMA, "RSI-based MA", color=color.yellow, display = enableMA ? display.all : display.none, editable = enableMA)
bbUpperBand = plot(smoothingMA + smoothingStDev, title = "Upper Bollinger Band", color=color.green, display = isBB ? display.all : display.none, editable = isBB)
bbLowerBand = plot(smoothingMA - smoothingStDev, title = "Lower Bollinger Band", color=color.green, display = isBB ? display.all : display.none, editable = isBB)
fill(bbUpperBand, bbLowerBand, color= isBB ? color.new(color.green, 90) : na, title="Bollinger Bands Background Fill", display = isBB ? display.all : display.none, editable = isBB)
// Divergence
lookbackRight = 5
lookbackLeft = 5
rangeUpper = 60
rangeLower = 5
bearColor = color.red
bullColor = color.green
textColor = color.white
noneColor = color.new(color.white, 100)
_inRange(bool cond) =>
bars = ta.barssince(cond)
rangeLower <= bars and bars <= rangeUpper
plFound = false
phFound = false
bullCond = false
bearCond = false
rsiLBR = rsi
if calculateDivergence
//------------------------------------------------------------------------------
// Regular Bullish
// rsi: Higher Low
plFound := not na(ta.pivotlow(rsi, lookbackLeft, lookbackRight))
rsiHL = rsiLBR > ta.valuewhen(plFound, rsiLBR, 1) and _inRange(plFound )
// Price: Lower Low
lowLBR = low
priceLL = lowLBR < ta.valuewhen(plFound, lowLBR, 1)
bullCond := priceLL and rsiHL and plFound
//------------------------------------------------------------------------------
// Regular Bearish
// rsi: Lower High
phFound := not na(ta.pivothigh(rsi, lookbackLeft, lookbackRight))
rsiLH = rsiLBR < ta.valuewhen(phFound, rsiLBR, 1) and _inRange(phFound )
// Price: Higher High
highLBR = high
priceHH = highLBR > ta.valuewhen(phFound, highLBR, 1)
bearCond := priceHH and rsiLH and phFound
plot(
plFound ? rsiLBR : na,
offset = -lookbackRight,
title = "Regular Bullish",
linewidth = 2,
color = (bullCond ? bullColor : noneColor),
display = display.pane,
editable = calculateDivergence)
plotshape(
bullCond ? rsiLBR : na,
offset = -lookbackRight,
title = "Regular Bullish Label",
text = " Bull ",
style = shape.labelup,
location = location.absolute,
color = bullColor,
textcolor = textColor,
display = display.pane,
editable = calculateDivergence)
plot(
phFound ? rsiLBR : na,
offset = -lookbackRight,
title = "Regular Bearish",
linewidth = 2,
color = (bearCond ? bearColor : noneColor),
display = display.pane,
editable = calculateDivergence)
plotshape(
bearCond ? rsiLBR : na,
offset = -lookbackRight,
title = "Regular Bearish Label",
text = " Bear ",
style = shape.labeldown,
location = location.absolute,
color = bearColor,
textcolor = textColor,
display = display.pane,
editable = calculateDivergence)
alertcondition(bullCond, title='Regular Bullish Divergence', message="Found a new Regular Bullish Divergence, `Pivot Lookback Right` number of bars to the left of the current bar.")
alertcondition(bearCond, title='Regular Bearish Divergence', message='Found a new Regular Bearish Divergence, `Pivot Lookback Right` number of bars to the left of the current bar.')

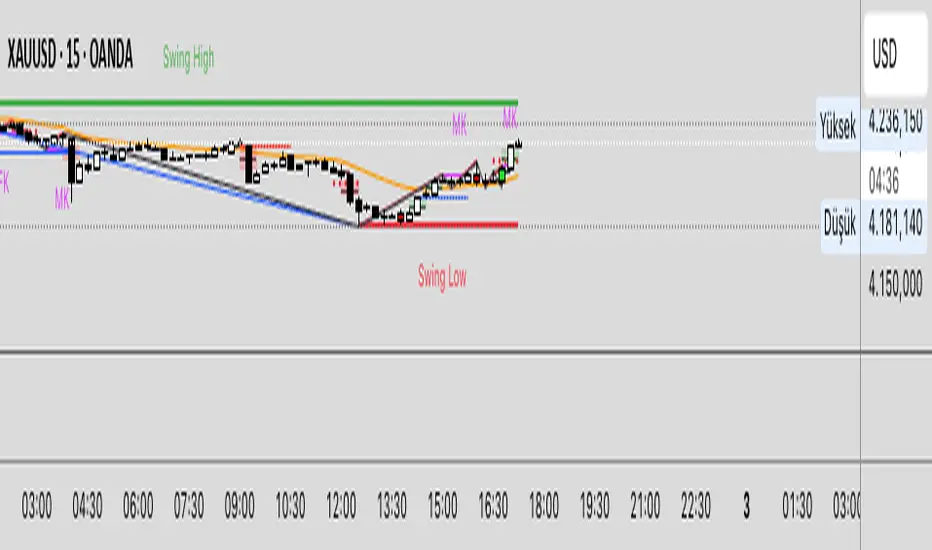
HTF Manipulation Swing Points [Pogiest]General
HTF Manipulation Swing Points plots out relevant swings on the higher timeframes selected and draws a horizontal line anchored from the extremes of the swing point. These are important levels traders can look to base entries off of. This indicator is designed to track higher timeframe swing points on a lower timeframe. It will detect a sweep (Manipulation) or a breakout/breakdown (Failure to Manipulate) based on the higher timeframe candle close.
Usage
Depending on how the higher timeframe candles engage the relevant swing points, it can assist traders on bias and direction given the higher timeframe order-flow, lower timeframe order-flow, zones, levels, etc. Manipulation of swing points can potentially signal the start of a reversal or retracement. Failure to Manipulate swing points can potentially signal continuation of the higher timeframe current trend. It is up to the trader to gauge the price action at these levels.
How the Indicator works
1. Lines (Not engaged) - Plots out line from higher timeframe swing points and extends to the right.
2. Manipulation (M) - M label will be plotted on the swing point line that has been engaged. For example, if 1 hour timeframe was selected in settings and the 1 hour swing point line is plotted on the chart, the indicator will track the first one hour candle to engage the line and wait for the 1 hour engaging candle to close before marking it out as a Manipulation label. It is deemed to be manipulation if the 1 hour candle sweeps the level and closes back into the range.
3. Failure to Manipulate (FTM) - FTM label functions the same as Manipulation in which it waits for the swing point line to be engaged in order for a label to be printed. However, if the price does not sweep the swing point, breaks through, and closes beyond the level then it would be deemed a "Failure to Manipulate".
Note: The timeframe selected in settings will match the engaging candle. For instance, if a 4 hour timeframe is selected, the next 4 hour candle that engages the swing point level will need to close before it displays a label. In addition, this indicator is designed to view on lower timeframes with higher timeframe swing points selected in Settings.
Settings
Timeframes:
1. Choose up to two timeframes for swing point levels.
2. Adjust Pivot lookback.
3. Option to change high and low line color, line style, and line width.
Timeframe Manipulation Labels:
4. Show/hide labels.
5. Option to adjust offset of labels horizontally/vertically for each high or low line.
6. Option to change label colors, label size, and text color.
Line Tags:
7. Show/hide line end tags.
8. Option to change tag size and tag color.
9. Adjust offset of tags.
Overlap Detection:
10. Adjust overlap threshold percentage.
11. Adjust label shift amount (for when labels are overlapping each other).
Alerts:
12. Option to enable/disable all alerts. Select different alerts for each timeframe (i.e. manipulate alert or failure to manipulate alert).
Risk Disclaimer
This indicator is for educational and informational purposes only and does not constitute financial advice. All trading and investment decisions remain solely the responsibility of the user.
Trading involves a high degree of risk, and past performance is not indicative of future results.
Always conduct your own research and consult with a qualified financial professional before making any trading decisions.
By using this indicator, users acknowledge they understand these risks and accept full responsibility for their trading decisions and outcomes.

MTF Slow Stochastic Buy/Sellcompare between 2 timeframe 1 minute and 3 minute, if both 1 and 3 minute time frame value %K is greater then %D then display BUY text.
if both timeframe value %D is greater then %K, display SELL text

Stochastic Signalbuy and sell indicator for slow stochastic, basic indicator to show buy and sell position based on slow stochastic 3 minute time frame.

AlphaTrend++ offset labelsAlphaTrend++
Overview
The AlphaTrend++ is an advanced Pine Script indicator designed to help traders identify buy and sell opportunities in trending and volatile markets. Building on trend-following principles, it uses a modified Average True Range (ATR) calculation combined with volume or momentum data to plot a dynamic trend line. The indicator overlays on the price chart, displaying a colored trend line, a filled trend zone, buy/sell signals, and optional stop-loss tick labels, making it ideal for day trading or swing trading, particularly in markets like futures (e.g., MES).
What It Does
This indicator generates buy and sell signals based on the direction and momentum of a custom trend line, filtered by optional time restrictions and signal frequency logic. The trend line adapts to price action and volatility, with a filled zone highlighting trend strength. Buy/sell signals are plotted as labels, and stop-loss distances are displayed in ticks (customizable for instruments like MES). The indicator supports standard chart types for realistic signal generation.
How It Works
The indicator employs the following components:
Trend Line Calculation: A dynamic trend line is calculated using ATR adjusted by a user-defined multiplier, combined with either Money Flow Index (MFI) or Relative Strength Index (RSI) depending on volume availability. The line tracks price movements, adjusting upward or downward based on trend direction and volatility.
Trend Zone: The area between the current trend line and its value two bars prior is filled, colored green for bullish trends (upward movement) or red for bearish trends (downward movement), providing a visual cue of trend strength.
Signal Generation: Buy signals occur when the trend line crosses above its value two bars ago, and sell signals occur when it crosses below, with optional filtering to reduce signal noise (based on bar timing logic). Signals can be restricted to a 9:00–15:00 UTC trading window.
Stop-Loss Ticks: For each signal, the indicator calculates the distance to the trend line (acting as a stop-loss level) in ticks, using a user-defined tick size (default 0.25 for MES). These are displayed as labels below/above the signal.
Time Filter: An optional filter limits signals to 9:00–15:00 UTC, aligning with active trading sessions like the US market open.
The indicator ensures compatibility with standard chart types (e.g., candlestick or bar charts) to avoid unrealistic results associated with non-standard types like Heikin Ashi or Renko.
How to Use It
Add to Chart: Apply the indicator to a candlestick or bar chart on TradingView.
Configure Settings:
Multiplier: Adjust the ATR multiplier (default 1.0) to control trend line sensitivity. Higher values widen the stop-loss distance.
Common Period: Set the ATR and MFI/RSI period (default 14) for trend calculations.
No Volume Data: Enable if volume data is unavailable (e.g., for certain forex pairs), switching from MFI to RSI.
Tick Size: Set the tick size for stop-loss calculations (default 0.25 for MES futures).
Show Buy/Sell Signals: Toggle signal labels (default enabled).
Show Stop Loss Ticks: Toggle stop-loss tick labels (default enabled).
Use Time Filter: Restrict signals to 9:00–15:00 UTC (default disabled).
Use Filtered Signals: Enable to reduce signal frequency using bar timing logic (default enabled).
Interpret Signals:
Buy Signal: A blue “BUY” label below the bar indicates a potential long entry (trend line crossover, passing filters).
Sell Signal: A red “SELL” label above the bar indicates a potential short entry (trend line crossunder, passing filters).
Trend Zone: Green fill suggests bullish momentum; red fill suggests bearish momentum.
Stop-Loss Ticks: Gray labels show the stop-loss distance in ticks, helping with risk management.
Monitor Context: Use the trend line and filled zone to confirm the market’s direction before acting on signals.
Unique Features
Adaptive Trend Line: Combines ATR with MFI or RSI to create a responsive trend line that adjusts to volatility and market conditions.
Tick-Based Stop-Loss: Displays stop-loss distances in ticks, customizable for specific instruments, aiding precise risk management.
Signal Filtering: Optional bar timing logic reduces false signals, improving reliability in choppy markets.
Trend Zone Visualization: The filled zone between trend line values enhances trend clarity, making it easier to assess momentum.
Time-Restricted Trading: Optional 9:00–15:00 UTC filter aligns signals with high-liquidity sessions.
Notes
Use on standard candlestick or bar charts to ensure accurate signals.
Test the indicator on a demo account to optimize settings for your market and timeframe.
Combine with other analysis (e.g., support/resistance, volume spikes) for better decision-making.
The indicator is not a standalone system; use it as part of a broader trading strategy.
Limitations
Signals may lag in highly volatile or low-liquidity markets due to ATR-based calculations.
The 9:00–15:00 UTC time filter may not suit all markets; disable it for 24-hour assets like forex or crypto.
Stop-loss tick calculations assume consistent tick sizes; verify compatibility with your instrument.
This indicator is designed for traders seeking a robust, trend-following tool with customizable risk management and signal filtering, optimized for active trading sessions.
This update enhances label customization, clarity, and signal usability while preserving all existing AlphaTrend++ logic. The goal is to improve readability during live trading and allow traders to personalize the visual footprint of entries and stop-loss levels.
Improvements
• Cleaner Label Placement
Labels now maintain consistent spacing from the candle, regardless of volatility or ATR expansion.
• Enhanced Visual Structure
BUY/SELL signals remain bold and clear, while SL ticks use a more compact and optional sizing scheme.
• Better User Control
New UI inputs:
Entry Label Size
SL Label Size
SL Label Offset (Ticks)nces.

FRAN CRASH PLAY RULESPurpose
It creates a fixed information panel in the top right corner of your chart that shows the "FRAN CRASH PLAY RULES" - a checklist of criteria for identifying potential crash play setups.
Key Features
Display Panel:
Shows 5 trading rules as bullet points
Permanently visible in the top right corner
Stays fixed while you scroll or zoom the chart
Current Rules Displayed:
DYNAMIC 3 TO 5 LEG RUN
NEAR VERTICAL ACCELERATION
FINAL BAR OF THE RUN UP MUST BE THE BIGGEST
3 FINGER SPREAD / DUAL SPACE
ATLEAST 2 OF 5 CRITERIA NEEDS TO HIT
Customization Options:
Editable Text - Change any of the 5 rules through the settings
Text Color - Adjust the color of the text
Text Size - Choose from tiny, small, normal, large, or huge
Background Color - Customize the panel background and transparency
Frame Color - Change the border color
Show/Hide Frame - Toggle the border on or off
Use Case
This indicator serves as a constant visual reminder of your trading strategy criteria, helping you stay disciplined and only take trades that meet your specific crash play requirements. It's essentially a "cheat sheet" that lives on your chart so you don't have to memorize or look elsewhere for your trading rules.

Smart Money Concepts [Modern Neon V2]This is a visually overhauled version of the popular Smart Money Concepts (SMC) indicator, designed specifically for traders who prefer Dark Mode, High Contrast, and Maximum Visibility.
While the underlying logic preserves the robust structure detection of the original LuxAlgo script, the visual presentation has been completely modernized. The default "dull" colors have been replaced with a vibrant Cyberpunk Neon palette, and text labels have been significantly upscaled to ensure market structure is readable at a glance, even on high-resolution monitors.
🎨 Visual & Style Enhancements:
Neon Palette:
Bullish: Electric Cyan (#00F5FF)
Bearish: Neon Hot Pink (#FF007F)
Neutral/Levels: Bright Gold (#FFD700)
High Visibility Text: Market Structure labels (BOS, CHoCH, HH/LL) have been upgraded from "Tiny" to Normal size. Key Swing Points (Strong High/Low) are set to Large.
Modern "Solid" Blocks: Order Blocks and FVGs feature reduced transparency (60%) for a bolder, solid look that doesn't get washed out on dark backgrounds.
Decluttered: Removed unnecessary "Small" elements and dotted lines to focus on price action.
🛠 Key Features:
Real-Time Structure: Automatic detection of Internal and Swing structure (BOS & CHoCH) with trend coloring.
Order Blocks: Highlights Bullish and Bearish Order Blocks with new mitigation logic.
Fair Value Gaps (FVG): Auto-threshold detection for high-probability gaps.
Premium & Discount Zones: Automatically plots equilibrium zones for better entry targeting.
Multi-Timeframe Levels: Display Daily, Weekly, and Monthly highs/lows.
Trend Dashboard: (If you added the dashboard code) A clean panel displaying the current Internal and Swing trend bias.
CREDITS & LICENSE: This script is a modification of the "Smart Money Concepts " indicator.
Original Author: © LuxAlgo
License: Attribution-NonCommercial-ShareAlike 4.0 International (CC BY-NC-SA 4.0)
creativecommons.org
