Zee's A+ MOMO BreakThis just shows an indicator when you have a 5 minute momentum candle that breaks PMH under specific parameters, i.e candle size, wick size, relative volume, time of day, etc. It will plot the PMH with a gold line automatically. Entry would be at the close of the MOMO break. I highly encourage you to back test your results and see how strong this setup is. Any questions feel free to comment or reach out, thanks.
Candlestick analysis


Impulse %Impulse % — Liquidation Cascade Detector (BTC · 1H)
Impulse % identifies sharp impulsive price moves and liquidation cascades by measuring how much a candle’s range deviates from its historical average in percent.
How it works
Calculates the candle range (in %) relative to price and compares it to the average over N periods.
When the range exceeds the upper band, an Impulse is detected.
Inside each 1H candle, the indicator checks lower timeframes (1m / 5m) to classify the impulse phases:
PANIC — the first minutes of a violent move (forced liquidations, stop hunts).
CAUTION (Cascade) — continuation and “cleanup” phase with elevated risk.
Determines whether the impulse is against the trend using EMA 50 / EMA 200 — the most dangerous scenario.
Highlights risk zones to protect positions and filter new entries.
What it’s for
Avoid entering during liquidation cascades.
Exit at break-even or partially take profit during risky phases.
Recommended Settings — BTC (1H)
Calculation
Calculation TF: (empty = current)
Average Mode: By N bars
N (bars): 100
Range Type: High–Low
Bands
Upper Band (% of average): 130
Lower Band: Auto (same %)
Cascade (First Minutes)
Enable Cascade Filter: ON
When to trigger safety: Only against trend
PANIC (minutes): 3
CAUTION (minutes after PANIC): 15
Trend (EMA)
Use EMA Trend: ON
Fast EMA: 50
Slow EMA: 200
Lower TF Detection
Lower TF: 1m (or 5m if you prefer smoother signals)
Visualization
Style: Columns
Show Bands: ON
Show Band Lines & Mean: ON
How to read it (BTC · 1H)
Purple (PANIC): first minutes of liquidation — do not enter.
Yellow (CAUTION): cascade phase — high risk, manage/exit.
Normal color: no active cascade — strategy allowed.
Best practice:
1m/5m → real-time cascade detection
1H → decision level
4H → market context

Trend zooming boxThis script clearly find trend.
You will be able to find areas where you get large impulsive moves in history easily. Not too much to describe.

Victor aimstar past strategy -v1Introducing the ultimate all-in-one DIY strategy builder indicator, With over 30+ famous indicators (some with custom configuration/settings) indicators included, you now have the power to mix and match to create your own custom strategy for shorter time or longer time frames depending on your trading style. Say goodbye to cluttered charts and manual/visual confirmation of multiple indicators and hello to endless possibilities with this indicator.
What it does
==================
This indicator basically help users to do 2 things:
1) Strategy Builder
With more than 30 indicators available, you can select any combination you prefer and the indicator will generate buy and sell signals accordingly. Alternative to the time-consuming process of manually confirming signals from multiple indicators! This indicator streamlines the process by automatically printing buy and sell signals based on your chosen combination of indicators. No more staring at the screen for hours on end, simply set up alerts and let the indicator do the work for you.

Nooner's Heikin-Ashi/Bull-Bear CandlesCandles are colored red and green when Heikin-Ashi and Bull/Bear indicator agree. They are colored yellow when they disagree.

ICT Macro Tracker - Study Version (Original by toodegrees)This indicator is a modified study version of the ICT Algorithmic Macro Tracker by toodegrees, based on the original open-source script available at The original indicator plots ICT Macro windows on the chart, corresponding to specific time [ periods when the Interbank Price Delivery Algorithm undergoes checks/instructions (aka "macros") for the price engine to reprice to an area of liquidity or inefficiency.
This study version adds functionality to hide bars outside macro periods. When enabled, the indicator draws boxes that cover the full chart height during non-macro periods, obscuring those bars so only macro periods are visible. This helps focus on macro-only price action. The feature is configurable, allowing users to enable or disable it and customize the box color. All original functionality remains intact.


NQ 300+ Point Day Checklist (Bias + Alerts + Markers)This indicator helps identify high-range (≥300-point) days on Nasdaq-100 futures (NQ / MNQ) using a clear, rule-based checklist.
It evaluates volatility, compression, price displacement, prior-day structure, and overnight activity to generate a daily expansion score (0–6). Higher scores signal an increased likelihood of a strong trending or expansion day.
The script also provides:
Expansion probability levels (Normal / Watch / High-Prob)
Bullish, bearish, or neutral bias
On-chart markers and background highlights
Optional alerts for early awareness
Best used on the Daily timeframe to help traders focus on high-opportunity days and avoid overtrading during consolidation.
This is a context and probability tool — not a trade signal.

CHOP-O-METER - Multi-Factor Choppiness DetectorA composite indicator that quantifies market choppiness using four independent measurements, helping you identify when to trade trends vs. when to sit out or fade moves.
━━━━━━━━━━━━━━━━━━━━━━━━━━━━━━━━━━━━━━━━
HOW IT WORKS
The Chop-O-Meter combines four normalized components (each scaled 0-100) into a single weighted score:
1. Price Efficiency (Kaufman-style)
Measures how efficiently price moved from point A to B. If price travels far but nets little distance, efficiency is low = high chop.
2. Direction Change Frequency
Counts how often price direction flips within the lookback period. More flips = more chop.
3. Mean Reversion Intensity
Tracks how often price crosses its moving average. Frequent crosses indicate a ranging, choppy market.
4. ATR Expansion Ratio
Compares the sum of individual bar ranges to the total period range. High ratio means lots of movement within a tight overall range = chop.
━━━━━━━━━━━━━━━━━━━━━━━━━━━━━━━━━━━━━━━━
READING THE INDICATOR
Above 65 (Red Zone): High chop — avoid trend-following, consider mean-reversion or staying flat
Below 35 (Green Zone): Trending — momentum strategies more likely to succeed
35-65 (Orange): Transitional/uncertain regime
━━━━━━━━━━━━━━━━━━━━━━━━━━━━━━━━━━━━━━━━
SIGNALS
🔻 Green triangle (top): Chop breaking down — potential trend starting
🔺 Red triangle (bottom): Trend exhausting — chop may be returning
━━━━━━━━━━━━━━━━━━━━━━━━━━━━━━━━━━━━━━━━
SETTINGS
Lookback Period: Number of bars to analyze (default 20)
Component Weights: Adjust influence of each factor
Thresholds: Customize high/low chop boundaries
Show Components: Toggle individual factor plots for debugging
━━━━━━━━━━━━━━━━━━━━━━━━━━━━━━━━━━━━━━━━
USE CASES
Filter out trend trades when chop score is high
Reduce position size in choppy regimes
Switch between mean-reversion and momentum strategies
Identify regime transitions early
━━━━━━━━━━━━━━━━━━━━━━━━━━━━━━━━━━━━━━━━
ALERTS INCLUDED
Entering High Chop
Entering Trend
Chop Breaking Down

Ahmed Gold Signals - 5M LIVE (Frequent)📈 Gold (XAUUSD) Trading Signals – Precision-Based Strategy
Our Gold signals are built on pure price action, not random indicators or guesswork.
🔍 How our signals are generated
We focus on:
🧲 Liquidity Sweeps
Identifying when price grabs stop-losses above highs or below lows and then reverses
📊 Clear trend direction using EMA 50 & EMA 200
✅ Strong confirmation candles after the sweep
🎯 Entries only in the direction of the trend to increase accuracy
🔵 BUY Signals
Bullish market structure
Price sweeps liquidity below recent lows
Strong bullish confirmation candle closes
➡️ High-probability BUY setup
🔴 SELL Signals
Bearish market structure
Price sweeps liquidity above recent highs
Strong bearish confirmation candle closes
➡️ High-probability SELL setup
⏱️ Timeframe
5-minute chart (5M)
Fast, precise signals ideal for scalping Gold
🛡️ Risk Management
Stop loss placed beyond the liquidity sweep
Clear take-profit targets
Risk-to-reward typically 1:2 or better
⚠️ Important Notes
We do not trade every move
We wait for confirmation
Quality over quantity — always

Al Brooks - Bar CountIndicator Purpose:
This indicator displays bar counts on the chart to help traders identify important time nodes and cycle transitions
Features smart session filtering with automatic futures/stock detection and appropriate trading session counting
Core Features:
Smart asset detection: Auto-detect futures and stocks
Session filter toggle: Choose all-day or session-specific counting
Auto timezone handling: Chicago time for futures, NY time for stocks
Flexible display control: Customizable display frequency and label size
Session Settings:
8:30-15:15 (CT) / Futures mode: Chicago time 8:30-15:15 (CT)
9:30-16:00 (ET) / Stock mode: New York time 9:30-16:00 (ET)
All-day mode: Count from first bar of the day
Timeframe Correspondence:
Multiples of 3: Correspond to 15-minute chart update cycles
Multiples of 12: Correspond to 1-hour chart update cycles
18: Key nodes, important time turning points

EMA Market Regime & Real-Time Candle Projection System📌 EMA Market Regime & Real-Time Candle Projection System
EMA Market Regime & Parabolic Projection is a real-time market structure system designed to anticipate candle behavior before it fully forms, by dynamically projecting price levels based on trend strength, acceleration, and market expansion.
Unlike traditional indicators that react after the candle closes, this system continuously adapts to live price data to provide early insight into bullish, bearish, parabolic, and exhaustion phases.
🔍 Core Concept
The system operates on four key dimensions:
Market Structure
Uses a fast and a slow EMA to determine the dominant market regime (bullish or bearish).
Directional Momentum
Measures EMA slope to confirm directional commitment.
Acceleration & Parabolic Detection
Identifies true parabolic movements through acceleration analysis, filtering out weak or range-bound price action.
Expansion Validation
Confirms that movements are supported by genuine market expansion, reducing false signals.
By combining these elements, the indicator projects a dynamic price level in real time, effectively drawing a forward-looking guide that adapts as each candle evolves.
🧠 Real-Time Candle Projection
The projected line represents a dynamic equilibrium level derived from EMA structure and acceleration.
This allows traders to:
Anticipate continuation vs exhaustion
Visualize momentum shifts before candle close
Read potential candle direction and strength in real time
The projection is non-repainting and updates tick-by-tick during the candle’s formation.
🎯 Market Regime Classification
The system automatically classifies the market into distinct states:
Bullish Trend – Positive structure with controlled momentum
Bearish Trend – Negative structure with controlled momentum
Parabolic Expansion – Accelerated trend with strong continuation potential
Parabolic Exhaustion – Loss of acceleration signaling potential reversal or pullback
Neutral / Range – Low momentum and low expansion (no-trade zone)
Each state is visually encoded using subtle, professional coloring, ensuring price candles always remain the primary focus.
🛡️ Professional-Grade Filters
Anti-range and anti-fake breakout filtering
Cooldown logic to prevent repetitive signals
Slope normalization relative to volatility
Designed to remain readable on M1–M5 scalping and higher timeframes
⚙️ Designed For
Scalping & Intraday Trading
Real-time decision-making
Trend continuation & exhaustion timing
Prop-firm and professional trading environments
This system is intended as a market structure and timing tool, not a signal spam indicator.
⚠️ Disclaimer
This indicator does not predict the future and does not provide guaranteed results. It is designed to assist discretionary traders by improving real-time market reading and execution timing.

Opening Range Breakout with VWAP & RSI ConfirmationThis indicator identifies breakout trading opportunities based on the Opening Range Breakout (ORB) strategy combined with intraday VWAP and higher timeframe RSI confirmation.
Opening Range: Calculates the high, low, and midpoint of the first 15 or 30 minutes (configurable) after your specified market open time.
Intraday VWAP: A volume-weighted average price calculated manually and reset daily, tracking price action throughout the trading day.
RSI Confirmation: Uses RSI from a user-selected higher timeframe (1H, 4H, or Daily) to confirm signals.
Buy Signal: Triggered when VWAP breaks above the Opening Range High AND the RSI is below or equal to the buy threshold (default 30).
Sell Signal: Triggered when VWAP breaks below the Opening Range Low AND the RSI is above or equal to the sell threshold (default 70).
Visuals: Plots Opening Range levels and VWAP on the chart with clear buy/sell markers and optional labels showing RSI values.
Alerts: Provides alert conditions for buy and sell signals to facilitate timely trading decisions.
This tool helps traders capture momentum breakouts while filtering trades based on momentum strength indicated by RSI.

Ichimoku + VWAP + OBV + ATR Full System (NQ Daytrade)Extended Indicator Description
Ichimoku + VWAP + OBV + ATR Full System is a rule-based intraday trading indicator designed specifically for NQ day trading, focusing on trend alignment, participation confirmation, and volatility-aware execution.
This indicator does not rely on a single signal or crossover. Instead, it integrates multiple market dimensions into one structured framework to help traders identify high-probability trend continuation scenarios while avoiding low-quality, range-bound conditions.
System Philosophy
The core idea of this system is simple:
trade only when trend, price location, volume, and volatility are aligned.
Each component plays a specific role and is not meant to be used in isolation. The indicator works best when all conditions reinforce the same directional bias.
Component Breakdown
Ichimoku Cloud
Used to define the primary market structure and directional bias. The system favors trades only when price action aligns clearly above or below the cloud, helping filter out indecisive or transitional phases.
VWAP
Acts as a session-based equilibrium reference. Price position and distance relative to VWAP are used to confirm whether the market is trending with intent rather than reverting to the mean.
OBV (On-Balance Volume)
Provides participation and flow confirmation. OBV helps validate whether price movement is supported by volume, reducing the likelihood of false breakouts or weak trend signals.
ATR (Average True Range)
Used as a volatility filter and risk-awareness tool. ATR conditions help the system avoid low-volatility environments and support more realistic expectations for intraday movement.
Trade Logic Overview
The system is designed around trend-following pullbacks, not prediction or counter-trend trading.
When trend structure is established and confirmed by VWAP positioning and OBV behavior, pullback zones within the trend become areas of interest. ATR conditions ensure that trades are taken only when sufficient movement potential exists.
Rather than generating frequent signals, the system prioritizes selectivity and clarity, making it suitable for disciplined day traders who value context over quantity.
Intended Use
This indicator is built for:
NQ intraday and day trading
Trend continuation and pullback strategies
Traders who prefer structured, confirmation-based systems
Lower to mid intraday timeframes such as 3-minute, 5-minute, and 15-minute charts
Important Notes
This is not an automated trading system and does not provide guaranteed results. The indicator is designed as a decision-support tool to assist with market context, directional bias, and trade timing. Risk management, execution, and position sizing remain the responsibility of the user.
롱/숏 삼각형 시그널
동그라미 청산 시그널
VWAP 밴드 기반 방향성
OBV 보조지표
이름 (Name)
BTC Scalping Signal – VWAP + OBV
짧은 설명 (Short Description)
VWAP 밴드와 OBV를 기반으로 방향성, 진입·청산 시그널을 제공하는 스캘핑 지표입니다.
긴 설명 (Long Description)
이 지표는 BTC 단기 스캘핑을 위해 설계된 것으로, 특히 15분봉 환경에 최적화되어 있습니다.
VWAP 밴드의 위치와 추세 판별 로직을 기반으로 롱·숏 진입 신호를 제공합니다.
OBV 모멘텀을 보조 필터로 사용하여 돌파 및 되돌림 가능성을 판단합니다.
시장 변동성이 축소되거나 평균회귀 신호가 감지될 때 청산 시그널을 표시합니다.
삼각형(진입), 원형(청산) 등 직관적 시각 요소를 통해 빠른 의사결정을 지원합니다.

Daily contextThis indicator automatically marks the Previous Day’s High and Low, as well as the market’s midnight opening price.
These levels are updated at the start of each new trading day and remain visible throughout the entire session.
By providing key daily reference points, the indicator helps establish a clear market context and allows traders to immediately understand where price is positioned relative to the previous day’s range and the daily open.

DeltaPulseDeltaPulse: Professional Cumulative Volume Delta Indicator
DeltaPulse is a free cumulative volume delta (CVD) indicator engineered for modern traders who demand precision, adaptability, and visual clarity. Unlike traditional CVD tools that often suffer from scaling issues, excessive noise, or poor responsiveness across timeframes, DeltaPulse delivers a streamlined, professional-grade solution that "just works" – providing actionable insights into buying and selling pressure with minimal setup.
This indicator accumulates the net difference between buying and selling volume (inferred from candle direction), normalizes it intelligently for consistent readability, and applies advanced smoothing to filter out market noise while preserving momentum signals. The result is a clean, momentum-colored line in a dedicated pane, enhanced by subtle visual cues that highlight key market dynamics.
Whether you're a day trader scalping intraday moves, a swing trader analyzing weekly trends, or an institutional analyst reviewing futures contracts, DeltaPulse adapts seamlessly to your workflow. It's designed to be your go-to tool for confirming trends, spotting divergences, and identifying order flow imbalances – all without the bloat of overcomplicated features.
Key Features
Intelligent Normalization for Universal Compatibility
Automatically adjusts scaling based on chart timeframe and symbol volume profile.
Intraday (1-5 min): Uses a 100-period volume average for responsive, lively signals.
Intraday (15+ min): 50-period average for balanced sensitivity.
Daily/Weekly+: 20-period average for clean, long-term perspective.
Ensures the indicator remains visually meaningful and non-flat on any asset – from low-volume penny stocks to high-liquidity indices like ES or NQ.
Advanced Smoothing Options
Six moving averages to match your trading style:
EMA - Quick reactions to recent delta shifts
SMA - Simple Moving Average - Stable, noise-resistant baseline
WMA - Weighted Moving Average - Emphasizes recent data with linear weighting
HMA - Hull Moving Average - Ultra-smooth yet lag-free – ideal for momentum trading
RMA - Running Moving Average (Wilder's) - Trend-following with minimal whipsaws
VWMA - Volume-Weighted Moving Average - Highlights high-volume delta moves
Lower values increase reactivity; higher values enhance smoothness.
Flexible Reset Mechanisms
Session Reset: Clears CVD at the first regular trading bar each day – perfect for intraday analysis.
Weekly Reset: Resets at the start of each new week – suited for swing and position trading.
No manual intervention required; the indicator handles resets reliably across all timeframes.
Background Shading:
Light green tint above zero; light red below.
Extreme highlights when smoothed CVD exceeds 90% of its 80-bar high/low – flags potential exhaustion or absorption zones.
How It Works
DeltaPulse calculates a simple yet effective volume delta on each bar:
Bullish Bar (close ≥ open): Adds full volume as positive delta.
Bearish Bar (close < open): Subtracts full volume as negative delta.
This raw delta accumulates into a running total (CVD), resetting based on your chosen mode. The total is then:
Normalized against a timeframe-adaptive volume average to ensure consistent scaling.
Smoothed using your selected MA type for noise reduction and trend clarity.
Plotted with momentum-based coloring and visual enhancements.
The output is a single, intuitive line that reveals the underlying battle between buyers and sellers – far more reliably than raw volume bars or basic oscillators.
Trading Applications
DeltaPulse shines in revealing order flow dynamics that price action alone often conceals. Here are proven ways to integrate it:
Trend Confirmation & Momentum Trading
Bullish Setup: Rising green line above zero confirms buyer control – enter longs on pullbacks to support.
Bearish Setup: Falling red line below zero signals seller dominance – short on rallies to resistance.
Zero Line Crosses as Reversal Signals
A crossover from negative to positive territory often marks a sentiment shift – use for entry triggers.
Combine with volume spikes or key levels for high-probability setups.
Enhancement: VWMA mode amplifies signals on high-volume breakouts.
Absorption & Exhaustion Zones
Watch for extreme background highlights: A spike to highs followed by reversal suggests large players absorbing supply.
Ideal for fade trades near overextended levels (e.g., after news events).
Avoid low-volume or illiquid symbols, as delta inference relies on reliable candle data.
Timeframe-Agnostic: Solves the common CVD pitfall of being "dead" on intraday charts or erratic on daily ones through smart, automatic normalization.
Lag-Free Responsiveness: The default HMA smoothing strikes a rare balance – smoother than EMA, faster than SMA – without the computational overhead of exotic filters.
Zero Clutter: No histograms, no extraneous plots, no overwhelming alerts. Just pure, distilled order flow intelligence.

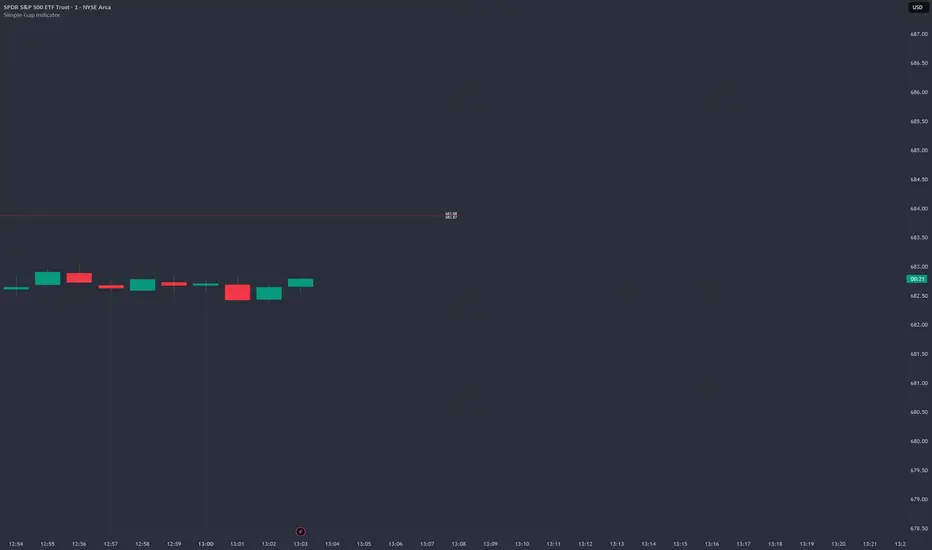
Simple Gap IndicatorTitle: Simple Gap Indicator
Description: This is a utility script designed to automate the tracking and management of price gaps (also known as "Windows") on the chart. Unlike static drawings, this indicator dynamically monitors open gaps and automatically "closes" them (stops drawing) once price has filled the area, keeping your chart clean and focused on active levels only.
Why Use This Tool? Traders often mark gaps manually, but charts quickly become cluttered with old, invalid levels. This script solves that problem by using an array-based management system to track every open gap in real-time and remove it the moment it is invalidated by price action.
Technical Methodology:
Gap Detection: The script identifies "Full Gaps" where the Low of the current candle is higher than the High of the previous candle (Bullish), or vice versa (Bearish). This indicates a total disconnect in price delivery.
Dynamic Filtering:
ATR Filter: Users can filter out insignificant "noise" gaps by setting a minimum size threshold based on the Average True Range (ATR).
Time Filter: Option to restrict gap detection to specific session hours (e.g., ignoring overnight gaps on 24h charts).
Auto-Closure: The script loops through all active gaps on every new bar. If the current price wick touches an open gap, the box is visually terminated at that specific bar index and removed from the tracking array.
Visuals:
Green Box: Bullish Gap (Support Zone).
Red Box: Bearish Gap (Resistance Zone).
Labels: Optional text displaying the precise Top/Bottom price coordinates of the gap.
How to Use:
Enable "Auto-Close Gap on Retest" to keep your chart clean.
Use the ATR Filter if you are getting too many signals on lower timeframes (e.g., set to 0.5x ATR).
Set alerts for "New Gap" or "Gap Filled" to automate your workflow.
Credits: Calculations based on standard Gap/Window price action theory. Array management logic custom-coded for Pine Script v6.

Custom RSI + Divergence + Bold Lines (v6, matched)📌 Custom RSI with Divergence & Dynamic Coloring
This indicator enhances the classic Relative Strength Index (RSI) by combining
dynamic visual feedback with automatic regular divergence detection.
It is designed to help traders quickly identify overbought / oversold conditions
and potential momentum shifts through clear and intuitive visualization.
⸻
🔍 Key Features
1️⃣ Dynamic RSI Line Coloring
• Overbought zone (RSI > Overbought level) → RSI line turns green
• Oversold zone (RSI < Oversold level) → RSI line turns red
• Neutral zone → RSI line remains white
This allows instant recognition of the current RSI state.
⸻
2️⃣ Overbought / Oversold Visual Highlighting
• Clear overbought and oversold reference lines
• Background shading when RSI enters these zones
→ improves signal visibility and reaction speed
⸻
3️⃣ Automatic Regular Divergence Detection
• Bullish Divergence
• Price makes a lower low
• RSI makes a higher low
• Pivot lows are connected with a bold green line
• Bearish Divergence
• Price makes a higher high
• RSI makes a lower high
• Pivot highs are connected with a bold red line
Pivot points are connected directly, making divergence structures easy to identify at a glance.
⸻
4️⃣ Clear Signal Markers
• Bullish divergence: ▲ (bottom of the RSI pane)
• Bearish divergence: ▼ (top of the RSI pane)
⸻
⚙️ Inputs
• RSI Length
• Overbought / Oversold Levels
• Pivot Length (controls divergence sensitivity)
⸻
💡 How to Use
• Oversold + Bullish Divergence → Potential rebound setup
• Overbought + Bearish Divergence → Potential pullback or reversal
• Best used in combination with trend analysis, support/resistance, and volume
⸻
⚠️ Notes
• Divergence signals are probabilistic, not guaranteed.
• In ranging markets, divergences may appear more frequently.
• Always apply proper risk management.
⸻
🎯 Best For
• Traders who actively use RSI
• Traders looking for clean and intuitive divergence visualization
• Users who prefer minimal but informative indicators

POI Zones with Imbalance- Ahmed AwadHighlights Point of Interest (POI) zones on the chart where a significant price imbalance occurs between the candle’s open and close. The indicator draws semi-transparent orange zones to mark potential buy or sell areas, helping traders spot strong price moves and key levels. Adjustable imbalance threshold and transparency for flexibility.
