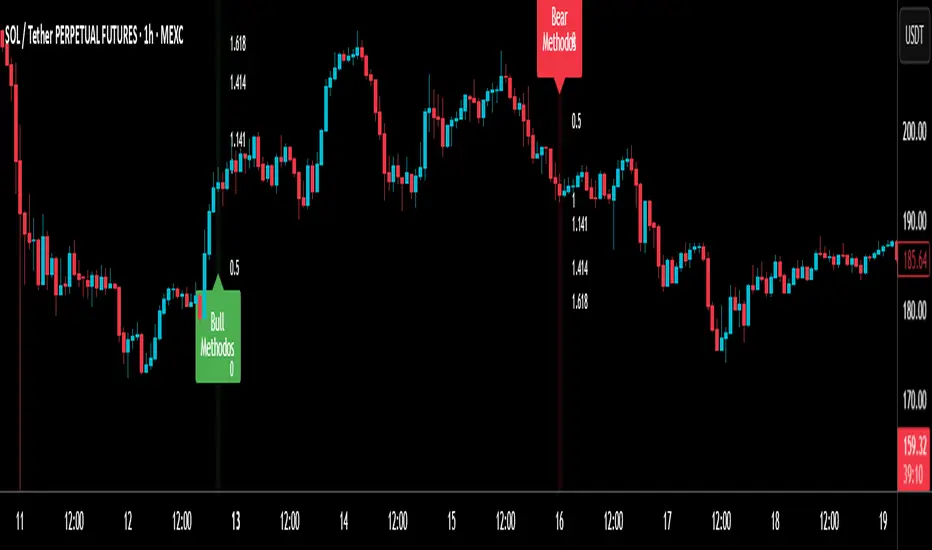
RSI MethodosThe RSI Methodos is a simple RSI-based indicator that generates rare but strong signals: Bull Methodos for bullish opportunities and Bear Methodos for bearish ones. It displays labels, background highlights, and alerts for easy use, plus optional Fibonacci labels for key levels. Ideal for swing trading in trending markets!
Centered Oscillators
ADX Trend Color HistogramOverview:
This script provides a visually enhanced version of the classic Average Directional Index (ADX) indicator. Instead of a simple line, it plots the ADX as a histogram, making it easier to gauge trend strength at a glance. The key feature is its dynamic color-coding, which shifts based on the relationship between the Directional Indicators (DI+ and DI-), offering immediate insight into market momentum.
Features:
Histogram Style: The ADX value is presented as a histogram for clear, easy-to-read visualization of trend strength.
Dynamic Color-Coding: The histogram bars are colored green when DI+ is greater than DI-, indicating bullish momentum. They turn red when DI- is greater than DI+, signaling bearish momentum.
Customizable Transparency: The default color transparency is set to 80% (20% opacity) for a clean look that doesn't overpower the main chart, but this can be adjusted in the script's color settings.
Built-in Alerts: The script includes configurable alerts that trigger whenever the momentum shifts, i.e., when the color of the histogram changes from red to green or vice-versa. This allows you to stay notified of potential changes in trend direction without constantly watching the chart.
Clean and Simple: The code is well-structured and commented for clarity, making it easy for other PineScripters to understand or modify.
How to Use:
Assess Trend Strength: The height of the histogram bars represents the strength of the current trend. Higher bars suggest a stronger trend (either bullish or bearish), while lower bars indicate a weak or non-trending market.
Identify Momentum Direction: The color of the bars provides a quick guide to the direction of market momentum.
Green Bars: Indicate that the upward momentum is dominant.
Red Bars: Indicate that the downward momentum is dominant.
Use Alerts for Signals: Set up alerts in TradingView based on the "ADX Green" and "ADX Red" conditions to receive notifications for potential entry or exit signals when the momentum shifts. A change from red to green can signal a potential bullish reversal or continuation, while a change from green to red can signal a bearish one.

CCI Oscillator by Edwin K What You’re Seeing
Green line (CCI) = fast line → reacts quickly to price momentum.
Blue line (SMA8) = slow line → smooths out the CCI, like a trend guide.
The two lines oscillate around each other**, just like the **Stochastic %K and %D**.
Trading Signals
Buy (Long) Signal
When the green CCI crosses ABOVE the blue SMA line.
Confirms that momentum is shifting bullish.
Look for:
The cross happening below 0 (oversold zone) = stronger buy.
Candle confirmation on the main chart (e.g., bullish candle or support area).
Enter a long trade or scale into buys.
Sell (Short) Signa
When the green CCI crosses BELOW the blue SMA8 line.
Confirms that momentum is turning bearish.
Stronger if it happens above 0 (overbought zone).
Enter a **short** trade or take profits on longs.
Optional Filters
You can improve accuracy by:
Trading in the direction of a higher-timeframe trend (e.g., only take buy crosses when price is above the 50 EMA).
Ignoring whipsaws when both lines are flat near 0— that means low momentum.

MACD Remastered [CHE]MACD Remastered — Robust MACD with confirmed pivot-based divergence, optional signal bands, and ready-to-use alerts.
Summary
This indicator augments classic MACD with a robust, confirmed pivot-based divergence engine and an optional signal channel using Bollinger Bands. Divergence signals are only produced after a pivot is confirmed, which reduces noise from transient swings. A line-of-sight clearance check filters cases where the MACD histogram path contradicts the divergence, further cutting false flags. Histogram coloring clarifies momentum changes, while optional triangles project the same signals onto the main chart for quick context.
Motivation: Why this design?
Standard MACD divergence tools tend to fire early in volatile phases and flip during consolidation. The core idea here is to delay decision points until a pivot is confirmed and to validate the path between pivots. This addresses fake flips and improves signal credibility at the cost of some latency. Optional bands around the Signal line add context about compression and expansion without altering MACD’s core behavior.
What’s different vs. standard approaches?
Reference baseline: Classical MACD (fast and slow moving averages, Signal line, histogram) with simple divergence checks.
Architecture differences:
Confirmed pivot logic with left and right bars.
Line-of-sight clearance test across the histogram path between pivots.
Optional Signal-line Bollinger Bands with configurable length and width.
Composite “Any Divergence” alert plus separate regular and hidden alerts.
Optional main-chart triangles using forced overlay for at-a-glance context.
Practical effect: Fewer early or contradictory divergence signals, clearer momentum context via histogram colors and a visible Signal channel during compression and expansion.
How it works (technical)
The MACD line derives from a fast and a slow moving average on a chosen source. The Signal line smooths the MACD line using a selected moving average type and length. The histogram is the difference between MACD and Signal and is colored by direction and acceleration.
Divergence uses confirmed pivots: a pivot forms only after a set number of bars on the right side, so the event is locked in. The engine retrieves the last two relevant pivots and checks price movement versus the MACD histogram movement to classify regular or hidden divergence. A line-of-sight clearance routine traverses the histogram path between the two pivots and rejects the signal if the path invalidates the directional relationship. When enabled, Bollinger Bands are plotted around the Signal line; width scales with standard deviation. Programmatic alerts fire only on confirmed bars. No higher-timeframe requests are used.
Parameter Guide
Oscillator MA Type — Sets fast and slow MA family for MACD. Default: EMA. Tip: EMA is more responsive; SMA is steadier.
Fast Length — Fast MA period. Default: 12. Trade-off: Shorter is quicker but noisier.
Slow Length — Slow MA period. Default: 26. Trade-off: Longer reduces noise but adds lag.
Source — Price input. Default: Close. Tip: Use a stable source for consistency.
Signal MA Type — Moving average family for Signal. Default: EMA.
Signal Length — Smoothing of MACD into Signal. Default: 9. Trade-off: Longer smooths more, reacts slower.
Calculate Divergence — Enables divergence engine. Default: True.
Enable Bollinger Bands on Signal — Adds bands around Signal. Default: False.
BB Length — Sampling window for bands. Default: 20. Active: Only when bands are enabled.
BB StdDev — Band width in standard deviations. Default: 2.0. Bounds: between about zero point zero zero one and fifty.
Pivot Left / Pivot Right — Bars to the left and right that define a confirmed pivot. Default: five and five. Trade-off: Larger values mean stronger but slower pivots.
Min / Max Bars Between Pivots — Valid window between two pivots. Default: five and sixty. Tip: Increase minimum to reduce micro-divergences.
Detect Hidden — Include hidden divergence. Default: True.
Draw Lines — Draw connector lines on the MACD pane. Default: True.
Alerts: Enable / Regular / Hidden / Frequency / Prefix — Control alert emission, categories, cadence, and label. Defaults: Enabled, both categories on, once per bar close, prefix “MACD RM”.
Reading & Interpretation
Histogram: Columns above zero reflect positive momentum; below zero reflect negative momentum. Color shifts indicate momentum increasing or decreasing within each side.
MACD and Signal: Crosses and distance indicate momentum shifts and strength. When bands are enabled, touches and departures hint at compression and expansion around the Signal.
Divergence: Solid green lines and labels indicate regular bullish; solid red indicate regular bearish. Dashed teal and dashed orange denote hidden bullish and hidden bearish. Triangles on the main chart mirror these events for quicker visibility.
Practical Workflows & Combinations
Trend following: Use histogram color transitions with a structure filter such as higher highs and higher lows for long bias, or lower highs and lower lows for short bias. Divergence against the prevailing structure suggests caution or partial exits.
Exits and risk: In a long, regular bearish divergence near resistance can justify scaling out or tightening stops. Hidden divergence in the trend direction can support continuation but should not replace risk controls.
Multi-asset / Multi-timeframe: Works across liquid futures, forex, indices, and large-cap equities. Start with defaults on four-hour and daily; shorten lengths on intraday only when liquidity is strong.
Behavior, Constraints & Performance
Repaint and confirmation: Signals are anchored only after the right-side pivot bars complete; alerts trigger on confirmed bars. This intentionally adds latency to reduce noise.
No higher-timeframe requests: No `security` calls are used; repaint risk is primarily tied to live bars before confirmation.
Resources: Declared `max_bars_back` is five hundred. The divergence path check iterates between pivots, bounded by the maximum bars parameter. Line objects may accumulate; limits are set for lines and labels.
Known limits: Latency at sharp turns, potential misses during fast single-bar reversals, and sensitivity to extremely choppy sessions if minimum gap between pivots is set too low.
Sensible Defaults & Quick Tunin g
Starting point: EMA, twelve and twenty-six with Signal nine; pivots five and five; minimum five, maximum sixty; alerts on close; bands off.
Too many flips: Increase Signal length, raise pivot counts, and increase minimum bars between pivots. Consider disabling hidden divergence.
Too sluggish: Reduce pivot counts, lower Signal length, and enable bands to visualize early compression.
Cluttered chart: Keep lines off and rely on labels and main-chart triangles. Use the alert prefix to route events cleanly.
What this indicator is—and isn’t
This is a visualization and signal layer for MACD with confirmed, path-checked divergence and optional Signal bands. It is not a trading system, not predictive, and not a position management framework. Use it together with structure analysis, liquidity context, and explicit risk controls.
Disclaimer
The content provided, including all code and materials, is strictly for educational and informational purposes only. It is not intended as, and should not be interpreted as, financial advice, a recommendation to buy or sell any financial instrument, or an offer of any financial product or service. All strategies, tools, and examples discussed are provided for illustrative purposes to demonstrate coding techniques and the functionality of Pine Script within a trading context.
Any results from strategies or tools provided are hypothetical, and past performance is not indicative of future results. Trading and investing involve high risk, including the potential loss of principal, and may not be suitable for all individuals. Before making any trading decisions, please consult with a qualified financial professional to understand the risks involved.
By using this script, you acknowledge and agree that any trading decisions are made solely at your discretion and risk.
Do not use this indicator on Heikin-Ashi, Renko, Kagi, Point-and-Figure, or Range charts, as these chart types can produce unrealistic results for signal markers and alerts.
Best regards and happy trading
Chervolino

Liquidity Regime OscillatorThe Liquidity Signal Line is a macro-driven confirmation tool designed to capture the underlying global liquidity regime in a single, smoothed oscillator. It measures the combined directional flow of monetary and financial conditions using high-impact macro data: Federal Reserve assets (WALCL), Treasury General Account (TGA), and the Overnight Reverse Repo facility (RRP) – adjusted by key market proxies such as the U.S. Dollar Index, credit spreads (HYG/LQD), and equity risk appetite (SPHB/SPHQ). These components are normalized, weighted, and then double-smoothed into a stable signal that translates complex liquidity dynamics into a simple 0–100 scale.
Liquidity expansion provides fuel for risk assets, while contraction drains leverage and risk appetite. The Signal Line acts as a confirmation overlay for trend and allocation strategies, showing whether systemic liquidity is broadly supportive or restrictive. Readings above 50 indicate an expansionary environment (risk-on bias), below 50 a contractionary one (risk-off bias). Because the calculation uses higher-timeframe macro data, it can be displayed on any chart to give traders a consistent, regime-aware signal that bridges macro policy and technical execution.

Ultimate MACD Suite [BigBeluga]🔵 OVERVIEW
The Ultimate MACD Suite is an advanced momentum-based system that enhances the classic MACD with modern features tailored for professional traders.
It transforms MACD into a full market-decision engine — offering multi-timeframe confluence, adaptive histogram behavior, divergence detection, heatmap trend visualization, and actionable reversal signals.
This toolkit goes far beyond standard MACD, helping traders identify trend momentum shifts, exhaustion zones, high-probability reversal areas, and breakout confirmation signals across multiple timeframes simultaneously. It's to be used as part of a major trading system and to simplify usage of the MACD.
⚠️ Note:
This is not a traditional MACD — it uses normalized values , enhanced visual feedback, and a multi-timeframe dashboard engine for superior signal quality and clarity.
🔵 CONCEPTS
Combines MACD momentum, signal-line crossovers, and histogram reversals into one system
Uses normalized scaling to detect extreme momentum levels and exhaustion zones
Multi-timeframe dashboard displays consensus signal alignment across several timeframes
Divergence engine identifies bullish & bearish trend weakening early
Heatmap mode visually distinguishes strong trend phases from neutral or fading momentum
Reversal arrows & crosses highlight actionable turning points on chart
🔵 FEATURES
Normalized MACD Engine — improves signal clarity across all assets/timeframes
MACD Heatmap Mode — color-coded slope intensity for trend strength monitoring
MACD Rising and Falling Mode — color-coded rising and falling MACD regimes
Histogram Reversal Detection — early momentum fade signal before price turns
Signal-Line Momentum Shifts — bullish ▲ & bearish ▼ alerts on cross-confirmation
Overbought/Oversold Bands — enhanced visual thresholds at ±80 levels
Smart Divergence Detection (Non-Lag) — confirms regular bullish & bearish divergences
Multi-Timeframe Dashboard — MACD, signal, histogram & divergence signals across 5+ TFs
Reversal Push-Filter — ensures only clean signals after confirmed momentum inflection
On-Chart Reversal Labels — optional compact signal markers for clean visual execution
Histogram Color Logic — rising/falling or heatmap mode for deeper momentum reading
🔵 HOW TO USE
Look for MACD crossing above signal + green histogram to confirm bullish momentum
Use ▼ and ▲ arrows to catch confirmed momentum reversals
Monitor the dashboard — the more timeframes align, the stronger the setup
Watch divergences for trend exhaustion or reversal setups
Treat histogram trend shifts as early momentum clues before price reacts
Use ±80 levels to identify overheated conditions & fade opportunities
Combine with structure, volume, or BigBeluga liquidity tools for higher accuracy
🔵 ALERTS
The indicator includes a full alert suite for automation and real-time trade readiness:
MACD crossovers (Bullish / Bearish)
Histogram reversals & zero-line shifts
Bullish / Bearish divergence detection
Overbought / Oversold MACD alerts
Bullish ▲ and bearish ▼ reversal triggers
Use these alerts to automate signal monitoring or feed algorithmic systems.
🔵 CONCLUSION
The Ultimate MACD Suite transforms a classic indicator into a powerful trading engine.
With multi-timeframe alignment, heatmapping, divergence logic, normalized scaling and automated signals, it becomes an elite momentum-confirmation and reversal-timing system built for serious traders.
Whether scalping intraday or managing swing positions, this MACD engine helps identify the most profitable phases of trend movement — while warning early when a trend is weakening.
Paid script

CCI by Edwin KWhat it shows
The indicator measures momentum strength and extremes using the Commodity Channel Index (CCI) and colors zones and histograms so you can instantly see when the market is overbought, oversold, or shifting direction.
How to read it
Blue line:** The CCI value (main signal).
Colored histogram: Momentum direction
Green shades = momentum rising (bullish)
Red shades = momentum falling (bearish)
Background zones:
Purple = extreme overbought/oversold (±200 → possible reversal zone)
Yellow = transition warning (momentum turning from extreme)
Gray/neutral = mild momentum (+/−80 to ±150 range)
How to trade it
1. Trend trades (momentum):**
When CCI rises above +80, momentum is turning bullish → look for buys.
When CCI drops below −80, momentum is turning bearish → look for sells.
Stay in the trade while the histogram keeps the same color direction.
2. Reversal trades (mean reversion):**
When a **yellow bar** appears, it means CCI just bounced out of an extreme zone (like from below −200 to above −150).
→ This often signals an upcoming price reversal.
A yellow bar after an extreme can be an early warning to take profit or look for the opposite setup.

Market Profit X (MPX)Hi Traders,
Welcome to Market Profit X (MPX)
Keep
It
Simple
Stupid
I have created MPX to give a main screen visual with simple easy Buy/Sell signals based on your favorite wave trend oscillators.
Traders' learners through to advanced will and I say will PROFIT using MPX easy to follow system.
The 12: Tema and 56: Tema are utilized umm yeah that's right the same ones you are paying thousands for 56 Tema giving you your baseline or zero line on the common Wave Trend Oscillator and the 12 Tema giving you that momentum where all chasing.
One thing after years of studying what really is the bread and butter? Money money money that's what matters money flowing in money flowing out Long/Short yeah. So that's what your BUY/SELL signals are based on and they work.
I have added ATR for stops and have found after extensive trials setting multiplier to 2.5 you are going to have a high % of winning trades which you can thank me with i will send my BTC wallet Addy.
I have added the 8 EMA for another extremely rewarding swing system that i may share with my crew or people I like. I hear you already 8 EMA yeah right that's old worth nothing well it's what I do with this is the magic.
So how do I use? i can see the DM box filling up now because i have been reluctant to release this simple little indicator because i trialed it put in hard yards and know it's a banger.
first one i share and if i get no donations i take down because i know you will be hitting home runs.
Top-down analysis first are we bull or bear? then i drop to the 30m or 15m and wait for BUY/SELL signal go to your favorite wave trend oscillator i have mine over at Marketspy.com and take a good look at your money flow. I will wait for candle to close and confirm then buy next candles open or drop down to the 5m for slight pullback for entry.
Tip one: I like to buy 60 or -60 levels with confidence what will catch you reg bear divs.
like everything not every signal a home run that's why as soon as you take the trade you are looking at your stop and setting it in stone if you get hit o well onto the next. What's your number one? protecting your bank.
Now like i said the 8EMA system is a special spice i may share with special people as it requires training.
Enjoy tell me i suck i don't care i know it works and makes consistent money and my trading group guys will vouch for me.
Thank you, Trader (IKN) I Know Nothing out.

Twisted Analytics ATR Model ProThe Trend Spotter Indicator is a sophisticated technical analysis tool engineered to identify high-probability trend formations across all timeframes and asset classes. Built with proprietary algorithms, this indicator combines multiple technical methodologies to deliver clear, actionable signals for traders at all experience levels.
What Makes It Unique
Unlike basic moving average systems, the Trend Spotter employs a multi-layered approach that validates trends through:
Multi-Timeframe Analysis: Confirms signals across higher timeframes to filter false positives
Adaptive Volatility Filtering: Adjusts thresholds based on ATR to optimize for both ranging and trending markets
Momentum Confirmation: Validates trend strength using proprietary oscillators before generating signals
Dynamic Trend Strength Measurement: Real-time assessment of trend intensity and potential exhaustion
Key Features
✅ Universal Compatibility: Works seamlessly on crypto, stocks, forex, commodities, and indices
✅ No Repainting: Signals remain fixed once generated - reliable for backtesting and live trading
✅ Customizable Alerts: Set up notifications for trend reversals, breakouts, and momentum shifts
✅ Visual Clarity: Color-coded signals with adjustable display settings
✅ Smart Noise Filtering: Advanced algorithms eliminate market noise and focus on genuine trends
✅ Support/Resistance Detection: Automatically identifies key levels based on trend structure
How It Works
The indicator analyzes price action through four independent validation layers:
Trend Identification: Detects higher highs/lows (uptrend) or lower highs/lows (downtrend)
Momentum Confirmation: Ensures signals align with prevailing momentum
Volatility Analysis: Adapts to changing market conditions using ATR-based thresholds
Signal Validation: Cross-references multiple factors before generating final signals
This multi-factor approach significantly reduces false signals by requiring confirmation from multiple independent analysis methods.
Best Use Cases
Trend Following: Ride major trends from early entry to exhaustion
Breakout Trading: Catch strong momentum moves out of consolidation
Reversal Trading: Identify trend exhaustion and potential reversals
Multi-Timeframe Strategies: Confirm lower timeframe entries with higher timeframe trends
Who Should Use This
Day traders seeking reliable trend signals on intraday charts
Swing traders looking for multi-day trend opportunities
Position traders wanting to identify major trend changes
Both beginner and professional traders who value data-driven decision making
Configuration Flexibility
The indicator offers extensive customization options:
Trend Period: Adjust sensitivity from 5 to 200 bars
Signal Sensitivity: Choose Low/Medium/High based on trading style
Trend Strength Threshold: Filter weak trends (0-100 scale)
Multi-Timeframe Mode: Enable/disable higher timeframe confirmation
Visual Settings: Customize colors, signal size, and labels
Trading Strategy Examples
Trend Following: Enter on initial signal, add on pullbacks, exit on reversal
Breakout Strategy: Wait for consolidation, enter on trend signal breakout
Reversal Strategy: Identify exhaustion, enter on first opposite signal
Scalping: Use high sensitivity on 1-15 min charts for quick trades
Risk Management Note
While the Trend Spotter provides high-probability signals, no indicator guarantees profits. Always use proper risk management:
Risk only 1-2% of capital per trade
Set stop-losses based on technical levels
Combine with volume analysis and support/resistance
Backtest settings on historical data before live trading
What You Get
Professional-grade trend detection algorithm
Real-time signal generation with no lag
Comprehensive parameter customization
Visual clarity with intuitive color coding
Compatible with all TradingView account types
Ongoing updates and improvements
Technical Specifications
Calculation Method: Proprietary multi-factor analysis
Signal Type: Non-repainting trend direction and strength
Overlay: Yes - displays directly on price chart
Alerts: Fully customizable alert conditions
Timeframes: All timeframes from 1-minute to monthly
Asset Classes: Universal - works on all tradable instruments
Support
Published by Twisted Analytics - Professional trading tools built by traders, for traders.

xontrades1uae Iiquidity Money | by Bu-Rashid
This indicator detects potential institutional exit points and reversal zones using a powerful confluence model combining:
Volume spike analysis (institutional activity)
CVD trend flips (smart money flow reversal)
Price–CVD divergence (hidden accumulation/distribution)
Liquidity sweep detection (stop-run exhaustion)
When these elements align, the indicator highlights possible Exit Flow zones, signaling where smart capital may be closing or reversing positions.
It’s optimized for XAU/USD (Gold) and NAS100 (Nasdaq) on 5-minute and 15-minute charts, with customizable strictness for traders who prefer early or confirmed signals.
Recommended use:
Apply as a confirmation layer alongside your main strategy to identify exhaustion points and institutional exits before trend reversals.
— Developed and engineered by Bu-Rashid (XonTrades1UAE)

CipherThis indicator identifies potential reversal points through volume exhaustion analysis combined with multi-factor confirmation, volume distribution patterns at price extremes, market state classification based on volatility characteristics, and time-weighted probability calculations. Each component reduces false signals that single-factor indicators typically produce.
METHODOLOGY:
The system continuously monitors market conditions across multiple dimensions. When volume patterns indicate potential exhaustion at significant price levels, it checks for alignment with favorable market conditions and statistical probabilities. Signals only generate when multiple factors confirm, with entry triggered on momentum continuation beyond the exhaustion point.
COMPLETE USAGE GUIDE:
Signal Identification:
- "EXH L+2" = Long exhaustion with 2 confirmations
- "EXH S+3" = Short exhaustion with 3 confirmations
- Higher confirmation numbers indicate stronger setups
Entry Execution:
- Dashed lines mark entry trigger levels
- Entry activates when price breaks trigger within specified bar window
- Buffer setting controls distance from exhaustion bar (ticks)
Position Management:
- Automatic stop loss and target levels display on entry
- Green lines = profit targets
- Red lines = stop loss levels
- Info panel shows real-time position status
CONFIGURABLE PARAMETERS:
Timing Controls:
- Entry Buffer: 0-5 ticks (momentum confirmation distance)
- Max Bars to Wait: 3-10 bars (entry window duration)
- Session Times: Separate London/New York parameters
Sensitivity Settings:
- Volume Multiplier: 1.5-3.0 (vs 20-bar average)
- Lambda Values: Setup frequency expectations per session
- Stop Distances: Session-specific risk parameters
Risk Controls:
- Daily Win Limit: Stops after profitable day
- Daily Loss Limit: Prevents excessive drawdown
- Maximum Daily Trades: Controls overtrading
PERFORMANCE OPTIMIZATION:
Best Trading Windows:
- 10:00 AM EST: Primary reversal window
- 9:30-9:45 AM EST: Opening range exhaustion
- 3:00-4:00 AM EST: European session setups
- 2:30 PM EST: Afternoon reversal potential
Session Characteristics:
- London (2-9 AM EST): Lower frequency, cleaner setups
- New York (9 AM-4 PM EST): Higher frequency, requires filtering
- Background colors indicate active sessions
RISK PARAMETERS:
- Default Stops: 30-40 ticks (session-dependent)
- Risk:Reward Ratios: 1:1.5 to 1:3 (configurable)
- Trade Frequency: 2-4 quality setups weekly
VISUAL REFERENCE:
- Orange Background: London session active
- Blue Background: New York session active
- Yellow Markers: Exhaustion points identified
- Dashed Lines: Pending entry levels
- Solid Lines: Active trade levels
- Info Table: Statistics and system status
IMPORTANT CONSIDERATIONS:
This tool identifies potential setups based on rule-based analysis. Traders should understand that no system guarantees profits and should use appropriate risk management. The indicator works best on 3-minute and 5-minute timeframes in liquid markets. Combine with market context and price action understanding for optimal results.
TECHNICAL REQUIREMENTS:
- Best suited for index and commodites
- Optimized for 3M and 5M
- Requires volume data for proper function
- Best results with consistent market participation

Volume Weighted Price OscillatorThis indicator calculates the Percentage Price Oscillator (PPO), a momentum oscillator similar to the MACD. It displays the distance between two moving averages as a percentage, making it comparable across different assets. This implementation enhances the PPO with optional volume weighting and a built-in divergence engine.
Key Features:
Customizable MA & Volume Weighting: Both the fast and slow moving averages (and the signal line) can be customized using different MA types (e.g., EMA, SMA, WMA). An option (Volume weighted) applies volume weighting to all three MAs.
MACD-Style Display: Provides the three core components: the PPO line (momentum), a signal line (trigger), and a histogram (momentum acceleration). The histogram is color-coded to show increasing or decreasing momentum.
Full Divergence Suite (Class A, B, C): A built-in divergence engine automatically detects and plots all three major divergence classes between price and the PPO line:
Regular (A): Signals potential trend reversals.
Hidden (B): Signals potential trend continuations.
Exaggerated (C): Signals weakness at double tops/bottoms.
Divergence Filtering and Visualization:
Price Tolerance Filter: Divergence detection is enhanced with a percentage-based price tolerance (pivPrcTol) to filter out insignificant market noise.
Persistent Visualization: Divergence markers are plotted for the entire duration of the signal and are visually anchored to the PPO level of the confirming pivot.
Note on Confirmation (Lag): Divergence signals rely on a pivot confirmation method to ensure they do not repaint.
The Start of a- divergence is only detected after the confirming pivot is fully formed (a delay based on Pivot Right Bars).
The End of a divergence is detected either instantly (if the signal is invalidated by price action) or with a delay (when a new, non-divergent pivot is confirmed).
Multi-Timeframe (MTF) Capability:
MTF PPO Lines: The PPO, signal line, and histogram can be calculated on a higher timeframe, with standard options to handle gaps (Fill Gaps) and prevent repainting (Wait for...).
Limitation: The Divergence detection engine (pivDiv) is disabled if a timeframe other than the chart's timeframe is selected. Divergences are only calculated on the active chart timeframe.
Integrated Alerts: Includes 18 comprehensive alerts for:
The start and end of all 6 divergence types.
The PPO line crossing its signal line.
The PPO line crossing the zero line.
The histogram changing direction (reverting).
DISCLAIMER
For Informational/Educational Use Only: This indicator is provided for informational and educational purposes only. It does not constitute financial, investment, or trading advice, nor is it a recommendation to buy or sell any asset.
Use at Your Own Risk: All trading decisions you make based on the information or signals generated by this indicator are made solely at your own risk.
No Guarantee of Performance: Past performance is not an indicator of future results. The author makes no guarantee regarding the accuracy of the signals or future profitability.
No Liability: The author shall not be held liable for any financial losses or damages incurred directly or indirectly from the use of this indicator.
Signals Are Not Recommendations: The alerts and visual signals (e.g., crossovers) generated by this tool are not direct recommendations to buy or sell. They are technical observations for your own analysis and consideration.

EMA Bounce · CCI + MACD Filters - By author (PDK1977)3 EMA Bounce – Dual-Stack Edition by PDK1977
Script is inspired by this youtube strategy by Trading DNA
www.youtube.com
A price-action tool that spots “kiss-and-rebound” moves off fast / mid / slow EMAs, with separate buy- and sell-stacks.
Signals are cleared through CCI and MACD filters for confidence, an optional slow-EMA trend filter, and a spacing rule to reduce noise.
Plots 3 or 6 color-coded EMAs directly on the chart (if buy and sell is equal only 3 lines) and paints compact BULL (lime) / BEAR (red) triangles at qualifying bars for buy and sell.
ADJUST EMA as explained in the video for YOUR choosen assets and learn to use EMA correct on each assets.
Disclaimer: this script is provided strictly for educational purposes; the author accepts no liability for any trading decisions made with it.
Have fun!
Best regard Patrick

CandelaCharts - Oscillator Concepts 📝 Overview
Oscillator Concepts shows a single, easy‑to‑read line on a scale from −1 to +1 . Near 0 means balance; beyond +1 or −1 means the move is stretched. You can add helpful layers like trend stripes, participation shading, volatility markers, calendar dividers, divergence tags, and simple signal markers. Pick a trading profile (Scalping / Day Trade / Swing / Investment) and the lengths update for you.
📦 Features
A quick tour of the visual layers you can enable. Use this to decide which parts to turn on for reading momentum, extremes, trend bias, participation, and volatility at a glance.
The Line (−1…+1) : A clean momentum read with an optional EMA smooth and clear 0 / ±1 guides.
OS/OB Visualization : Soft gradient fills when price action pushes outside ±1; optional background shading for quick scanning.
Trend Radar : Thin stripes just outside the band that show up‑ or down‑bias using a fast‑vs‑slow EMA spread with anti‑flicker logic.
Participation : Shading that reflects who’s pushing — by MFI, classic up/down volume, delta volume, or a combo model that rewards agreement.
Velocity Pulse : Tiny symbols that only appear when volatility is elevated (outside a neutral 40–60 zone).
Fractal Map : Subtle dashed dividers at Daily / Weekly / Monthly / Yearly / 5‑Year boundaries (Auto picks a sensible cadence).
Divergences : Regular bullish/bearish tags at pivots, with an optional high‑probability filter.
Unified Signals : One common vertical level for triangles (OS/OB re‑entries) and divergence icons so your eye doesn’t hunt.
Profiles : Four presets tune all lookbacks together so the tool stays consistent across timeframes.
Themes : Multiple palettes or fully custom bear/mid/bull colors.
Alerts : Ready for “Any alert() function call” with OS/OB and Divergence options.
⚙️ Settings
Every adjustable input in plain English. Set your profile, show or hide reference levels, pick a theme, and toggle components so the visuals match your style and timeframe.
Trading Profile : Scalping / Day Trade / Swing / Investment — automatically adjusts core lengths.
−1…+1 Levels : Show reference lines at ±1.
Smoothing & Length : EMA smoothing for The Line.
OS/OB Zones & Show Fill : Optional background shade plus gentle gradient fills beyond ±1.
Theme : Presets (Default, Blue–Orange, Green–Red, Teal–Fuchsia, Aqua–Purple, Black–Green, Black–White) or Custom .
Divergences : Turn on detection at pivot highs/lows. Length sets left/right bars. HP filter asks that at least one oscillator anchor sits outside ±1.
Participation : Choose MFI , Volume , Delta Volume , or MFI + Vol + Delta . Set the window; optionally smooth it.
Trend Radar : Up or down stripes just beyond ±1 based on a fast/slow EMA spread. Tune Fast and Slow .
Velocity Pulse : Symbols appear only when volatility exits the 40–60 zone; use Fast / Slow to adjust sensitivity.
Fractal Map : Vertical dividers at time boundaries. Auto selects per timeframe, or pick Daily / Weekly / Monthly / Yearly / 5 Years .
Signals : Show All , only OS/OB , or only Divergence markers (shared height for quick scanning).
Alerts - OS/OB Conditions : Fire when The Line enters extremes (crosses above +1 or below −1).
Alerts - OS/OB Signals : Fire when The Line re‑enters the band (comes back inside from > +1 or < −1).
Alerts - Divergence Conditions : Raw regular divergences right when the pivot forms (no HP filter).
Alerts - Divergence Signals : Confirmed regular divergences that pass the HP filter.
⚡️ Showcase
A visual gallery of the indicator's components. Each image highlights one layer at a time—The Line, OS/OB fills, Trend Radar, Participation, Velocity Pulse, Fractal Map, Divergences, and Signals—so you can quickly recognize how each looks on a live chart.
The Line
Participation
Trend Radar
Velocity Pulse
Fractal Map
Divergences
Signals
Overbought/Oversold
📒 Usage
Hands‑on guidance for reading the line, thresholds, and add‑ons in live markets. Learn when to favor continuation vs. mean‑reversion, how to weigh participation and volatility, and where to set invalidation and targets.
Scale : 0 = balance. ±1 = adaptive extremes. A push beyond ±1 isn’t an automatic fade — check trend stripes, participation, and volatility.
Trend vs Mean‑Revert : With bull stripes, favor pullback buys on OS re‑entries; with bear stripes, favor fades on OB re‑entries.
Participation : Strong positive shading supports continuation; weak/negative during new highs is a caution flag.
Volatility Pulse : Symbols only appear when energy is high. In trends they often mark expansion; counter‑trend they can precede snap‑backs.
Divergences : Raw is early; HP is selective. Treat HP as higher‑quality context, not a stand‑alone signal.
Risk : Use nearby structure (swing points, session highs/lows, or a fractal divider) for invalidation. Scale targets around 0 / ±1 and current vol.
Profiles : If entries feel late/early, try a different profile before hand‑tuning every length.
🚨 Alerts
What you can be notified about and how to turn it on. Covers entering extremes, re‑entries from extremes, and divergence detections, with a recommended schedule (once per bar close).
OS/OB Condition — Entered Overbought → when The Line moves up through +1.
OS/OB Condition — Entered Oversold → when The Line moves down through −1.
OS/OB Signal — Re‑Entry from Overbought/Oversold → when The Line comes back inside from an extreme.
Divergence Condition — Bullish/Bearish (raw) → printed as soon as a regular divergence is detected.
Divergence Signal — Bullish/Bearish (confirmed) → only fires when the high‑probability filter passes.
⚠️ Disclaimer
These tools are exclusively available on the TradingView platform.
Our charting tools are intended solely for informational and educational purposes and should not be regarded as financial, investment, or trading advice. They are not designed to predict market movements or offer specific recommendations. Users should be aware that past performance is not indicative of future results and should not rely on these tools for financial decisions. By using these charting tools, the purchaser agrees that the seller and creator hold no responsibility for any decisions made based on information provided by the tools. The purchaser assumes full responsibility and liability for any actions taken and their consequences, including potential financial losses or investment outcomes that may result from the use of these products.
By purchasing, the customer acknowledges and accepts that neither the seller nor the creator is liable for any undesired outcomes stemming from the development, sale, or use of these products. Additionally, the purchaser agrees to indemnify the seller from any liability. If invited through the Friends and Family Program, the purchaser understands that any provided discount code applies only to the initial purchase of Candela's subscription. The purchaser is responsible for canceling or requesting cancellation of their subscription if they choose not to continue at the full retail price. In the event the purchaser no longer wishes to use the products, they must unsubscribe from the membership service, if applicable.
We do not offer reimbursements, refunds, or chargebacks. Once these Terms are accepted at the time of purchase, no reimbursements, refunds, or chargebacks will be issued under any circumstances.
By continuing to use these charting tools, the user confirms their understanding and acceptance of these Terms as outlined in this disclaimer.

RSI + MFI + VolumeIndicator shows RSI + MFI + Volume in one panel, marks divergences separate for wicks and bodies, green dots shows where MFI and RSI are oversold
Smart Moving Average Dynamics [ChartNation]Smart Moving Average Dynamics (SMAD) — by Chart Nation
What it does:
SMAD maps how far price deviates from a chosen moving average and normalizes that distance into a bounded oscillator (−100…+100). It detects extreme expansions and prints non-repainting dots when the move exits an extreme. Price-level rails are drawn from those events (with optional fade/expiry) to highlight likely reaction zones. The MA line is colored by bias. A slim gauge summarizes the current oscillator percentile; a compact info panel shows TF, Trend, Volume rank, and Volatility rank.
How it works (high-level, closed-source)
Core signal: diff = price – MA(type, length) where MA can be SMA/EMA/RMA/WMA/VWMA.
Normalization (choose one):
Highest Abs (N): scales diff by the highest absolute excursion over N bars (fast, adaptive).
Z-Score: scales by stdev(diff, N) and maps ±σ to ±100 via a user factor.
ATR-Scaled: scales by ATR * k, relating deviation to current volatility.
Percent Rank: ranks the magnitude of |diff| over N bars and reapplies the original sign.
All methods clamp to −100…+100 to keep visuals consistent across assets/TFs.
Extremes & confirmation: Dots print only when an extreme exits ±100 (optionally on bar close) and can be filtered by linger bars and short-term slope flip, reducing one-bar spikes.
Rails: When an extreme confirms, a rail is anchored at the corresponding price swing and can soft-fade and/or expire after X bars.
Trend color: MA color = Up (green) when oscillator > threshold and MA slope > 0; Down (magenta) for the opposite; Neutral otherwise.
Context panels:
Slim Gauge: current oscillator bucket (0–20) with the exact normalized reading.
Info Panel: TF, Trend, and 0–100 percent-ranks of Volume and ATR-based volatility grouped as Low / Medium / High.
SMAD isn’t a collection of plots; it’s a single framework that integrates:
a deviation-from-MA engine,
four interchangeable normalization models (selected per market regime),
a gated extreme detector (linger + slope + confirm-on-close), and
time-aware rails with soft fade/expiry, presented with a minimal gauge and info panel so traders can compare regimes across TFs without recalibrating thresholds.
How to use (examples, not signals)
Mean-revert plays: When price exits an extreme and prints a dot, look for reactions near the new rail. Combine with your S/R and risk model.
Trend continuation: In strong trends the oscillator will spend more time above/below zero; the colored MA helps keep you aligned and avoid fading every push.
Regime switching: Try Percent Rank or ATR-Scaled on choppy/alts; Z-Score on majors; Highest Abs (N) when you want fastest adaptation.
Risk ideas: Rails can be used as partial-take or invalidate levels. Always backtest on your pair/TF.
Key settings
Normalization: Highest Abs / Z-Score / ATR-Scaled / Percent Rank (with N & factors).
Filters: Extreme threshold, linger bars, slope lookback, confirm on close.
Rails: Expire after X bars; soft-fade step.
Panels: Slim gauge (bottom-right), Info panel (middle-right).
Notes & limits
Prints confirm after the extreme exits ±100; nothing repaints retroactively.
Normalization can change sensitivity—choose the one matching your asset’s regime.

MACD (classic) + Divergences (wicks & bodies, fast/slow)macd with divergences. Wicks + bodies. Two settings for right bar

Relative Rotation - RRG JdK RS-Ratio & RS-MomentumThis indicator calculates the JdK RS-Ratio and RS-Momentum, which form the basis of Relative Rotation Graphs (RRG). It compares the performance of any asset against a benchmark (default: SPY) to identify the current RRG quadrant: LEADING, WEAKENING, LAGGING, or IMPROVING.
The RS-Ratio (red line) and RS-Momentum (green line) are plotted around a baseline of 100. The background color indicates the current quadrant, and an optional feature allows coloring chart candles based on the RRG phase.
Alerts can be configured to notify when the asset transitions between quadrants, helping traders identify rotational shifts in relative strength.

MACD HTF Hardcoded (A/B Presets) + Regimes [CHE] MACD HTF Hardcoded (A/B Presets) + Regimes — Higher-timeframe MACD emulation with acceptance-based regime filter and on-chart diagnostics
Summary
This indicator emulates a higher-timeframe MACD directly on the current chart using two hardcoded preset families and a time-bucket mapping, avoiding cross-timeframe requests. It classifies four MACD regimes and applies an acceptance filter that requires several consecutive bars before a state is considered valid. A small dead-band around zero reduces noise near the axis. An on-chart table reports the active preset, the inferred time bucket, the resolved lengths, and the current regime.
Pine version: v6
Overlay: false
Primary outputs: MACD line, Signal line, Histogram columns, zero line, regime-change alert, info table
Motivation: Why this design?
Cross-timeframe indicators often rely on external timeframe requests, which can introduce repaint paths and added latency. This design provides a deterministic alternative: it maps the current chart’s timeframe to coarse higher-timeframe buckets and uses fixed EMA lengths that approximate those views. The dead-band suppresses flip-flops around zero, and the acceptance counter reduces whipsaw by requiring sustained agreement across bars before acknowledging a regime.
What’s different vs. standard approaches?
Baseline: Classical MACD with user-selected lengths on the same timeframe, or higher-timeframe MACD via cross-timeframe requests.
Architecture differences:
Hardcoded A and B length families with a bucket map derived from the chart timeframe.
No `request.security`; all calculations occur on the current series.
Regime classification from MACD and Histogram sign, gated by an acceptance count and a small zero dead-band.
Diagnostics table for transparency.
Practical effect: The MACD behaves like a slower, higher-timeframe variant without external requests. Regimes switch less often due to the dead-band and acceptance logic, which can improve stability in choppy sessions.
How it works (technical)
The script derives a coarse bucket from the chart timeframe using `timeframe.in_seconds` and maps it to preset-specific EMA lengths. EMAs of the source build MACD and Signal; their difference is the Histogram. Signs of MACD and Histogram define four regimes: strong bull, weak bull, strong bear, and weak bear. A small, user-defined band around zero treats values near the axis as neutral. An acceptance counter checks whether the same regime persisted for a given number of consecutive bars before it is emitted as the filtered regime. A single alert condition fires when the filtered regime changes. The histogram columns change shade based on position relative to zero and whether they are rising or falling. A persistent table object shows preset, bucket tag, resolved lengths, and the filtered regime. No cross-timeframe requests are used, so repaint risk is limited to normal live-bar movement; values stabilize on close.
Parameter Guide
Source — Input series for MACD — Default: Close — Using a smoother source increases stability but adds lag.
Preset — A or B length family — Default: “3,10,16” — Switch to “12,26,9” for the classic family mapped to buckets.
Table Position — Anchor for the info table — Default: Top right — Choose a corner that avoids covering price action.
Table Size — Table text size — Default: Normal — Use small on dense charts, large for presentations.
Dark Mode — Table theme — Default: Enabled — Match your chart background for readability.
Show Table — Toggle diagnostics table — Default: Enabled — Disable for a cleaner pane.
Zero dead-band (epsilon) — Noise gate around zero — Default: Zero — Increase slightly when you see frequent flips near zero.
Acceptance bars (n) — Bars required to confirm a regime — Default: Three — Raise to reduce whipsaw; lower to react faster.
Reading & Interpretation
Histogram columns: Above zero indicates bullish pressure; below zero indicates bearish pressure. Darker shade implies the histogram increased compared with the prior bar; lighter shade implies it decreased.
MACD vs. Signal lines: The spread corresponds to histogram height.
Regimes:
Strong bull: MACD above zero and Histogram above zero.
Weak bull: MACD above zero and Histogram below zero.
Strong bear: MACD below zero and Histogram below zero.
Weak bear: MACD below zero and Histogram above zero.
Table: Inspect active preset, bucket tag, resolved lengths, and the filtered regime number with its description.
Practical Workflows & Combinations
Trend following: Use strong bull to favor long exposure and strong bear to favor short exposure. Use weak states as pullback or transition context. Combine with structure tools such as swing highs and lows or a baseline moving average for confirmation.
Exits and risk: In strong trends, consider exiting partial size on a regime downgrade to a weak state. In choppy sessions, increase the acceptance bars to reduce churn.
Multi-asset / Multi-timeframe: Works on time-based charts across liquid futures, indices, currencies, and large-cap equities. Bucket mapping helps retain a consistent feel when moving from lower to higher timeframes.
Behavior, Constraints & Performance
Repaint/confirmation: No cross-timeframe requests; values can evolve intrabar and settle on close. Alerts follow your TradingView alert timing settings.
Resources: `max_bars_back` is set to five thousand. Very large resolved lengths require sufficient history to seed EMAs; expect a warm-up period on first load or after switching symbols.
Known limits: Dead-band and acceptance can delay recognition at sharp turns. Extremely thin markets or large gaps may still cause brief regime reversals.
Sensible Defaults & Quick Tuning
Start with preset “3,10,16”, dead-band near zero, and acceptance of three bars.
Too many flips near zero: increase the dead-band slightly or raise the acceptance bars.
Too sluggish in clean trends: reduce the acceptance bars by one.
Too sensitive on fast lower timeframes: switch to the “12,26,9” preset family or raise the acceptance bars.
Want less clutter: hide the table and keep the alert.
What this indicator is—and isn’t
This is a visualization and regime layer for MACD using higher-timeframe emulation and stability gates. It is not a complete trading system and does not generate position sizing or risk management. Use it with market structure, execution rules, and protective stops.
Disclaimer
The content provided, including all code and materials, is strictly for educational and informational purposes only. It is not intended as, and should not be interpreted as, financial advice, a recommendation to buy or sell any financial instrument, or an offer of any financial product or service. All strategies, tools, and examples discussed are provided for illustrative purposes to demonstrate coding techniques and the functionality of Pine Script within a trading context.
Any results from strategies or tools provided are hypothetical, and past performance is not indicative of future results. Trading and investing involve high risk, including the potential loss of principal, and may not be suitable for all individuals. Before making any trading decisions, please consult with a qualified financial professional to understand the risks involved.
By using this script, you acknowledge and agree that any trading decisions are made solely at your discretion and risk.
Do not use this indicator on Heikin-Ashi, Renko, Kagi, Point-and-Figure, or Range charts, as these chart types can produce unrealistic results for signal markers and alerts.
Best regards and happy trading
Chervolino

Golden Ladder – Louay Joha (Wave & Gann Hi/Lo + ATR R-Levels)Overview
Golden Ladder is a momentum-and-structure tool that detects three-bar ladder waves and filters them with a Gann Hi/Lo regime guide (SMA-based). When a valid wave aligns with the current Hi/Lo bias and passes optional market filters (ADX, RSI, and proximity to recent extremes), the script prints BUY/SELL n labels (n = wave index) and draws a complete Entry / SL / TP1–TP4 ladder using ATR-based risk units (R) or fixed caps—configured for clarity and consistency. The script also keeps the chart clean: the last trade remains fully drawn while historical groups are trimmed to compact “ENTRY-only” stubs.
Why these components together (originality)
Three-bar ladder captures short-term momentum structure (progressively higher highs/lows for buys; the reverse for sells).
Gann Hi/Lo (SMA of highs/lows with a directional state) acts as a regime filter, reducing counter-trend ladders.
ATR-based R ladder turns signals into an actionable plan: a volatility-aware SL and TP1–TP4 that scale across instruments/timeframes.
Smart Entry filters (ADX strength, RSI extremes, and distance from recent top/bottom using ATR buffers) seek to avoid low-quality, stretched entries.
Slim history keeps only a short ENTRY stub for prior groups, so the signal you just got is always the most readable.
This is not a mere mashup; each layer constrains the others to produce fewer, clearer setups.
How it works (high-level logic)
Regime (Gann Hi/Lo):
Compute SMA(high, HPeriod) and SMA(low, LPeriod).
Direction state HLv flips when the close crosses above/below its track; one unified Hi/Lo guide is plotted.
Ladder signal (structure + confirmation):
BUY ladder: three consecutive green bars with rising highs and rising lows and HLv == +1.
SELL ladder: mirror conditions with HLv == -1.
Signals evaluate intrabar and are controlled by Smart Entry filters (ADX/RSI/extreme checks).
Risk ladder (R-based or capped):
Default: risk = ATR(atr_len) × SL_multiple and TPs in R.
Optional fixed caps by timeframe (e.g., M1/M5) using USD per point.
Longs: SL = entry – risk; TPi = entry + (Ri × risk).
Shorts: SL = entry + risk; TPi = entry – (Ri × risk).
All levels auto-reflow to the right as bars print.
Chart hygiene:
The latest trade shows ENTRY/SL/TP1–TP4 fully.
Older trades are automatically trimmed (only a short ENTRY line remains, with optional label).
Alerts:
BUY – Smart Entry (Tick) & SELL – Smart Entry (Tick) fire on live-qualified signals.
You can connect alerts to your automation, respecting your broker’s risk controls.
Inputs (English summary of UI)
Label settings: label size; ATR-based vs fixed-tick offsets; leader line width/transparency; horizontal label shift.
Gann Hi/Lo: HIGH Period (HPeriod), LOW Period (LPeriod).
Market filters: ADX (length, smoothing, minimum), RSI (length + caps), recent extremes (lookback + ATR buffer).
Entry/SL/TP Levels: TP1–TP4 (R), label right-shift, show last-trade prices on labels.
Fixed SL Caps: per-timeframe caps (M1/M5) via USD per point.
How to use
Apply on your instrument/timeframe; tune H/L periods and filters to your market (e.g., XAUUSD on M1/M5).
Favor signals aligned with the Hi/Lo regime; tighten filters (higher ADX, stricter RSI caps) to reduce noise.
Choose ATR-Risk or fixed caps depending on your preferences.
The drawing policy ensures the most recent trade remains front-and-center.
Notes & limitations
Signals can evaluate intrabar; MA-based context is inherently lagging.
ATR-based ladders adapt to volatility; extreme spikes can widen risk.
This is a technical analysis tool, not financial advice.
ATR x Trend x Volume SignalsATR x Trend x Volume Signals is a multi-factor indicator that combines volatility, trend, and volume analysis into one adaptive framework. It is designed for traders who use technical confluence and prefer clear, rule-based setups.
🎯 Purpose
This tool identifies high-probability market moments when volatility structure (ATR), momentum direction (CCI-based trend logic), and volume expansion all align. It helps filter out noise and focus on clean, actionable trade conditions.
⚙️ Structure
The indicator consists of three main analytical layers:
1️⃣ ATR Trailing Stop – calculates two adaptive ATR lines (fast and slow) that define volatility context, trend bias, and potential reversal points.
2️⃣ Trend Indicator (CCI + ATR) – uses a CCI-based logic combined with ATR smoothing to determine the dominant trend direction and reduce false flips.
3️⃣ Volume Analysis – evaluates volume deviations from their historical average using standard deviation. Bars are highlighted as medium, high, or extra-high volume depending on intensity.
💡 Signal Logic
A Buy Signal (green) appears when all of the following are true:
• The ATR (slow) line is green.
• The Trend Indicator is blue.
• A bullish candle closes above both the ATR (slow) and the Trend Indicator.
• The candle shows medium, high, or extra-high volume.
A Sell Signal (red) appears when:
• The ATR (slow) line is red.
• The Trend Indicator is red.
• A bearish candle closes below both the ATR (slow) and the Trend Indicator.
• The candle shows medium, high, or extra-high volume.
Only one signal can appear per ATR trend phase. A new signal is generated only after the ATR direction changes.
❌ Exit Logic
Exit markers are shown when price crosses the slow ATR line. This behavior simulates a trailing stop exit. The exit is triggered one bar after entry to prevent same-bar exits.
⏰ Session Filter
Signals are generated only between the user-defined session start and end times (default: 14:00–18:00 chart time). This allows the trader to limit signal generation to active trading hours.
💬 Practical Use
It is recommended to trade with a fixed risk-reward ratio such as 1 : 1.5. Stop-loss placement should be beyond the slow ATR line and adjusted gradually as the trade develops.
For better confirmation, the Trend Indicator timeframe should be higher than the chart timeframe (for example: trading on 1 min → set Trend Indicator timeframe to 15 min; trading on 5 min → set to 1 hour).
🧠 Main Features
• Dual ATR volatility structure (fast and slow)
• CCI-based trend direction filtering
• Volume deviation heatmap logic
• Time-restricted signal generation
• Dynamic trailing-stop exit system
• Non-repainting logic
• Fully optimized for Pine Script v6
📊 Usage Tip
Best results are achieved when combining this indicator with additional technical context such as support-resistance, higher-timeframe confirmation, or market structure analysis.
📈 Credits
Inspired by:
• ATR Trailing Stop by Ceyhun
• Trend Magic by Kivanc Ozbilgic
• Heatmap Volume by xdecow

Composite Buy/Sell Score [-100 to +100] by LMComposite Buy/Sell Score (Stabilized + Sensitivity) by LM
Description:
This indicator calculates a composite trend strength score ranging from -100 to +100 by combining multiple popular technical indicators into a single, smoothed metric. It is designed to give traders a clear view of bullish and bearish trends, while filtering out short-term noise.
The score incorporates signals from:
PPO (Percentage Price Oscillator) – measures momentum via the difference between fast and slow EMAs.
ADX (Average Directional Index) – detects trend strength.
RSI (Relative Strength Index) – identifies short-term momentum swings.
Stochastic RSI – measures RSI momentum and speed of change.
MACD (Moving Average Convergence Divergence) – detects momentum shifts using EMA crossovers.
Williams %R – highlights overbought/oversold conditions.
Each component is weighted, smoothed, and optionally confirmed across a configurable number of bars, producing a stabilized composite score that reacts more reliably to significant trend changes.
Key Features:
Smoothed Composite Score
The final score is smoothed using an EMA to reduce volatility and emphasize meaningful trends.
A Sensitivity Multiplier allows traders to exaggerate the score for stronger trend signals or dampen it for quieter markets.
Customizable Inputs
You can adjust each indicator’s parameters, smoothing lengths, and confirm bars to suit your preferred timeframe and trading style.
The sensitivity multiplier allows fine-tuning the responsiveness of the trend line without changing underlying indicator calculations.
Visual Representation
Score Line: Green for positive (bullish) trends, red for negative (bearish) trends, gray near neutral.
Reference Lines:
0 = neutral
+100 = maximum bullish
-100 = maximum bearish
Adaptive Background: Optionally highlights the background intensity proportional to trend strength. Strong green for bullish trends, strong red for bearish trends.
Multi-Indicator Integration
Combines momentum, trend, and overbought/oversold signals into a single metric.
Helps identify clear entry/exit trends while avoiding whipsaw noise common in individual indicators.
Recommended Use:
Trend Identification: Look for sustained movement above 0 for bullish trends and below 0 for bearish trends.
Exaggerated Trends: Use the Sensitivity Multiplier to emphasize strong trends.
Filtering Noise: The smoothed score and confirmBars settings help reduce false signals from minor price fluctuations.
Inputs Overview:
Input Purpose
PPO Fast EMA / Slow EMA / Signal Controls PPO momentum sensitivity
ADX Length / Threshold Detects trend strength
RSI Length / Overbought / Oversold Measures short-term momentum
Stoch RSI Length / %K / %D Measures speed of RSI changes
MACD Fast / Slow / Signal Measures momentum crossover
Williams %R Length Detects overbought/oversold conditions
Final Score Smoothing Length EMA smoothing for final composite score
Confirm Bars for Each Signal Number of bars used to confirm individual indicator signals
Sensitivity Multiplier Scales the final composite score for exaggerated trend response
Highlight Background by Trend Strength Enables adaptive background coloring
This indicator is suitable for traders looking for a single, clear trend metric derived from multiple indicators. It can be applied to any timeframe and can help identify both strong and emerging trends in the market.
