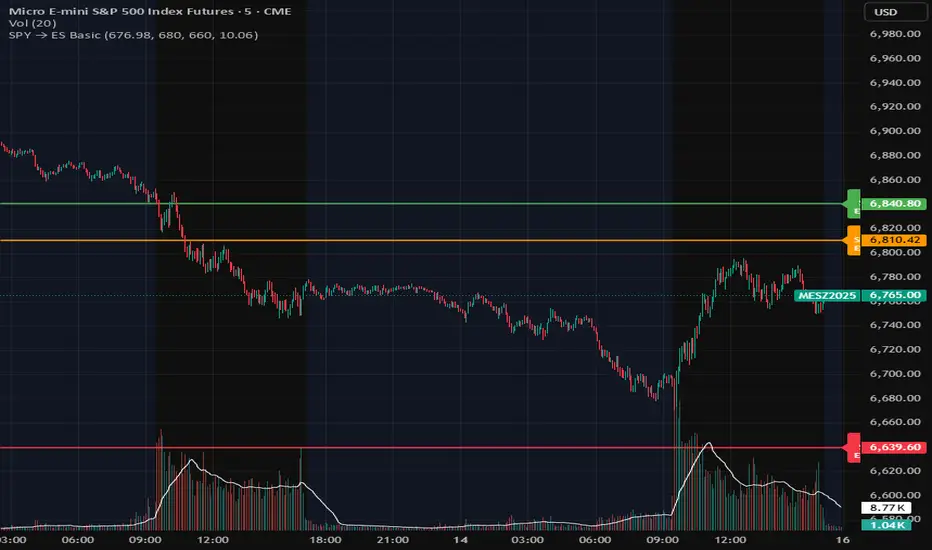
Defended Price Levels (DPLs) — Melvin Dickover ConceptThis indicator identifies and draws horizontal “Defended Price Levels” (DPLs) exactly as originally described by Melvin E. Dickover in his trading methodology.
Dickover observed that when extreme relative volume and extreme “freedom of movement” (volume-to-price-movement ratio) occur on the same bar, especially on bars with large gaps or unusually large bodies, the closing price (or previous close) of that bar very often becomes a significant future support/resistance level that the market later “defends.”
This script automates the detection of those exact coincident spikes using two well-known public indicators:
Relative Volume (RVI)
• Original idea: Melvin Dickover
• Pine Script implementation used here: “Relative Volume Indicator (Freedom Of Movement)” by LazyBear
Link:
Freedom of Movement (FoM)
• Original idea and calculation: starbolt64
• Pine Script: “Freedom of Movement” by starbolt64
Link:
How this indicator works
Calculates the raw (possibly negative) LazyBear RVI and starbolt64’s exact FoM values
Normalizes and standardizes both over the user-defined lookback
Triggers only when both RVI and FoM exceed the chosen number of standard deviations on the same bar (true Dickover coincident-spike condition)
Applies Dickover’s original price-selection rules (uses current close on big gaps or 2× body expansion candles, otherwise previous close)
Draws a thin maroon horizontal ray only when the new level is sufficiently far from all previously drawn levels (default ≥0.8 %) and the maximum number of levels has not been reached
Keeps the chart clean by limiting the total number of significant defended levels shown
This is not a republish or minor variation of the two source scripts — it is a faithful automation of Melvin Dickover’s specific “defended price line” concept that he manually marked using the coincidence of these two indicators.
Full credit goes to:
Melvin E. Dickover — creator of the Defended Price Levels concept
LazyBear — author of the Relative Volume (RVI) implementation used here
starbolt64 — author of the Freedom of Movement indicator and calculation
Settings (all adjustable):
Standard Deviation Length (default 60)
Spike Threshold in standard deviations (default 2.0)
Minimum distance between levels in % (default 0.8 %)
Maximum significant levels to display (15–80)
Use these horizontal maroon lines as potential future support/resistance zones that the market has previously shown strong willingness to defend.
Thank you to Melvin, LazyBear, and starbolt64 for the original work that made this automation possible.
Concept

Fractals by Aza fractals that show exactly those fractals that are intended for the 3-touch strategy and structure breakdown

FVG by AzaA special indicator that is correctly configured for the 3-touch strategy and structure breakdown

Multi-Timeframe Stochastic (4x) z Podświetlaniem - PawelA script that provides information when most of the stocks are in the overbought or oversold zone.

Multi-Timeframe RSI (4x) z Podświetlaniem - PawełRSI z podświetleniem z różnych tfów z ustawianiem intensywnosci i kolorów.

EMA Trend Alignment (10/20/50) with MTF & SignalsBullish Crossovers 10>20>50 and Bearish Crossover 10<20<50

Volume-Confirmed FTR Zones [AlgoPoint]FTR Zone Indicator — Fail To Return Zones (With Volume Confirmation)
Advanced Smart Money Zone Detection for Institutional Orderflow
The FTR Zone Indicator is a professional-grade tool designed for traders who follow Smart Money Concepts (SMC), ICT methodologies, or institutional orderflow. It automatically detects Fail To Return Zones (FTR) — high-probability supply and demand areas formed after strong displacement moves.
By combining impulse detection, base identification, and volume confirmation, this indicator highlights zones where price is most likely to react, reverse, or mitigate shortly after structure breaks.
⸻
⭐ What Are FTR Zones?
FTR zones (Fail To Return zones) are price areas where:
1. A strong displacement / impulse candle is formed
2. That impulse originates from a small consolidation (base)
3. Price moves away aggressively
4. AND fails to return immediately to the origin area
These zones often indicate:
• Institutional orders
• Imbalance
• Hidden liquidity
• Origin of a trend leg
• High-probability mitigation points
This indicator fully automates the detection and visualization of such areas.
🔍 How the Indicator Works
1. Impulse Detection
The indicator identifies a valid impulse candle using:
• ATR-based bar range filter
• Trend-aligned candle body direction
• Optional volume confirmation
Only large, meaningful institutional candles qualify — filtering out noise.
2. Base Zone Identification
Before every impulse, the tool finds the micro-consolidation base using:
• Highest high of the last X bars
• Lowest low of the last X bars
This base becomes the potential FTR zone.
3. FTR Zone Creation
When a valid impulse is detected:
• Bullish impulse → Demand FTR zone
• Bearish impulse → Supply FTR zone
The zone is immediately drawn on the chart using box.new().
4. Zone Extension
Every zone continuously extends to the right as price evolves, allowing you to track:
• Mitigation
• Retests
• Reaction points
• Liquidity sweeps
5. Invalidation Logic
Zones automatically delete when violated:
• Demand zone invalid if close < zone low
• Supply zone invalid if close > zone high
This keeps the chart clean and helps focus only on active, high-value areas.
🎛️ Key Features
✔ Automatic FTR Zone Detection
Instantly identifies institutional origin zones based on real impulse and displacement.
✔ Volume-Based Filtering
Ensures only high-volume impulses (true institutional orders) create zones.
✔ Supply & Demand Coloring
• Bullish FTR → Demand Zone (Teal tone)
• Bearish FTR → Supply Zone (Red tone)
✔ Safe Zone Storage
Fault-tolerant logic ensures no array errors, invalid zones, or broken visuals.
✔ Auto-Extending Boxes
Real-time zone updates with precise historical mapping.
✔ Smart Invalidation
Zone is removed only when fully broken, preventing false signals.
✔ Clean, Non-Repainting Logic
Impulse detection and zone placement are confirmed only on bar close.
📈 How to Use It (Example Schenarios)
For Reversals or Continuations
• Look for price reacting or mitigating inside a zone
• Use as entry confirmation in trend continuations
• Combine with FVG, BOS/CHOCH, liquidity sweeps, or premium/discount zones
For Scalping or Intraday Trading
• High-probability countertrend entries
• Reaction-based setups at institutional footprints
For Swing Traders
• Identify weekly/daily origin zones
• Plan entries around large displacement points

CAGR BAR B2BThis will help understanding CAGR is completely now form.
Contact in twitter/x @xpertnifty

Break & Retest + Liquidity Sweep EntryIdentify a BOS (vertical line appears).
Wait for price to retest the broken level (circle shows up).
Optionally confirm with liquidity sweep.
Enter long/short trades based on bullish/bearish retest signals.
Use ATR or personal risk management for stop-loss placement.

ATC v6 with ORB by SabnATC v6 with ORB: Advanced Automatic Session and Opening
Range Indicator
ATC v6 is an advanced indicator designed by Alfa Trade Club for
TradingView users. This tool not only automatically marks important session
opens, closes, or specific times of financial markets on your chart but also
visualizes powerful Opening Range (ORB) strategies directly on your chart.
This tool removes the need to manually monitor critical trading hours, allowing
you to easily analyze price action in relation to these important timeframes.
Key Features
This indicator comes with a set of powerful features to provide the flexibility,
visual clarity, and strategic advantage that traders need:
1. Multi-Time Zone Support The indicator is based on the world's most
important financial market centers:
New York (America/New_York)
London (Europe/London)
Tokyo (Asia/Tokyo)
Istanbul (Europe/Istanbul)
This allows you to always set the lines accurately according to the local time of
the market you are trading.
2. Advanced 3-Stage Timing (Pre / Main / Next) Each time line is more than
just a simple line; it can manage a three-stage event cycle:
"Pre-Session": Draws a dotted line a few minutes before the main time you
specify (e.g., market open). This allows you to see the price level just before a
significant event.
"Main Session": Marks the opening price at the exact event time (e.g., 08:00
London Open) with a solid line.
"Next / ORB" (Opening Range): Draws another dotted line a specified number
of minutes after the main event (e.g., 15 minutes later). This is used to define the
Opening Range.
3. Automatic Price Boxes (Volatility & ORB) The indicator can draw two
different types of boxes based on this timing:
Opening Volatility Box (Pre -> Main): If the "Pre-Session" feature is active, the
indicator draws a colored box between the price at the pre-session moment and
the price at the main event. This box visualizes the initial volatility at the session
open.
Opening Range Box (Main -> Next): If the "Next" feature is active, the indicator
draws a box between the price at the main event and the "next" event.
4. Customizable Time Lines You have full control over each line. Users can:
Enable/Disable each line.
Set any desired hour and minute.
Define the "Pre" and "Next" durations in minutes.
Assign a different color for visual distinction.
5. Smart and Efficient Drawing
Forward-Extending Lines: All drawn lines and boxes automatically extend from
the moment they are created until the next day. This makes it easy to track how
these levels act as support/resistance throughout the day.
High Performance: Instead of deleting old lines and drawing new ones when a
new day starts, the code intelligently extends the existing lines into the next day
Weekend and DST Protection: Automatically skips weekends (from Friday to
Monday) and is not affected by Daylight Saving Time (DST) changes.
Who Is It For?
Session-Focused Traders: Ideal for those who track volatility during the London,
New York, Asian, or Istanbul session opens.
Day Traders: Perfect for those who want to mark important economic data
release times or daily market open/close levels.
Technical Analysts: A powerful aid for those who want to visually analyze how
opening prices at specific times and time ranges play a role throughout the day.
ATC v6 with ORB is much more than just a simple session line; it is a dynamic
analysis and strategy tool that combines price and time.

RSI with Zone Colors//@version=6
indicator(title="RSI with Zone Colors", shorttitle="RSI+", format=format.price, precision=2, timeframe="", timeframe_gaps=true)
//// ==== INPUT SETTINGS ====
rsiLength = input.int(14, title="RSI Length", minval=1)
source = input.source(close, title="Source")
ob_level = input.int(70, title="Overbought Level")
os_level = input.int(30, title="Oversold Level")
//// ==== RSI CALCULATION ====
change = ta.change(source)
up = ta.ma(math.max(change, 0), rsiLength)
down = ta.ma(-math.min(change, 0), rsiLength)
rsi = down == 0 ? 100 : 100 - (100 / (1 + up / down))
//// ==== COLOR BASED ON ZONES ====
rsiColor = rsi > ob_level ? color.red : rsi < os_level ? color.green : #2962FF
//// ==== PLOT RSI ====
plot(rsi, title="RSI", color=rsiColor, linewidth=2)
//// ==== ZONE LINES ====
hline(ob_level, "Overbought", color=#787B86)
hline(50, "Middle", color=color.new(#787B86, 50))
hline(os_level, "Oversold", color=#787B86)
//// ==== FILL ZONES ====
zoneColor = rsi > ob_level ? color.new(color.red, 85) : rsi < os_level ? color.new(color.green, 85) : na
fill(plot(ob_level, display=display.none), plot(rsi > ob_level ? rsi : ob_level, display=display.none), color=zoneColor, title="OB Fill")
fill(plot(os_level, display=display.none), plot(rsi < os_level ? rsi : os_level, display=display.none), color=zoneColor, title="OS Fill")
//// ==== COLOR CANDLE WHEN RSI IN ZONE ====
barcolor(rsi > ob_level ? color.red : rsi < os_level ? color.green : na)

MCM By Inner Racers# MCM By Inner Racers - Multi-Timeframe Key Levels & Session Indicator
## 📊 Overview
**MCM (Multi-Timeframe Chart Mapping)** is a comprehensive trading indicator designed for professional traders who need clear visual representation of critical price levels, session ranges, and time-based market structure. This all-in-one tool eliminates chart clutter while providing essential information for ICT, SMC, and institutional trading methodologies.
---
## ✨ Key Features
### 📅 **Previous Daily Levels**
- **Previous Day High (PDH)** - Acts as key resistance/liquidity zone
- **Previous Day Low (PDL)** - Acts as key support/liquidity zone
- **Previous Day Mid (PDM)** - 50% equilibrium level for mean reversion trades
- **Daily Separators** - Vertical lines marking new trading days
### 📆 **Previous Weekly Levels**
- **Previous Week High (PWH)** - Major weekly resistance for swing trading
- **Previous Week Low (PWL)** - Major weekly support for swing trading
- **Previous Week Mid (PWM)** - Weekly equilibrium for higher timeframe bias
- **Weekly Separators** - Vertical lines marking new trading weeks
### 🌅 **True Day Opens (TDO)**
- Displays opening prices at **midnight NY time** for the past 1-10 days
- Each level labeled as "TDO D-0", "TDO D-1", "TDO D-2", etc.
- Critical for tracking institutional reference points and gap trading
- Respects true midnight opens (not session opens)
### 📍 **Weekly Opens**
- **Monday 00:00 Open** - True weekly open at Monday midnight NY time
- **Sunday 17:00 Open** - Forex market open (Sunday 5 PM NY time)
- Essential for understanding weekly bias and manipulation zones
### 🌏 **Trading Session Ranges**
Dynamic session boxes that track real-time high/low ranges:
- **Asian Session** (Default: 20:00-00:00 NY) -
- **London Session** (Default: 02:00-05:00 NY) -
- **New York Session** (Default: 07:00-16:00 NY) -
All session times are **fully customizable** in 15-minute increments.
---
## 🎯 Who Is This For?
✅ **ICT/SMC Traders** - Key levels for market structure, liquidity, and order flow
✅ **Session Traders** - Identifying killzones and optimal entry zones
✅ **Swing Traders** - Previous day/week levels as support/resistance
✅ **Multi-Timeframe Analysts** - Understanding price relationships across timeframes
✅ **Forex & Indices Traders** - NY time-based analysis for institutional moves
---
## 🎨 Full Customization
Every element is fully customizable:
- ✏️ **Colors** - Match your chart theme perfectly
- 📏 **Line Widths** - 1-5 pixels for visibility
- 🎭 **Line Styles** - Solid, Dashed, or Dotted
- 🏷️ **Labels** - Custom text and 5 size options (Tiny to Huge)
- ⏱️ **Session Times** - Adjust to your timezone or broker
- 📐 **Line Extension** - 20-500 bars forward projection
- 👁️ **Toggle Visibility** - Show/hide any feature independently
---
## 🔧 Technical Highlights
- Uses **request.security()** for accurate higher timeframe data
- Implements **lookahead=barmerge.lookahead_on** for non-repainting levels
- All times calculated in **America/New_York timezone** for consistency
- Efficient line management with proper deletion/recreation
- Maximum 500 lines supported for clean chart performance
- Session detection respects broker time differences
---
## 📖 How To Use
### **For Day Traders:**
1. Enable Daily Levels + True Day Opens for intraday structure
2. Use Session Ranges to identify high-probability trading windows
3. Watch for price reactions at PDH/PDL and TDO levels
### **For Swing Traders:**
1. Enable Weekly Levels for higher timeframe bias
2. Use PWH/PWL as major support/resistance zones
3. Monitor Weekly Opens for institutional reference points
### **For Multi-Timeframe Analysis:**
1. Combine Daily + Weekly levels for confluence zones
2. Use Mid levels (50%) for mean reversion opportunities
3. Align session ranges with higher timeframe structure
---
## ⚙️ Setup Tips
- **Timeframe:** Works on all timeframes (recommended: 1m to 1H for intraday)
- **Chart Type:** Overlay indicator - displays directly on price chart
- **Clean Charts:** Toggle off features you don't need for specific strategies
- **Labels:** Turn off labels for cleaner charts, turn on for reference
- **Line Extension:** Adjust based on your screen size and bar count
---
## 🚀 What Makes This Different?
Unlike basic support/resistance indicators, MCM provides:
- ✅ **True NY midnight opens** (not session opens)
- ✅ **Multiple day opens** tracking (not just previous day)
- ✅ **Dynamic session ranges** (not static boxes)
- ✅ **Both true weekly opens** (Monday 00:00 AND Sunday 17:00)
- ✅ **Fully customizable everything** (colors, styles, labels, times)
- ✅ **Non-repainting levels** using proper lookahead settings
- ✅ **All-in-one solution** (no need for multiple indicators)
---
## 📝 Notes
- All times are in **America/New_York timezone** for consistency with institutional trading
- Previous levels update at the start of each new day/week
- Session ranges are calculated dynamically during active sessions
- Lines extend forward for clear visual reference
- Works with any symbol: Forex, Indices, Crypto, Stocks
---
## 🏷️ Tags
`Multi-Timeframe` `Key Levels` `ICT` `Smart Money Concepts` `Sessions` `Previous Day High/Low` `Previous Week High/Low` `Support Resistance` `Institutional Trading` `Order Flow` `Liquidity` `Market Structure`
---
© Inner_Racers
For questions, suggestions, or feedback, please leave a comment below!
**⭐ If you find this indicator helpful, please give it a boost and share with fellow traders!**

Improved ICT MultiTF A+ IndicatorThis indicator provides ICT-style multi time frame fair value gaps with a 4-hour moving average bias. It prioritizes 15-minute gaps and falls back to 5-minute and 1-minute gaps when none are present. It also includes alert conditions for long and short signals based on session filters and bias.

4/8/15 EMA + Classic & Camarilla PivotsEssentially this is what you can get on TOS but everything included in one chart.

The Butterfly Elephant EffectStrategy Overview: The Butterfly Elephant Effect
Concept & Philosophy:
Welcome to "The Butterfly Elephant Effect," a sophisticated multi-indicator strategy that operates on the principle that small, precise technical signals (the Butterfly) can trigger significant market moves (the Elephant Effect). This strategy is designed to identify high-probability reversal points by combining three powerful analytical systems into one cohesive framework. It seeks to catch major trend reversals at key support and resistance levels, using a confluence of volume, momentum, and overbought/oversold oscillators.
Core Components:
The strategy intelligently synthesizes three distinct systems:
Lucky Balls System (Volume & Trend):
Utilizes the Negative Volume Index (NVI) and Positive Volume Index (PVI) to understand smart money activity and trend strength.
Plots these indices on the price chart, scaled to the recent price range for actionable signals.
Generates signals when price interacts with a moving average envelope, identifying potential exhaustion points.
Momentum Confirmation System:
Combines RSI, CCI, and PPO momentum oscillators into a single, refined line.
This "Momentum Composite" line is used to confirm the strength of a reversal signal as it crosses the dynamic envelope bands.
Lucky Table System (Market Breadth & Confluence):
This is the heart of the strategy's filtering mechanism. It runs 36 different oscillator readings across 6 different timeframes for Stochastic, Williams %R, RSI, and MACD.
It counts the number of these oscillators that are in extreme overbought or oversold territory.
A "Lucky Table" signal is generated when the number of matching oscillators exceeds your customizable threshold (e.g., 30 out of 36), indicating a massive, multi-timeframe consensus on market exhaustion.
The Ultimate Signals:
The strategy's most powerful entries are the specially named signals that require a perfect storm of conditions:
🐘 Elephant Long Signal: Triggers when the Momentum System gives a buy, the Lucky Table shows extreme oversold consensus, AND the price is at or below the adjusted lower envelope band. This represents a potential major bullish reversal from a support zone.
🦋 Butterfly Short Signal: Triggers when the Momentum System gives a sell, the Lucky Table shows extreme overbought consensus, AND the price is at or above the adjusted upper envelope band. This represents a potential major bearish reversal from a resistance zone.
Key Features:
Visual Clarity: A rich set of plotshapes (🪜, 🐍, 🐸, ✈️, ⚽) makes it easy to identify the contributing signals from each subsystem on the chart.
Comprehensive Dashboard: A real-time table displays all 36 oscillator values from the Lucky Table, color-coded for quick assessment of market conditions.
Flexible Risk Management: Includes optional Profit Target and Stop Loss based on a percentage of entry price.
Highly Customizable: Every parameter—from lookback lengths and scale factors to the crucial match threshold—can be adjusted to fit your trading style and instrument.
How to Use:
Add the strategy to your chart.
Look for the primary Elephant (🐘) or Butterfly (🦋) signals near the envelope boundaries.
Use the Lucky Table on the top-right to confirm the strength of the oversold/overbought conditions.
Manage your trade using the built-in PT/SL or your own discretion.
Ideal For: Swing traders and position traders looking for high-conviction entries at potential market turning points.
Disclaimer: This is a complex strategy designed for educational and research purposes. Always test and forward-test any strategy in a simulated environment before committing real capital. Past performance is not indicative of future results.
PS Look out for the Frog :-)

Confirmation ny meThis is confirmation indicator very good This is a powerful confirmation indicator designed to help traders identify strong entry points with accuracy and confidence. It filters out false signals and confirms momentum direction before you enter a trade. Works perfectly on multiple timeframes and instruments.
⸻
🔹 Short & Catchy
Simple yet powerful confirmation tool. It helps confirm your trade setup with high accuracy, reducing false entries and improving win rate.
⸻
🔹 Detailed (for more credibility)
Confirmation by Me is a custom-built indicator that confirms trade direction using a blend of trend strength and momentum signals. Whether you’re trading forex, crypto, or indices, it helps you spot real confirmations and avoid fake breakouts. Ideal for scalping, day trading, and swing setups.

Multi-TF RSI Consolidation (15M) - PepEnhanced view of rsi levels across multiple timeframes in unison.

Order Block Smart Entry (v6)very useful indicator, analyze multiframes to identify the trend, then find out the valid order block and after analyzing lower time frame entry gives the singal.


True Opens (TDO/TWO/NYAM etc.)+ First FVG - Milana TradesThis indicator combines multiple "True Open" levels with the visualization of the first Fair Value Gap (FVG) following key market opens.
Key Features:
True Opens (TDO, TWO, TAO, TLO, NYAM, TNY):
TDO (True Day Open): Displays the start of the trading day (00:00 NY time) with customizable line style, color, and label.
TWO (True Weekly Open): Marks the start of the week (Monday 18:00 NY time) with visual lines and optional labels.
TAO (True Asian Open): Highlights the opening of the Asian session (19:30 NY time), allowing traders to track early Asian session activity.
TLO (True London Open): Marks London session open (01:30 NY time), providing insight into the first European market activity.
NYAM (New York AM Open): Marks 09:30 NY time, often a key liquidity spike period.
TNY (True New York Open): Highlights the full New York session open (07:30 NY time), useful for pre-market and early NY session trading.
All lines are fully customizable in color, style, width, and label visibility. Lines can also be extended to the right for better visual tracking.
First FVG After Open:
Automatically detects the first Fair Value Gap (FVG) following each session open.
Supports both bullish and bearish FVGs, displayed with distinct colors and transparency.
Mitigation detection highlights gaps that have already been touched or partially filled, using a softer color for clarity.
Why the first FVG matters:
The first gap after an open often indicates the initial imbalance of the session.
These gaps can act as high-probability zones for retracement or continuation trades, providing early-session trade opportunities.
Daily & Weekly Initial Range Boxes:
Visualize daily (00:00–01:00 NY) and weekly (Monday 18:00–19:00 NY) initial ranges.
Boxes update dynamically with price movement during the session.
Optional range info in pips to quantify volatility and potential targets.
Customizable Appearance:
Choose colors for bullish, bearish, and mitigated FVGs.
Adjust line styles (solid, dashed, dotted), widths, labels, and extensions for all opens.
Transparency settings for IB boxes allow clear chart readability without clutter.
Historical Options:
Enable prior day/week visualization to analyze session behavior and recurring patterns.
Why Traders Use This Indicator:
Early session clarity: Knowing the true session opens and first FVGs helps traders spot high-liquidity zones and potential reversals.
Structure-based trading: Combines session open levels with FVGs, aligning with professional market structure strategies.

Orderflow Lite — Column Dashboard v3An advanced analytical instrument that transforms the market into an interactive command center
Orderflow Lite v3 is a sophisticated visualization solution that reveals the hidden dynamics of the market through a multistratified column architecture. Each price bar becomes a window into the accumulative behavior of operators, and the relationships between different indicators materialize into a three-dimensional perspective of volume.
What it offers
🔹 Dynamic panel with 9 data layers – Each column represents a distinct level of market architecture, from raw volume to context signals
🔹 Reversal scoring system – Aggregates complex market behaviors into an intuitive metric, calibrated on a 0-10 scale, with adjustable thresholds for discriminant trades
🔹 Intelligent colors – Candles adapt to polarity, and label backgrounds reflect sentiment intensity as tonality variations
🔹 Optional Heikin-Ashi – Switches calculations to smoothed price structures, ideal for detecting directional shifts in noise
🔹 Integrated VWAP – Immediate context of the volume-weighted level, validating moves relative to daily equilibrium
🔹 Persistent CVD with daily reset – Tracks accumulation/distribution per session, exposing hidden structures in capital flow
Optimized for
Order flow analysts seeking refinement in signaling
Intraday traders who require multistratified confirmations
Market mechanics explorers who want to decipher order from chaos
Highly customizable: 15+ parameters for fine-tuning – from panel density to the weights of each scoring component.
Discover what others see only as noise.

DTC Killzones ICT🕐 DTC Killzones ICT — Visualize Market Sessions Like a Pro
The DTC Killzones ICT indicator is a clean and intuitive tool designed for traders who want to analyze and visualize institutional trading sessions directly on their charts.
Inspired by ICT’s Killzone concept , this script makes it easy to identify overlapping market sessions — such as London, New York, and Asian — and track how price behaves within each zone.
💡 What It Does
This indicator automatically highlights key market sessions (Killzones) on your chart with fully customizable colors, labels, and transparency.
Each zone dynamically updates to reflect real-time highs and lows, helping you identify:
Session ranges and liquidity zones
Volatility windows and breakout areas
Institutional footprints across sessions
Whether you trade Forex, Indices, or Crypto , this script gives you visual clarity on when and where smart money is likely to move.
⚙️ Main Features
✅ Up to four customizable sessions (New York, London, Asian, and London Close)
✅ Adjustable timeframes and timezone options — sync with your exchange or custom UTC offset
✅ Dynamic high/low range tracking for each session
✅ Toggle range outlines, session labels , and transparency levels
✅ Optional daily dividers and session transition markers
✅ Works on any timeframe and any symbol
🧠 How Traders Use It
ICT-based traders can easily mark Killzones to align with setups like FVGs, liquidity grabs, or Silver Bullet entries.
Intraday traders can visualize session volatility and overlap periods for potential entries.
Swing traders can identify daily structure shifts by tracking range-to-range behavior.
🛠️ Customization
You can fully rename, recolor, or disable each session block.
Adjust the range transparency for visual comfort, and toggle session or daily dividers to fit your workflow.
Everything is designed to be clean, light, and modular — no clutter, no confusion.
⚡ Recommended Settings
For ICT-style analysis:
London Session: 02:00–05:00
New York Session: 07:00–10:00
Asian Session: 19:30–24:00
London Close Session: 10:00–12:00
These time windows are fully editable to suit your timezone or strategy.
🧩 Compatibility
Works seamlessly with TradingView’s built-in timezone tools
Compatible with all instruments and timeframes
Designed to overlay directly on your price chart
🏁 Final Notes
The DTC Killzones ICT indicator focuses purely on market session visualization — no alerts, entries, or trading signals.
It’s designed to complement your existing strategies and enhance clarity when analyzing market behavior across global sessions.
📈 Built for traders who value precision, structure, and timing.
