50-Minute Opening Range BreakoutThis is a test of the opening range with Bearish/Bullish confirmation
Concept

Volume Surge by MashrabThe "Volume Surge" indicator is like a simple market health checkup. It looks at how much of an asset (like a stock or crypto) is being traded right now and compares it to the recent past. Think of it as a way to quickly see if interest in that asset is suddenly spiking, fading, or staying the same.
The indicator shows this information in an easy-to-read table right on your chart.
How it works:
The indicator keeps track of two main things for you:
Current Volume: The total trading volume over the last "N" days (or whatever time period you choose).
Previous Volume: The total trading volume over the period right before that
Then, it gives you a summary:
The "Ratio" tells you how many times bigger or smaller the current volume is.
The "Percent Change" shows the percentage jump in volume.
How to use it:
This indicator helps you see when something interesting might be happening. Here are a few ways traders use it:
Confirm Breakouts: If a stock breaks above a key price level and the indicator shows a huge volume surge, it’s a stronger signal that the move is real and not a false alarm.
Spot Reversals: If a stock has been trending up but the volume starts to drop off, it could mean the trend is losing steam. A sudden, massive volume surge on a down day might indicate panic selling, which can sometimes happen right before the price turns around.
Check Trend Strength: A healthy trend usually has increasing volume going in the same direction. For example, if a stock is in an uptrend, you want to see lots of volume on the days it goes up.
This indicator isn't a crystal ball, but it's a great tool for understanding the "who" and "how much" behind a price move. It helps you see when a price change is backed by a lot of market activity, which often makes the move more trustworthy.

NY Midnight High/Low Arrows (Auto-Show)🇺🇸 English Explanation
This indicator automatically marks the daily high and low of the New York session.
It draws arrows (▼▲) at the highest and lowest prices after New York midnight (00:00),
and can optionally display small horizontal dotted lines at those levels.
It helps traders identify daily liquidity zones and key turning points in price action.
🇸🇦 الشرح بالعربية
هذا المؤشر يحدد القمة والقاع اليومية لجلسة نيويورك بشكل تلقائي.
يرسم أسهماً (▼▲) عند أعلى وأدنى سعر بعد منتصف الليل بتوقيت نيويورك (00:00)،
ويمكنه أيضًا عرض خطوط أفقية منقطة صغيرة عند تلك المستويات.
يساعد المتداول في معرفة مناطق السيولة اليومية ونقاط الانعكاس المهمة في حركة السعر.

[Aegis]DCA grid Strategy for Crypto### **Crypto Market Long-Only Strategy (DCA with Risk Mitigation)**
This strategy is a Long-only approach, often using a Dollar-Cost Averaging (DCA) method for staggered entries. It is designed to mitigate the risk of being unable to exit a position for a prolonged period, which typically occurs when a series of initial DCA entries result in a losing trade.
The strategy has the following characteristics:
#### **1. Markets**
* Trade in highly liquid Perpetual Futures markets for cryptocurrencies.
#### **2. Position Sizing**
The initial entry quantity is determined by setting the **Initial Entry Ratio** in the input values.
* If the **Subsequent Entry Multiplier** is 1, the maximum position size upon final entry is determined by:
$$\text{Initial Entry Quantity} \times \text{Number of Entries}$$
* If the **Subsequent Entry Multiplier** is $x$, the maximum position size is determined by the following cumulative sum:
$$\text{1st Entry Quantity} + (\text{1st Entry Quantity} \times x) + (\text{2nd Entry Quantity} \times x) + \dots + ((\text{n-1)th Entry Quantity} \times x)$$
#### **3. Entries**
* The **1st Entry** is determined by the **Entry Sensitivity**. The first entry is automatically calculated based on an oversold condition; setting a higher sensitivity value will trigger the 1st entry in a more significant oversold situation.
* Entries from the **2nd Entry onwards** are made sequentially based on the generated **Grid Spacing**.
* The **Grid Spacing** is calculated as an equal interval:
$$\text{Grid Spacing} = \frac{\text{Final Entry Distance}}{(\text{Number of Entries} - 1)}$$
#### **4. Exits**
This strategy **does not distinguish between Stop-Loss and Take-Profit**. All entered quantities are liquidated simultaneously upon mean reversion. This transaction may result in either a loss or a profit. Generally:
* If the price recovery is rapid, the trade finishes with a profit.
* If the price recovery is slow, the trade finishes with a loss.
Therefore, the **'resilience' or 'recovery speed'** of the underlying asset significantly influences the long-term performance of the strategy.
크립토 시장에 특화된 Long only전략입니다. DCA 방식의 분할 매수 전략이 대체로 이익 거래가 아닌 경우, 장기간 탈출하지 못할 리스크를 보완한 전략입니다.
이 전략은 다음과 같은 특징을 가지고 있습니다.
##### 1. 시장 (Markets)
• 유동성이 풍부한 코인 무기한 선물 시장에서 거래한다.
##### 2. 포지션 크기 (Position Sizing)
인풋 값에 최초진입비율을 설정함으로써 1차 진입의 수량이 결정됩니다.
- 추가 진입배수가 1일 때, 최대 진입 시 포지션 크기는 "1차 진입수량 * 진입횟수"에 의해 결정됩니다.
- 추가 진입배수가 x일때,
1차진입물량 + (1차진입 물량 * x) + (2차진입 물량 * x) ..... + (n-1)차 진입물량 * x 의 방식으로 최대 진입 시 포지션 크기가 결정 됩니다
##### 3. 진입 (Entries)
- 1차 진입은 진입 둔감도에 의해 결정됩니다. 1차 진입은 과매도 상황을 자동적으로 계산하여 결정되며, 둔감도를 높은 값으로 설정하면 더 큰 과매도 상황에서 1차 진입이 결정됩니다.
- 2차 이후의 진입은 생성된 그리드 간격에 의해 순차적으로 진입하게 됩니다.
- 그리드 간격은 최종 진입 간격 / (진입 횟수 - 1) 으로 등간격으로 이루어집니다.
##### 4. 청산 (Exits)
이 전략은 손절과 익절을 구분하지 않습니다. 평균 회귀를 하는 경우 진입한 모든 물량을 일시에 청산하며, 이 거래는 손실 거래일 수도, 이익 거래일 수도 있습니다. 일반적으로, 가격 회복이 빠르게 되는 경우 이익 거래로 마무리되고, 가격 회복이 느린 경우 손실 거래로 마무리되기 때문에, 장기적으로 종목의 '회복탄력성'이 전략의 성과에 영향을 줄 수 있습니다.

[Aegis]Original Turtle System for CryptoAs Richard Dennis once said, "Even if I published all the Turtle rules in the newspaper right now, no one would be able to 'execute' them," and 40 years later, even in modern financial markets (like the crypto market) where all the conditions have been disclosed, this strategy continues to deliver amazing performance. The following outlines the original Turtle rules as disclosed by Curtis Faith in his book *Way of the Turtle*, and a TradingView algorithm that translates these rules for application in the crypto market.
---
### **The Original Turtle Trading Rules**
#### **1. Markets**
* Trade in liquid futures markets.
#### **2. Position Sizing**
The volatility measure, **N**, is used as the basis for all calculations.
**True Range (TR) Calculation:** Select the largest of the following three values:
* Current High - Current Low
* $|\text{Current High} - \text{Previous Close}|$ (Absolute Value)
* $|\text{Current Low} - \text{Previous Close}|$ (Absolute Value)
**N (Average True Range, ATR) Calculation:**
$$N = \frac{(19 \times \text{PDN} + \text{TR})}{20}$$
* **PDN:** Previous Day's N value
* **TR:** Current True Range
This is similar to a 20-day Exponential Moving Average, and is sometimes calculated using a Simple Moving Average.
**Unit Size Calculation:**
$$\text{Unit Size (Number of Contracts)} = \frac{1\% \text{ of Account Equity}}{(\text{N} \times \text{Dollars per Point})}$$
* **Dollars per Point (Tick Value):** The value of a 1-point change in price.
#### **3. Entries**
* **Entry:** Buy when the 55-day high is broken to the upside, and sell when the 55-day low is broken to the downside.
#### **5. Stops**
* The stop-loss for every unit is set at a price **2N** unfavorable from the entry price.
* For each additional unit added, the stop price for the **entire position** is adjusted favorably by **1/2 N**.
* In other words, the stop price of the last unit entered becomes the stop price for the entire position.
#### **6. Exits**
The exit rule for profitable positions (before a stop is hit) is as follows:
* **Long Positions:** Exit when the 20-day low is broken to the downside.
* **Short Positions:** Exit when the 20-day high is broken to the upside.
*Note: This exit rule is followed only if the price has moved up by a value greater than or equal to the N value multiplied by the criterion for changing the take-profit line (the original Korean text mentions a condition based on N, which is commonly interpreted as requiring a profit before applying the channel exit).*
리처드 데니스가 앞서 "내가 지금 당장 터틀의 모든 규칙을 신문에 공표한다고 해도 아무도 '실행'하지 못할 것"라고 말했듯 40년이 흘러 모든 조건이 공개된 현대 금융시장(크립토 시장)에서도 여전히 이 전략은 놀라운 퍼포먼스를 기록하고 있습니다. 아래는 커티스 페이스가 자신의 저서 '터틀의 방식'에 공개한 오리지널 터틀 규칙과 이를 알고리즘으로 변환하여 크립토마켓에 적용한 트레이딩뷰 알고리즘 입니다.
##### 1. 시장 (Markets)
• 유동성이 풍부한 선물 시장에서 거래한다.
##### 2. 포지션 크기 (Position Sizing)
변동성 측정 단위인 N을 모든 계산의 기초로 사용한다.
**True Range (TR) 계산:** 다음 세 가지 값 중 가장 큰 값을 선택한다.
- • 현재 고가 - 현재 저가
- • |현재 고가 - 전일 종가| (절대값)
- • |현재 저가 - 전일 종가| (절대값)
**N (Average True Range, ATR) 계산:**
N = (19 × PDN + TR) / 20
- • PDN: 이전 날의 N 값
- • TR: 현재 True Range
이는 20일 지수이동평균과 유사하며, 단순이동평균으로 계산하기도 한다.
**1 유닛(Unit)의 크기 계산:**
유닛 크기 (계약 수) = 계좌 자산의 1% / (N × 틱 가치)
• 틱 가치(Dollars per Point): 1포인트 변동 시의 가치
##### 3. 진입 (Entries)
- • 진입: 55일 고가를 상향 돌파하면 매수, 55일 저가를 하향 돌파하면 매도한다.
##### 5. 손절 (Stops)
- • 모든 유닛에 대한 손절 기준은 진입 가격으로부터 2N 만큼 불리한 가격에 설정한다.
- • 유닛이 추가될 때마다 전체 포지션의 손절 가격을 1/2 N 만큼 유리한 방향으로 상향 조정한다.
- • 즉, 마지막으로 진입한 유닛의 손절 가격이 전체 포지션의 손절 가격이 된다.
##### 6. 청산 (Exits)
손절에 도달하기 전 수익 중인 포지션의 청산 규칙은 다음과 같다.
- • 매수 포지션: 20일 저가를 하향 돌파할 때 청산한다.
- • 매도 포지션: 20일 고가를 상향 돌파할 때 청산한다.
단, N값에 익절선 변경 기준을 곱한 값 이상으로 가격이 상승할 경우, 위 규칙을 따른다.

ICT Macro Time WindowsICT Macro Time Windows - Master institutional market timing with automated 'Macro' trading session tracking.
What are 'Macros'?
In ICT terminology, 'Macros' refer to the key institutional trading windows throughout the day where major banks and liquidity providers are most active. These specific time frames see heightened volatility, liquidity, and strategic positioning.
Perfect Timing Automation:
• 8 Critical Macro Sessions:
London 1: 02:33-03:00 EST
London 2: 04:03-04:30 EST
NY AM1: 08:50-09:10 EST
NY AM2: 09:50-10:10 EST
NY AM3: 10:50-11:10 EST
Lunch: 11:50-12:10 EST
PM: 13:10-13:40 EST
Close: 15:15-15:45 EST
• Fully customizable time zones and session times
• Real-time session detection with visual zones & labels
• Automatic High/Low range tracking within each window
• Boxes, lines, and labels for clear visual reference
• Never miss optimal entry/exit timing again
Trade when institutions trade - stop guessing and start timing your setups with precision during these key liquidity windows! All session times are easily adjustable in settings to match your preferred trading hours.
Perfect for Forex, Futures, and Index traders following ICT concepts and institutional flow analysis.

Advanced Multi-Timeframe Trend & Signal System═══════════════════════════════════════════════════════════════
ADVANCED MULTI-TIMEFRAME TREND & SIGNAL SYSTEM v1.0
═══════════════════════════════════════════════════════════════
Created by: Zakaria Safri
License: Mozilla Public License 2.0
A comprehensive technical analysis tool designed for traders seeking
multi-dimensional market insights. This indicator combines proven
technical analysis methods with modern visualization techniques.
═══════════════════════════════════════════════════════════════
KEY FEATURES
═══════════════════════════════════════════════════════════════
✓ SUPERTREND SIGNAL GENERATION
- Customizable sensitivity settings
- Clear long/short entry signals
- Automatic trend direction detection
- ATR-based dynamic calculations
✓ MULTI-TIMEFRAME DASHBOARD
- Real-time trend analysis across 6 timeframes
- Synchronized trend confirmation
- Customizable table position and size
- Current: 1M, 5M, 15M, 1H, 1D coverage
✓ QQE REVERSAL DETECTION
- Quantitative Qualitative Estimation algorithm
- Early reversal signal identification
- Adjustable RSI and smoothing parameters
- Confirmation-based plotting
✓ DYNAMIC SUPPORT & RESISTANCE
- Pivot-based level calculation
- Quick and standard pivot detection
- Color-coded zones (8 levels)
- Automatic level updates
✓ MOMENTUM BREAKOUT SIGNALS
- Ichimoku-inspired calculations
- Bullish and bearish breakout detection
- Visual zone highlighting
- Trend confirmation filters
✓ RISK MANAGEMENT SYSTEM
- ATR-based stop loss calculation
- Multiple take profit targets (TP1, TP2, TP3)
- Customizable risk-to-reward ratios
- Dynamic price level tracking
- Hit detection markers
✓ VOLATILITY BANDS
- Keltner Channel implementation
- Multiple band layers (3 levels)
- EMA-based calculations
- Adaptive to market conditions
✓ TREND CLOUD VISUALIZATION
- Dual moving average cloud
- Clear trend direction indication
- Customizable color scheme
- Trend bar coloring
═══════════════════════════════════════════════════════════════
HOW TO USE
═══════════════════════════════════════════════════════════════
SETUP:
1. Add indicator to your chart
2. Configure sensitivity in Core Signals section
3. Enable desired features (signals, reversals, breakouts)
4. Set up risk management levels if trading
5. Position MTF dashboard to preference
SIGNAL INTERPRETATION:
• LONG Signal: Price crosses above Supertrend
• SHORT Signal: Price crosses below Supertrend
• REV (Reversal): QQE indicates potential trend change
• Diamond Breakouts: Momentum shift confirmation
• T1/T2/T3: Take profit level hits
MULTI-TIMEFRAME ANALYSIS:
• Green (BULL): Higher timeframe supports uptrend
• Red (BEAR): Higher timeframe supports downtrend
• Use for trend alignment and confirmation
• Best results when multiple timeframes align
RISK MANAGEMENT:
• Enable Stop Loss for automatic SL calculation
• Activate TP levels based on trading style
• Adjust Risk-to-Reward ratio (1:1 to 1:10)
• Monitor hit detection circles for exits
═══════════════════════════════════════════════════════════════
TECHNICAL SPECIFICATIONS
═══════════════════════════════════════════════════════════════
CALCULATIONS:
• Supertrend: ATR-based with customizable multiplier
• QQE: Modified RSI with Wilders smoothing
• Keltner Channels: EMA basis with ATR bands
• Pivots: Standard left/right bar methodology
• Support/Resistance: Multi-level pivot analysis
PARAMETERS:
• Supertrend Sensitivity: 0.5 to 10.0 (default: 2.0)
• RSI Period: 5 to 50 (default: 14)
• QQE Multiplier: 1.0 to 10.0 (default: 4.238)
• Risk-to-Reward: 1 to 10 (default: 4)
TIMEFRAMES:
Compatible with all timeframes. MTF dashboard displays:
• 1 Minute (1M)
• 5 Minutes (5M)
• 15 Minutes (15M)
• 1 Hour (1H)
• 1 Day (1D)
• Current chart timeframe
═══════════════════════════════════════════════════════════════
CUSTOMIZATION OPTIONS
═══════════════════════════════════════════════════════════════
VISUAL:
• Professional color scheme (Cyan/Orange)
• Adjustable table position (9 positions)
• Table size options (tiny/small/normal/large)
• Transparent zone highlighting
• Clean, modern label design
TOGGLES:
• Enable/disable any feature independently
• Show/hide signals, reversals, breakouts
• Toggle S/R levels and zones
• Control trend cloud and bands
• Master trend line optional
ALERTS:
The indicator provides visual signals that can be used with
TradingView's alert system by setting alerts on the indicator.
═══════════════════════════════════════════════════════════════
BEST PRACTICES
═══════════════════════════════════════════════════════════════
✓ Combine signals for higher probability setups
✓ Use MTF dashboard for trend confirmation
✓ Respect S/R levels for entry/exit planning
✓ Monitor QQE reversals at key price levels
✓ Adjust sensitivity based on asset volatility
✓ Test on demo/paper trading first
✓ Use proper risk management always
═══════════════════════════════════════════════════════════════
IMPORTANT DISCLAIMER
═══════════════════════════════════════════════════════════════
This indicator is a technical analysis tool and does NOT:
• Guarantee profitable trades
• Provide financial advice
• Predict future price movements with certainty
• Replace proper risk management
• Substitute for personal due diligence
Past performance does not indicate future results. All trading
involves risk. Users should:
- Understand the indicator's logic
- Test thoroughly before live trading
- Use appropriate position sizing
- Never risk more than they can afford to lose
- Consult financial advisors if needed
═══════════════════════════════════════════════════════════════
CODING STANDARDS
═══════════════════════════════════════════════════════════════
This indicator follows PineCoders Coding Conventions:
✓ Proper variable naming (prefixes: i_, f_, c_)
✓ Clear function documentation
✓ Organized code structure
✓ Type declarations
✓ Efficient calculations
✓ No repainting (confirmed signals)
✓ Proper use of request.security
═══════════════════════════════════════════════════════════════
SUPPORT & UPDATES
═══════════════════════════════════════════════════════════════
Version: 1.0
Author: Zakaria Safri
License: MPL 2.0
Last Updated: 2024
For questions, feedback, or suggestions, please comment below.
═══════════════════════════════════════════════════════════════
#trading #signals #supertrend #multiTimeframe #QQE #reversals
#supportResistance #riskManagement #trendAnalysis #momentum

Mario vr SIT MC Utilizar en el gráfico
4
1
55
🧠 Market Structure Pro System – MVR
Market Structure Pro System – MVR is an advanced trading strategy designed to detect key reversal and trend-break zones with high precision.
It combines multiple professional tools within a single algorithm — integrating market structure, dynamic channels, volatility filters, and trend confirmations — making it ideal for scalping and swing trading across different markets (Forex, indices, cryptocurrencies, or stocks).
⚙️ How it works
The algorithm performs a complete structural analysis of the market through several technical layers:
🔹 1. Price Structure (BOS, Supply & Demand)
The system automatically detects:
Order Blocks
Supply and Demand Zones
Break of Structure (BOS) to identify market structure shifts
This allows traders to recognize where price is likely to react or break a trend, anticipating major market movements.
🔹 2. Keltner Channels and Linear Regression
The strategy uses multiple Keltner Channels with different settings to measure volatility expansion and contraction.
In combination, a dynamic linear regression line shows the overall market direction, helping confirm whether price is trending or ranging.
🔹 3. Volatility and Trend Filters
It integrates several complementary systems:
ATR (Average True Range): measures the strength and volatility of price movement.
PSAR (Parabolic SAR): identifies potential trend reversals.
Supertrend: acts as the main trend filter and confirmation tool.
These filters work together to avoid false signals in ranging or low-volatility conditions.
🔹 4. Swing Highs / Lows and Dynamic Lines
The indicator also marks swing high and low points, helping visualize dynamic support and resistance levels and potential price reversal areas.
📈 Signal Interpretation
BUY signals:
Occur when price breaks a demand zone or bearish structure, while trend filters (Supertrend / PSAR) confirm bullish direction.
SELL signals:
Trigger when price breaks a supply zone or bullish structure, with bearish confirmation from the trend filters.
These conditions can be further validated by visual confirmations from the Keltner Channel or a color change in the linear regression.
Script protegido
Este script se publica como código cerrado. Sin embargo, puede utilizarlo libremente y sin limitaciones: obtenga más información aquí.
mariovr_usd
Exención de responsabilidad
La información y las publicaciones que ofrecemos, no implican ni constituyen un asesoramiento financiero, ni de inversión, trading o cualquier otro tipo de consejo o recomendación emitida o respaldada por TradingView. Puede obtener información adicional en las Condiciones de uso.
1 comentario

Name of tickerDescription:
This indicator displays the instrument’s ticker symbol and the current chart timeframe at the top center of the chart.
Features:
• Shows the ticker (e.g., BTCUSDT, AAPL, etc.).
• Displays the current timeframe (1m, 5m, 1H, 1D, etc.).
• Positioned at the top center of the chart for easy reference.
• Transparent background for minimal interference with price action.
• Lightweight and simple, no extra settings required.
Usage:
• Works with any instrument: stocks, crypto, futures.
• Useful for traders who want to always see the ticker and timeframe while analyzing the chart.
Settings:
• Text size can be adjusted in the script (text_size).
• Text and background colors can be customized (text_color, bgcolor).

ICT First Presented FVG with Volume Imbalance [1st P. FVG + VI]The indicator identifies and highlights the first presented Fair Value Gap (FVG) occurringthe morning (09:30–10:00) and afternoon (13:30–14:00) session's first 30 minutes. It includes an optional feature to extend FVG zones when a volume imbalance (V.I.) is detected, providing additional context for areas of potential price inefficiency. This powerful combination helps traders identify significant market structure gaps that often act as support/resistance zones and potential price targets.
What is an FVG?
A Fair Value Gap, often abbreviated as FVG, is a price range on a chart where there is an inefficiency or imbalance in trading. This typically happens when price moves rapidly in one direction, leaving a gap between the wicks or bodies of three consecutive candles. For example, in a bullish move, if the low of the third candle is higher than the high of the first candle, the space between them is the FVG.
What is a Volume Imbalance?
A volume imbalance is a smaller, more precise inefficiency within price action, often visible as a "crack" or thin area in the price delivery. It represents a spot where the volume traded was not balanced between buyers and sellers, often seen as a thin wick or a gap between candle bodies.
FVG + Volume Imbalance:
When you have a fair value gap that contains a volume imbalance, it becomes a more significant area of interest. ICT teaches that you should not ignore a volume imbalance if it’s part of an FVG. In fact, you should use the volume imbalance in conjunction with the FVG to define your trading range more accurately
📊 Volume Imbalance Integration
Toggle Option: Enable/disable volume imbalance detection based on preference
Extended Boundaries: When enabled, FVG boundaries expand to include volume imbalance zones
Accurate Gap Sizing: Total gap calculation includes volume imbalance extensions
Multi-Scenario Support: Handles volume imbalances at start, end, or both sides of FVG formations
📈 Multiple Display Modes
Current Day: Shows only today's FVGs for clean chart analysis
Current Week: Displays all weekly FVGs for broader context
Forward Extension: Extends FVG boxes and CE, Upper/Lower Quadrant lines into the future
📊 Visualization
Bullish FVGs appear in semi-transparent blue or purple zones (depending on session).
Bearish FVGs appear in red or orange zones.
Optional dotted lines mark the CE (midpoint) of each FVG for additional reference.
Quadrant Division: Additional 25%/75% lines for large FVGs (configurable minimum gap size)
🎯 Smart Filtering
First Presentation Only: Only displays the initial FVG in each session, avoiding clutter
Minimum Gap Size: Configurable tick-based thresholds for AM and PM sessions
Core FVG Validation: Ensures only valid Fair Value Gaps are displayed
⚙️ Configuration Options
Display Settings
Show Mode: Current Day or Current Week view
Forward Extension: 1-500 bars projection
Day Labels: Toggle weekday labels in weekly mode
Text Color: Customizable label colors
Volume Imbalance Settings
Include Volume Imbalance: Master toggle for enhanced boundary calculation
Automatic Detection: Identifies imbalance scenarios without additional input
Session-Specific Settings
AM Session (09:30-10:00):
Enable/disable AM FVG detection
Customizable bullish/bearish colors
CE line visibility and coloring
Minimum gap size in ticks
PM Session (13:30-14:00):
Enable/disable PM FVG detection
Customizable bullish/bearish colors
CE line visibility and coloring
Minimum gap size in ticks
Quadrant Settings
Enable/Disable: Toggle quadrant line display
Minimum Gap: Tick threshold for quadrant activation
Line Style: Dotted, dashed, or solid
Color: Customizable quadrant line color
How It Works
FVG Boundary Calculation
Traditional FVG: High to Low (bullish) or Low to High (bearish)
Enhanced FVG: Extended boundaries to include volume imbalance zones when enabled
Total Gap Size: Calculated including any volume imbalance extensions
Volume Imbalance Detection
The indicator identifies volume imbalances by detecting bars where:
Bullish Imbalance: Current bar's body is completely above previous bar's body
Bearish Imbalance: Current bar's body is completely below previous bar's body
⚠️ Disclaimer
This script is a technical visualization tool only.
It does not provide financial advice, signals, or predictions. Always perform independent analysis and manage risk appropriately before making trading decisions.

Matt Market EfficiencyThis is a custom Pine Script v5 indicator for TradingView that creates a Market Efficiency Heatmap as a background overlay on your chart. It visualizes how "efficient" the market's price movement is over a specified period—essentially measuring how much of the total price volatility (wiggle room) resulted in net directional progress, weighted with volume activity.
High efficiency (stronger, less transparent color) indicates a clean trend with minimal wasted movement (e.g., a strong uptrend or downtrend).
Low efficiency (fainter color) suggests choppy, inefficient price action (e.g., ranging or noisy market).
Color coding: Teal for bullish (net price up), Purple for bearish (net price down).
The heatmap intensity scales from 1% opacity (very low efficiency) to 25% opacity (high efficiency), making it subtle yet informative without overwhelming the chart.

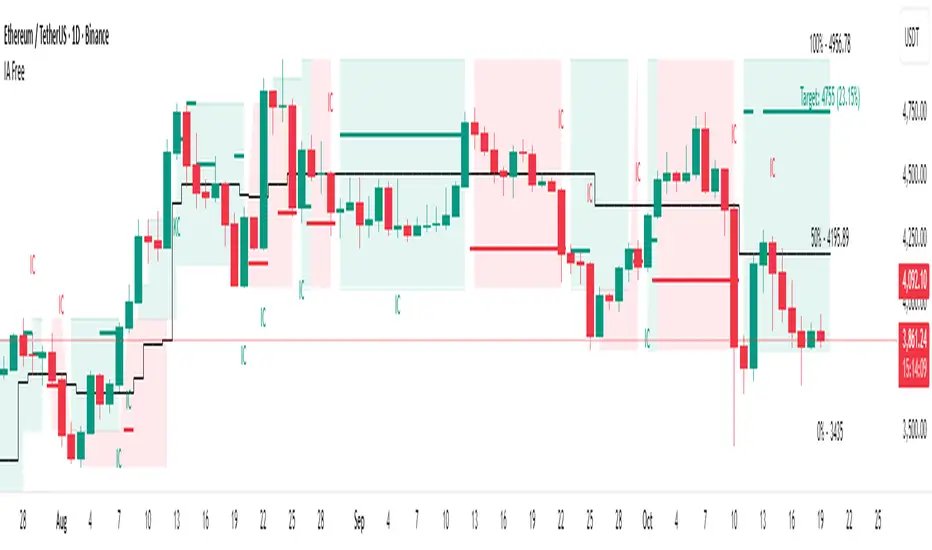
IA FreeInitiative Analysis (IA) is a concept of visual market analysis based on the idea that every price move is formed by the interaction of two forces — buyers and sellers.
The method structures price movements into a clear system of initiatives and reactions, helping you act with logic.
IA helps you see who is taking initiative, where the key levels and interest zones of both sides are, and where the balance of power may shift.
💡 How the method works
IA focuses on known price ranges — the areas where buyer or seller activity has previously appeared.
These ranges show the balance of power: this is where moves started, reactions happened, and initiative shifted.
Within these ranges, the method makes a forecast — identifying which side is now taking control (buyers or sellers) and calculating the target area for the potential move.
The goal of the method is to simplify analysis while keeping the full context, so traders and investors can see the logic behind market movement.
The method works for both short-term trading and long-term investing.
________________________________________
IA Free — Visualization of the Initiative Analysis Method
IA Free forecasts initiative on the market: which side — buyers or sellers — will take control, and calculates the target price for the potential move.
Each initiative has a beginning and an end — both in time and in price.
The indicator defines the upper and lower boundaries of the initiative, which serve as key contextual reference points for further analysis.
Forecasted initiatives are displayed on the chart and remain visible even if the move does not play out.
This allows you to:
• see when conditions for an initiative shift appeared;
• define possible correction levels.
________________________________________
Main Visualization Elements
• Buyer and seller initiative zones — show who is in control and define the upper and lower boundaries of each initiative on the chart.
• Target levels — projected direction of movement.
• Key candles (KC, IC) — candles with the highest volume inside an initiative.
KC — candle with the highest volume inside a trending initiative. Determined only after the initiative is formed and remains unchanged thereafter.
IC — candle with the highest volume inside a sideways initiative. It may change within the initiative: each new candle with higher volume inside the same initiative becomes the new IC.
• Internal range levels — the inner structure of an initiative (five adjustable user-defined levels).
You can customize the elements:
• show or hide initiative zones and targets;
• change line thickness and background transparency;
• select colors for dark or light chart themes.
________________________________________
Highlighted Settings (focus points)
• Include sideways markets in the analysis — includes ranges in initiative analysis (enabled by default).
• Sideways market activation point — the number of points after which the market is recognized as sideways (default: 4; values 6–7 filter out minor consolidations).
• Color parameters — allow you to adjust visuals for your style and chart theme.
________________________________________
Market Structure in IA
IA helps visualize three key phases of the market:
• Trend — one side dominates. On the chart, consecutive initiatives of the same color represent a continuation of the same side’s control.
• Range — balance of power; on the chart, initiatives alternate within a limited price range that may gradually expand.
• Transitional — shift of initiative and the start of a new move. On the chart within one time interval, there are two initiatives: the buyer’s initiative appears above, and the seller’s initiative appears below.
________________________________________
5 Steps for Working with IA Free
1. Identify the initiative — buyers or sellers: who controls the market and where the move is heading.
2. Check the higher timeframe context — make sure the higher timeframe doesn’t contradict the initiative on the lower one.
3. Confirm initiative strength — look for wide candles with volume, absorptions, and protection of initiative edges.
4. Define your entry trigger — retest, false breakout, KC/IC reaction, candle pattern, or your own system signal.
5. Manage risks — When trading with leverage, a stop-loss is mandatory! Define stop-loss placement according to your system (for example, beyond the initiative’s border), take profits near the target, and manage the trade following market structure.
________________________________________
Practice and Testing
Test your ideas on historical data: observe how initiatives and targets played out, how initiative edges were defended (candle patterns), and how price reacted when returning to KC/IC candles.
This helps you develop a clear understanding of market logic and confidence in decision-making.
________________________________________
Limitations
• Displays initiatives and targets only on the selected chart timeframe.
• Some IA method elements — such as internal buyer/seller zones or false breakout pattern recognition — are not implemented.
• Platform functions for alerts and data output (for custom algo strategies) are not supported.
MACD Trading System - Professional V2# MACD Trading System - Professional V2
## Executive Summary
**MACD Pro V2** is an institutional-grade trading indicator combining classical MACD analysis with advanced risk management, multi-timeframe confirmation, and comprehensive performance metrics. Designed for both manual traders and algorithmic systems, this indicator provides actionable signals with built-in stop loss calculation, take profit targets, position sizing, and trailing stop logic.
This indicator is NOT just a signal generator—it's a complete trading system with risk/reward management, performance tracking, and market regime detection.
---
## Core Features
### 1. Advanced MACD Calculation
- **Customizable EMAs**: Fast (default 8), Slow (default 21), Signal (default 5)
- **Confirmed Signals**: Uses barstate.isconfirmed to prevent repainting
- **Zero-Line Position**: Shows MACD above/below zero for momentum context
### 2. Multi-Timeframe Analysis
- **4 Simultaneous Timeframes**: 4H, 1H, 15M, 5M analyzed in parallel
- **MTF Alignment Score**: 0-100% showing consensus across timeframes
- **Smart Requests**: Uses lookahead=barmerge.lookahead_off for accuracy
### 3. Market Regime Detection
Automatically identifies current market conditions:
- **TRENDING** - ADX > 25, strong directional movement
- **RANGING** - ADX < 20, choppy sideways movement
- **VOLATILE** - ATR > 1.5x average, high uncertainty
- **NORMAL** - Default market state
### 4. Integrated Risk Management
Complete position management system:
- **Stop Loss Calculation**: Automatic SL placement based on ATR × multiplier
- **Take Profit Targets**: Calculated using Risk:Reward ratio (default 2:1)
- **Position Sizing**: Scales position size based on account risk percentage
- **Trailing Stop**: Dynamically adjusts SL as price moves in your favor
- **Drawdown Monitoring**: Tracks maximum drawdown vs account
### 5. Advanced Signal Scoring
0-100 point system weighing:
- **MTF Alignment (35%)**: Multi-timeframe confirmation strength
- **Momentum (25%)**: RSI conditions + Divergence detection
- **Volume (20%)**: Volume profile and confirmation
- **Volatility (20%)**: Market regime adjustment
**Signal Classifications:**
- **STRONG (70+)**: High confidence, tight stops, optimal entry
- **MEDIUM (50-69)**: Valid signals, confirm with price action
- **WEAK (<50)**: Low conviction, skip or use tight risk management
### 6. Professional Performance Metrics
Real-time trading statistics:
- **Win Rate**: Percentage of winning trades
- **Max Drawdown**: Largest peak-to-trough decline
- **Sharpe Ratio**: Risk-adjusted returns (anualized)
- **Profit Factor**: Gross profit / Gross loss ratio
- **Consecutive Losses**: Psychological stress indicator
### 7. Advanced Filtering System
- **Divergence Detection**: Automatic bullish/bearish divergence identification
- **Support/Resistance**: Pivot-based dynamic S/R levels
- **Volume Confirmation**: Only takes signals with volume > 1.0x average
- **Session Filter**: Optional trading hours restriction
- **Volatility Adjustment**: Reduces entries in extremely high volatility
---
## How It Works
### Signal Generation Process
**Step 1: MACD Crossover**
- Crossover of MACD above/below signal line triggers base signal
- Uses confirmed values to prevent false signals
**Step 2: Multi-Timeframe Confirmation**
- Checks trend alignment on 4H, 1H, 15M, 5M
- Calculates MTF alignment percentage
- Higher alignment = higher confidence
**Step 3: Advanced Scoring**
Signal is scored on 100-point scale:
- MTF alignment contribution (35 pts max)
- RSI + Divergence (25 pts max)
- Volume profile (20 pts max)
- Volatility regime adjustment (20 pts max)
**Step 4: Filter Application**
- Session filter (if enabled)
- Support/Resistance proximity bonus
- Volume confirmation requirement
- Drawdown check (if risk mgmt enabled)
**Step 5: Risk Calculation**
- Stop Loss placed 2 ATR below entry (customizable)
- Take Profit calculated using 2:1 risk/reward ratio
- Position size scaled to risk 1% per trade
- Trailing stop activated after 1R profit
**Step 6: Signal Output**
- Buy Signal: Green triangle (Strong) or circle (Medium)
- Sell Signal: Red triangle (Strong) or circle (Medium)
- Dashboard shows complete trade details
---
## Trading Scenarios
### Scenario 1: Strong Buy Setup
```
Requirements met:
✓ MACD crosses above signal line
✓ 3/4 timeframes bullish (4H, 1H, 15M)
✓ RSI oversold (< 30)
✓ Volume spike confirmed
✓ Score: 78/100 → STRONG BUY
System provides:
- Entry: Current price
- Stop Loss: 2 ATR below entry
- Take Profit: 2× risk distance above
- Position Size: Adjusted to 1% account risk
- Trailing Stop: Activates at 1R profit
```
### Scenario 2: Medium Buy with Divergence
```
Requirements met:
✓ MACD crosses above signal line
✓ 2/4 timeframes bullish (4H, 1H)
✓ Bullish divergence detected
✓ Price near support level
✓ Score: 62/100 → MEDIUM BUY
Considerations:
- Lower confidence → tighter risk management
- Use smaller position size
- Require additional confirmation
- Better as counter-trend entry
```
### Scenario 3: Ranging Market Filter
```
Market condition detected: RANGING
ADX < 20, sideways movement
System response:
- Reduces signal score by volatility adjustment
- May skip signals entirely
- Prioritizes higher confluence
- Warns of low trend probability
Best action: Wait for trending market
```
---
## Risk Management Deep Dive
### Stop Loss Calculation
```
Stop Loss Distance = ATR × ATR Multiplier (default 2.0)
Example:
- Current price: 1.0850
- ATR(14): 0.0045
- SL Distance: 0.0045 × 2.0 = 0.009
- BUY SL: 1.0850 - 0.009 = 1.0760
```
### Position Sizing
```
Position Size = (Account Risk % / Price Risk %)
Example:
- Risk per trade: 1% of account
- Stop distance: 0.009 on price of 1.0850
- Price risk: 0.009 / 1.0850 = 0.83%
- Position size: 1.0% / 0.83% = 1.2x (capped at 1.0x max)
```
### Trailing Stop Logic
```
Normal SL: 2 ATR below entry
Trigger Level: Entry + (Entry - SL) × Trail Activation (1.0R)
Trailing Mechanism:
- If price hits trigger, trailing SL activates
- SL moves up to: Close - 2 ATR
- SL never moves down, only up (for longs)
- Protects profits while allowing upside
```
### Drawdown Protection
```
Tracks:
- Peak equity reached
- Current drawdown from peak
- Maximum drawdown recorded
- Stops trading if max DD exceeded
Example:
- Peak: $10,000
- Current: $9,200
- Drawdown: 8%
- Max allowed: 10%
- Status: CONTINUE TRADING
```
---
## Dashboard Metrics Explained
### Market Section
- **Market Regime**: Current state (Trending/Ranging/Volatile/Normal)
- **ADX Value**: Trend strength indicator (0-100)
### Position Section
- **Current Position**: LONG, SHORT, or NONE
- **P&L**: Unrealized profit/loss percentage if in position
### Timeframe Section
- Individual 4H/1H/15M trend status
- **Alignment**: Percentage of bullish timeframes
### Risk Management Section
- **Stop Loss %**: Distance from current price
- **Take Profit %**: Target profit distance
- **Position Size**: Capital allocation multiplier
- **Risk %**: Per-trade risk percentage
### Performance Section
- **Win Rate**: % of winning trades (>60% is excellent)
- **Max DD**: Maximum drawdown experienced
- **Sharpe Ratio**: Risk-adjusted return metric
- **Profit Factor**: Ratio of profits to losses
### Indicators Section
- **RSI**: Momentum and overbought/oversold levels
- **Volume**: Current vs. average volume ratio
- **Divergence**: Active divergence detection
---
## Advanced Features
### Divergence Detection
```
Bullish Divergence:
- Price makes lower low
- MACD makes higher high
- Signals potential reversal UP
Bearish Divergence:
- Price makes higher high
- MACD makes lower low
- Signals potential reversal DOWN
Lookback: 20 bars (customizable)
```
### Support & Resistance
```
Method: Pivot High/Low detection
- Pivot Left/Right: 10 bars
- Dynamic S/R levels update as new pivots form
- Bonus score if entry near identified levels
```
### Performance Tracking
Real-time statistics calculated from:
- Win/loss signals
- Profit/loss per trade
- Consecutive losing trades
- Cumulative returns
- Standard deviation (Sharpe calculation)
Stores last 100 trades in memory for statistics.
---
## Input Parameters Explained
### MACD Settings
- **Fast EMA** (5-13): Lower = more responsive, more false signals
- **Slow EMA** (20-26): Higher = smoother, misses faster moves
- **Signal EMA** (5-9): Crossover sensitivity
### Risk Management
- **ATR Period** (default 14): Volatility measurement period
- **SL ATR Multiplier** (1.5-3.0): Stop loss tightness
- **Risk:Reward Ratio** (1-5): Profit target calculation
- **Trail Activation** (0.5-2.0): When to start trailing stop
- **Risk Per Trade** (0.1-5.0): Account risk percentage
- **Max Drawdown** (5-30%): Trading pause threshold
### Scoring Weights
Customize signal emphasis:
- **MTF Alignment** (35%): How important is multi-timeframe
- **Momentum** (25%): RSI and divergence weight
- **Volume** (20%): Volume confirmation priority
- **Volatility** (20%): Regime adjustment strength
### Advanced Filters
- **Check Divergence**: Enable/disable divergence scoring
- **Session Filter**: Restrict to specific hours
- **Min Volume Ratio**: Minimum volume for signal
### Display
- **Show Dashboard**: Main metrics table
- **Show Performance**: Trading statistics
- **Show S/R Levels**: Support/resistance visualization
---
## Best Practices
1. **Backtest Before Trading**: Test parameters on your preferred pairs
2. **Start with Strong Signals**: Use only 70+ scored signals initially
3. **Position Size**: Never risk more than 1-2% per trade
4. **Market Regime Awareness**: Skip ranging market entries
5. **Volume Confirmation**: Always check volume spikes
6. **Profit Taking**: Lock in profits at TP, don't let winners die
7. **Loss Management**: Honor stop losses, don't move them
8. **Performance Review**: Check metrics weekly, adjust if needed
---
## Trading Strategy Examples
### Conservative Strategy (Win-Rate Focus)
```
Settings:
- Signal Score Minimum: 70+ (Strong only)
- Risk Per Trade: 0.5%
- Risk:Reward: 3:1
- Position Size: 0.5x (smaller)
Targets:
- Win Rate > 65%
- Max DD < 5%
- Profit Factor > 2.0
```
### Aggressive Strategy (Profit Focus)
```
Settings:
- Signal Score Minimum: 50+ (Medium+)
- Risk Per Trade: 2%
- Risk:Reward: 1.5:1
- Position Size: 1.0x (maximum)
Targets:
- Win Rate > 55%
- Max DD < 10%
- Profit Factor > 1.5
```
### Trend Trading Strategy
```
Settings:
- Only trade when ADX > 25 (Trending)
- MTF Alignment: 3+ timeframes
- Use Trailing Stop: Yes
- Risk:Reward: 2.5:1
Focus on: Riding large moves
Best on: 4H timeframe
Pairs: Trending majors (EURUSD, GBPUSD)
```
### Divergence Trading Strategy
```
Settings:
- Signal Score Minimum: 60+
- Enable Divergence: Yes
- Volume Confirmation: Required
- Position Size: 0.75x
Focus on: Reversal entries
Best setup: Divergence at resistance/support
Risk management: Tight stops (1.5 ATR)
```
---
## Advantages
✓ Complete trading system, not just signals
✓ Built-in risk management and position sizing
✓ Real-time performance tracking
✓ Multi-timeframe confirmation reduces false signals
✓ Advanced filtering and divergence detection
✓ Market regime awareness
✓ Customizable scoring weights
✓ Professional dashboard display
✓ Support/resistance integration
✓ Trailing stop logic for profit protection
---
## Limitations
- Lagging indicator (uses confirmed bars)
- Works best on trending markets
- Not optimized for news/event trading
- Requires parameter optimization per pair
- Performance varies by timeframe
- Past performance doesn't guarantee future results
- Can produce whipsaw signals in ranging markets
---
## System Requirements
- TradingView Premium or higher (for advanced charting)
- Recommended: 4H or 1H timeframe
- Historical data: Minimum 100 bars
- Currency pairs: Works on all FX pairs, stocks, commodities
---
## Disclaimer
This indicator is provided for educational and informational purposes only. It is not financial advice and does not guarantee profits. Past performance does not predict future results.
**Important Notices:**
- Always use proper risk management
- Trade only with capital you can afford to lose
- Backtest thoroughly before live trading
- Combine with your own analysis
- Consider external market factors and news
- Monitor positions actively
- Keep emotional discipline
---
## Support & Optimization
For best results:
1. Test on your preferred instrument (6-12 months history)
2. Adjust MACD parameters to your timeframe
3. Optimize scoring weights to your style
4. Set risk management per your account size
5. Document your trade results and review weekly
6. Adapt parameters if performance degrades
This is a powerful system when used correctly. Respect the rules and let statistics work in your favor.

ATC v6ATC v6 Indicator: Automatic Session and Time Lines
Designed by Alfa Trade Club for TradingView users, ATC v6 is an advanced
indicator that automatically marks key session opens, closes, and specific times
of financial markets on your chart. This tool eliminates the need to manually track
critical trading hours, allowing you to easily analyze price action in relation to
these important timeframes.
Key Features
This indicator comes with a set of powerful features that provide the flexibility
and visual clarity traders need:
Multi-Time Zone Support: The indicator is based on the world’s three largest
financial market centers:
New York (America/New_York)
London (Europe/London)
Tokyo (Asia/Tokyo)
This allows you to accurately set the lines according to the local time of the
market you are trading.
Customizable Time Lines: Each time zone includes multiple predefined lines
(e.g., “NY Midnight,” “London Open,” “Tokyo Open”). Users can:
Enable or disable each line
Set any desired hour and minute
Assign distinct colors for clear visual separation
Pre-Session Function: This standout feature draws a dotted line a few
minutes before a main time you specify (e.g., the market open). This lets you see
the price level immediately before a key event.
Automatic Price Boxes: When the Pre-Session feature is active, the indicator
draws a colored box between the price at the pre-session moment and the price
at the main event. This box highlights the price range between the pre-
session and the main event, effectively visualizing the volatility at the
session open.
Forward-Extending Lines: All lines extend forward from the moment they are
drawn until the next day. This helps you track how these levels act as support or
resistance throughout the trading session.
Who Is It For?
Session-Focused Traders: Ideal for those tracking volatility during
London, New York, or Asian session opens.
Day Traders: Perfect for marking key economic data releases or daily
open/close levels.
Technical Analysts: A powerful tool for visually analyzing how opening
prices influence price behavior throughout the day.

Crypto Pro Strategy (Entry Model + Risk)Imma try to use this on a prop firm but if you want to use it itss free or im going to try to make it free

FOREXSOM Session Boxes (Local Time) — Asian, London & New YorkFOREXSOM Session Boxes (Local Time) highlights the three major Forex sessions — Asian, London, and New York — using your chart’s local timezone automatically.
This indicator helps traders visualize market structure, liquidity zones, and timing across global trading hours with accuracy and clarity.
Key Features
Automatically adjusts to your chart’s local timezone
Highlights Asian, London, and New York sessions with clean color zones
Works on all timeframes and asset classes
Ideal for Smart Money Concepts (SMC), ICT, and price action strategies
Helps identify range breakouts, session highs/lows, and liquidity grabs
How It Works
Each session box updates in real time to show the current range as the market develops.
The boxes reset at the end of each session, making it easy to compare volatility and liquidity shifts between regions.
Sessions (default times):
Asian: 17:00 – 03:00
London: 02:00 – 11:00
New York: 07:00 – 16:00
How to Use
Add the indicator to your chart.
Ensure your chart timezone matches your local time in chart settings.
Watch session ranges form and look for liquidity sweeps or breakouts between overlaps (London/New York).
Created by FOREXSOM
Empowering traders worldwide with precision-built tools for Smart Money and institutional trading education.

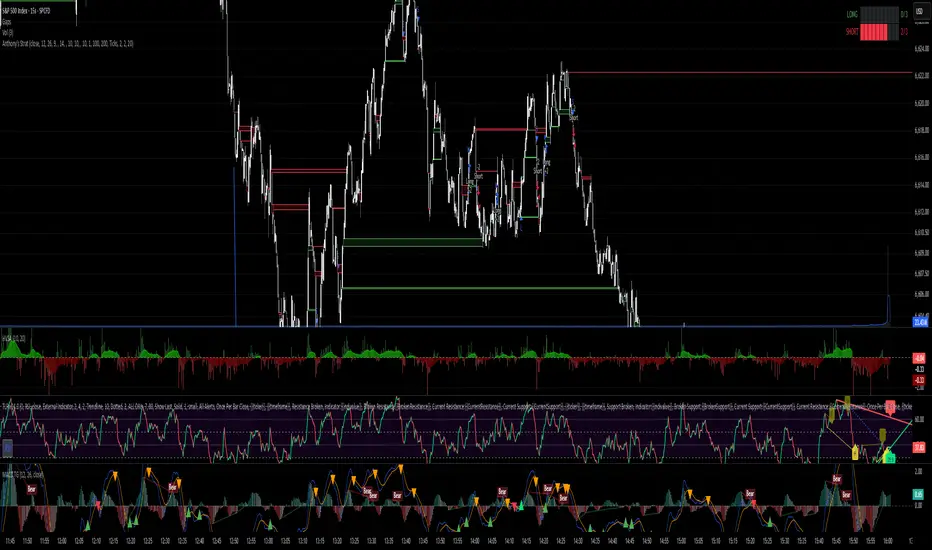
Anthony's trading strategyWait for signal to print and a continuation candle to enter trade. If no continuation candle, disregard signal.
Algo Trading Signals - Buy/Sell System# 📊 Algo Trading Signals - Dynamic Buy/Sell System
## 🎯 Overview
**Algo Trading Signals** is a sophisticated intraday trading indicator designed for algorithmic traders and active day traders. This system generates precise buy and sell signals based on a dynamic box breakout strategy with intelligent position management, add-on entries, and automatic target adjustment.
The indicator creates a reference price box during a specified time window (default: 9:15 AM - 9:45 AM IST) and generates high-probability signals when price breaks out of this range with confirmation.
---
## ✨ Key Features
### 📍 **Smart Signal Generation**
- **Primary Entry Signals**: Clear buy/sell signals on confirmed breakouts above/below the reference box
- **Confirmation Bars**: Reduces false signals by requiring multiple bar confirmation before entry
- **Cooldown System**: Prevents overtrading with configurable cooldown periods between trades
- **Add-On Positions**: Automatically identifies optimal pullback entries for scaling into positions
### 📦 **Dynamic Reference Box**
- Creates a high/low range during your chosen time window
- Automatically updates after each successful trade
- Visual box display with color-coded boundaries (red=resistance, green=support)
- Mid-level reference line for market structure analysis
### 🎯 **Intelligent Position Management**
- **Automatic Target Calculation**: Sets profit targets based on average move distance
- **Add-On System**: Up to 3 additional entries on optimal pullbacks
- **Position Tracking**: Monitors active trades and remaining add-on capacity
- **Auto Box Shift**: Adjusts reference box after target hits for continued trading
### 📊 **Visual Clarity**
- **Color-Coded Labels**:
- 🟢 Green for BUY signals
- 🔴 Red for SELL signals
- 🔵 Blue for ADD-ON buys
- 🟠 Orange for ADD-ON sells
- ✓ Yellow for Target hits
- **TP Level Lines**: Dotted lines showing current profit targets
- **Hover Tooltips**: Detailed information on entry prices, targets, and add-on numbers
### 📈 **Real-Time Statistics**
Live performance dashboard showing:
- Total buy and sell signals generated
- Number of add-on positions taken
- Take profit hits achieved
- Current trade status (LONG/SHORT/None)
- Cooldown timer status
### 🔔 **Comprehensive Alerts**
Built-in alert conditions for:
- Primary buy entry signals
- Primary sell entry signals
- Add-on buy positions
- Add-on sell positions
- Buy take profit hits
- Sell take profit hits
---
## 🛠️ Configuration Options
### **Time Settings**
- **Box Start Hour/Minute**: Define when to begin tracking the reference range
- **Box End Hour/Minute**: Define when to lock the reference box
- **Default**: 9:15 AM - 9:45 AM (IST) - Perfect for Indian market opening range
### **Trade Settings**
- **Target Points (TP)**: Average move distance for profit targets (default: 40 points)
- **Breakout Confirmation Bars**: Number of bars to confirm breakout (default: 2)
- **Cooldown After Trade**: Bars to wait after closing position (default: 3)
- **Add-On Distance Points**: Minimum pullback for add-on entry (default: 40 points)
- **Max Add-On Positions**: Maximum additional positions allowed (default: 3)
### **Display Options**
- Toggle buy/sell signal labels
- Show/hide trading box visualization
- Show/hide TP level lines
- Show/hide statistics table
---
## 💡 How It Works
### **Phase 1: Box Formation (9:15 AM - 9:45 AM)**
The indicator tracks the high and low prices during your specified time window to create a reference box representing the opening range.
### **Phase 2: Breakout Detection**
After the box is locked, the system monitors for:
- **Bullish Breakout**: Price closes above box high for confirmation bars
- **Bearish Breakout**: Price closes below box low for confirmation bars
### **Phase 3: Signal Generation**
When confirmation requirements are met:
- Entry signal is generated with clear visual label
- Target price is calculated (Entry ± Target Points)
- Position tracking activates
- Cooldown timer starts
### **Phase 4: Position Management**
During active trade:
- **Add-On Logic**: If price pulls back by specified distance but stays within favorable range, additional entry signal fires
- **Target Monitoring**: Continuously checks if price reaches TP level
- **Box Adjustment**: After TP hit, box automatically shifts to new range for next opportunity
### **Phase 5: Trade Exit & Reset**
On target hit:
- Position closes with TP marker
- Statistics update
- Box repositions for next setup
- Cooldown activates
- System ready for next signal
---
## 📌 Best Use Cases
### **Ideal For:**
- ✅ Intraday breakout trading strategies
- ✅ Algorithmic trading systems (via alerts/webhooks)
- ✅ Opening range breakout (ORB) strategies
- ✅ Index futures (Nifty, Bank Nifty, Sensex)
- ✅ High-liquidity stocks with clear ranges
- ✅ Automated trading bots
- ✅ Scalping and day trading
### **Markets:**
- Indian Stock Market (NSE/BSE)
- Futures & Options
- Forex pairs
- Cryptocurrency (adjust timing for 24/7 markets)
- Global indices
---
## ⚙️ Integration with Algo Trading
This indicator is **algo-ready** and can be integrated with automated trading systems:
1. **TradingView Alerts**: Set up alert conditions for each signal type
2. **Webhook Integration**: Connect alerts to trading platforms via webhooks
3. **API Automation**: Use with brokers supporting TradingView integration (Zerodha, Upstox, Interactive Brokers, etc.)
4. **Signal Data Access**: All signals are plotted for external data retrieval
---
## 📖 Quick Start Guide
1. **Add Indicator**: Apply to your chart (works best on 1-5 minute timeframes)
2. **Configure Time Window**: Set your desired box formation period
3. **Adjust Parameters**: Tune confirmation bars, targets, and add-on settings to your trading style
4. **Set Alerts**: Create alert conditions for automated notifications
5. **Backtest**: Review historical signals to validate strategy performance
6. **Go Live**: Enable alerts and start receiving real-time trading signals
---
## ⚠️ Risk Disclaimer
This indicator is a **tool for analysis** and does not guarantee profits. Trading involves substantial risk of loss. Always:
- Use proper position sizing
- Implement stop losses (not included in this indicator)
- Test thoroughly before live trading
- Understand market conditions
- Never risk more than you can afford to lose
- Consider your risk tolerance and trading experience
**Past performance does not indicate future results.**
## 🔄 Version History
**v1.0** - Initial Release
- Dynamic box formation system
- Confirmed breakout signals
- Add-on position management
- Visual signal labels and statistics
- Comprehensive alert system
- Auto-adjusting target boxes
---
## 📞 Support & Feedback
If you find this indicator helpful:
- ⭐ Please leave a like/favorite
- 💬 Share your feedback in comments
- 📊 Share your results and improvements
- 🤝 Suggest features for future updates
---
## 🏷️ Tags
`breakout` `daytrading` `signals` `algo` `automated` `intraday` `ORB` `opening-range` `buy-sell` `scalping` `futures` `nifty` `banknifty` `algorithmic` `box-strategy`
*Remember: The best indicator is combined with proper risk management and trading discipline.* Use it at your own rist, not as financial advie

ICT Suspension BlocksICT Suspension Block (SB) Indicator
The ICT Suspension Block (SB) is a three-candle price action pattern that often act as support or resistance zones. A Suspension Block is a three-candle pattern showing a brief pause in price efficiency before continuation. These zones frequently serve as areas where price may later return, offering traders potential trading opportunities.
Pattern Definition
A Suspension Block forms when three consecutive candles move in the same direction but leave behind a specific body-to-body imbalance. (a gap between the bodies of consecutive candles).
Bullish Suspension Block (+SB):
All three candles are bullish (close > open).
Candle 1 close < Candle 2 open.
Candle 2 close < Candle 3 open.
Zone = from Candle 1 close to Candle 3 open.
Bearish Suspension Block (-SB):
All three candles are bearish (close < open).
Candle 1 close > Candle 2 open.
Candle 2 close > Candle 3 open.
Zone = from Candle 1 close to Candle 3 open.
These zones mark areas where price was temporarily imbalanced. Price often “respects” these levels later, either bouncing from them or breaking through them, which can provide valuable trade context.
Application
Suspension Blocks are used to mark areas where price may later react:
A Bullish SB can act as potential support.
A Bearish SB can act as potential resistance.
The significance of a block depends on market context. Blocks formed during strong, impulsive moves tend to be more meaningful than those in consolidation.
How the Indicator Works
Identifies bullish and bearish suspension blocks using body gap imbalances.
Draws colored zones (green = bullish, red = bearish) directly on the chart.
Extends zones forward until they are inversed by price action.
Once inversed, zones switch to a neutral color, allowing traders to annotate/extend them manually if desired.
Includes Consequent Encroachment (CE) lines (the 50% equilibrium of the block), which many traders use as reaction levels.
Features
Customizable colors for bullish, bearish, and inversed zones
Extend blocks indefinitely forward or limit them to a set number of bars
Adjustable maximum number of displayed blocks for performance control
Consequent Encroachment (CE) (Middle Point, 50%, Equilibrium) line feature
Configurable CE line style, color, and width
How to Use It
Trend Following: Blocks forming in the direction of trend can act as continuation zones.
Reversals: Opposite-direction blocks may signal exhaustion and potential turning points.
Liquidity Levels: CE lines (50% of block) often serve as reaction levels for entries, partials, or stop placement.
Context is Key: Suspension Blocks should not be used in isolation. Combine them with market structure, liquidity pools, or other confluence factors for best results.
Notes
This indicator is intended for technical analysis and research.
It should always be combined with proper risk management and a complete trading plan.
Past market behavior does not guarantee future results.

CRT + Daily Bias - Milana Trades
This indicator merges Candle Range Theory (CRT) with a Daily & Weekly Bias model, offering traders a complete view of both short-term price traps and higher-timeframe market direction. It is designed to highlight potential liquidity traps, reversals, and directional bias in a structured and visually intuitive format.
🔹 1. Candle Range Theory (CRT)
The CRT module detects false breakout candles (trap candles) and plots key high/low levels to mark significant turning points.
Bullish CRT
Occurs when price makes a lower low than the previous candle but closes bullish (close > open).
→ Suggests a possible upside reversal.
Bearish CRT
Occurs when price makes a higher high than the previous candle but closes bearish (close < open).
→ Suggests a possible downside reversal.
When a CRT is detected:
Dotted lines and levels are drawn from the trap candle’s high/low.
Labels such as CRT, CRT H, and CRT L appear for easy visualization.
Previous CRT structures can auto-clear when new traps form.
Alerts trigger once a trap is confirmed on candle close.
🔹 2. Daily & Weekly Bias
The Bias module determines market direction using daily and weekly candle structure. It evaluates:
Breaks above/below previous highs and lows.
Failed breaks (false moves beyond prior levels).
Inside bars (neutral range conditions).
Bias Logic Summary:
Close Above Previous High → Bullish
Close Below Previous Low → Bearish
Failed Break Above → Bearish
Failed Break Below → Bullish
Inside Range → Neutral
Both Daily and Weekly bias values are displayed in an on-chart table for quick context.
⚠️ Note:
The bias readings are technical references, not trading signals. Always combine them with your own analysis, context, and market awareness.
🔹 3. Bias Table
A clean table (top-right by default) displays:
Timeframe (Daily / Weekly)
Current Bias (Bullish, Bearish, Neutral)
Reason for bias (breakout, failure, or inside bar)
The table is fully customizable, allowing you to adjust:
Header and text colors
Background and border styles
Display of specific timeframes (Daily / Weekly)
🔹 4. Alerts
Real-time alerts notify you when:
Bullish CRT is detected
Bearish CRT is detected
Alerts only trigger on candle close for accuracy and reduced false signals.
🔹 5. Settings
CRT Module
Length: Number of bars CRT levels extend.
Clear Broken: Automatically removes old CRT levels when new traps form.
Trap Candle Colors: Customize bullish/bearish candle highlights.
Line & Label Style: Full control of label size, color, and line styling.
Bias Module
Show Table: Toggle on/off.
Show Daily / Weekly Bias: Select which to display.
Color Customization: Set colors for bias states and table design.
🔹 6. How to Use
Watch for CRT labels forming near major or liquidity areas.
Check the Daily/Weekly Bias Table for trend confirmation.
Align CRT signals with the bias direction for higher-probability setups.
Use alerts to stay informed without constantly monitoring charts.

BTC 5-MA Multi Cross Strategy By Hardik Prajapati Ai TradelabThis strategy is built around the five most powerful and commonly used moving averages in crypto trading — 5, 20, 50, 100, and 200-period SMAs (Simple Moving Averages) — applied on a 1-hour Bitcoin chart.
Core Idea:
The strategy aims to identify strong bullish trends by confirming when the price action crosses above all key moving averages. This alignment of multiple MAs indicates momentum shift and helps filter out false breakouts.
⸻
⚙️ How It Works:
1. Calculates 5 Moving Averages:
• 5 MA → Short-term momentum (fastest signal)
• 20 MA → Near-term trend confirmation
• 50 MA → Mid-term trend filter
• 100 MA → Long-term trend foundation
• 200 MA → Macro-trend direction (strongest support/resistance)
2. Buy Condition (Entry):
• A Buy is triggered when:
• The price crosses above the 5 MA, and
• The closing price remains above all other MAs (20, 50, 100, 200)
This signals that momentum is aligned across all time horizons — a strong uptrend confirmation.
3. Sell Condition (Exit):
• The position is closed when price crosses below the 20 MA, showing weakness in short-term momentum.
4. Visual Signals:
• 🟢 BUY triangle below candles → Entry signal
• 🔴 SELL triangle above candles → Exit signal
• Colored MAs plotted for trend clarity.
⸻
📈 Recommended Usage:
• Chart: BTC/USDT
• Timeframe: 1 Hour
• Type: Trend-following crossover strategy
• Ideal for: Identifying major breakout moves and confirming trend reversals.
⸻
⚠️ Notes:
• This script is meant for educational and backtesting purposes only.
• Always apply additional confirmation tools (like RSI, Volume, or VIX-style filters) before live trading.
• Works best during trending markets; may produce whipsaws in sideways zones.

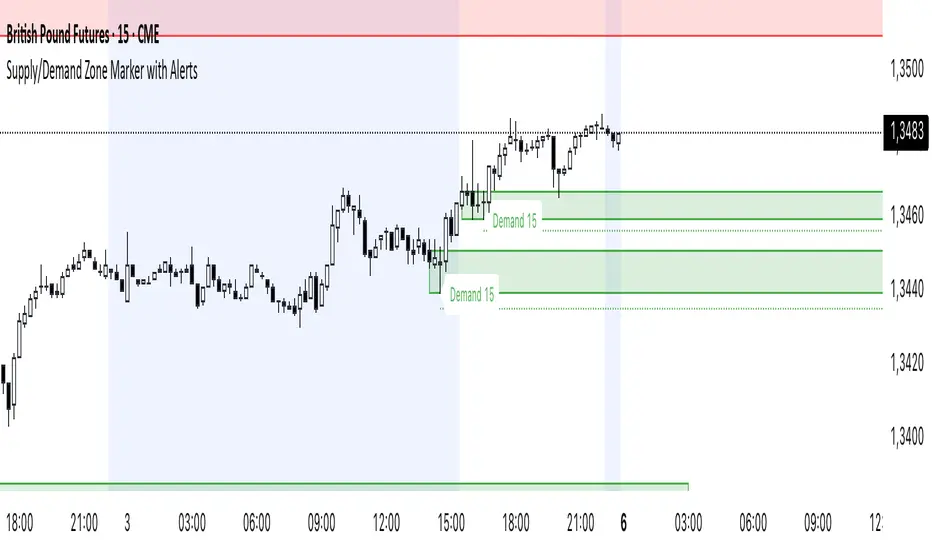
Supply/Demand Zone Marker mit AlertsSupply and Demand Zones Marker. You can costumize the length of the Zone, the Body Wick Ratio and if it automatically revome old Zones.
US Government Shutdowns – Full History (with durations)이 지표는 1976년 이후 실제로 정부 기능이 중단된 모든 미국 정부 셧다운 기간을 시각화합니다.
S&P500 또는 지정한 심볼 차트 위에 각 셧다운 구간을 세로선과 음영 박스로 표시하고,
각 기간의 지속일수(일) 라벨을 함께 제공합니다.
데이터 출처: 미국 하원 공식 기록 (U.S. House History – Funding Gaps and Shutdowns in the Federal Government)
기능
• 모든 셧다운 구간 자동 표시
• 음영/세로선/라벨 개별 On-Off 가능
• 진행 중인 셧다운은 자동으로 ‘현재 시점까지’ 확장 표시
시장 변동성 분석, 정책 이벤트 리스크 평가, 장기 매크로 백테스트 등에 유용합니다.
This indicator visualizes all official US government shutdown periods since 1976 directly on any selected chart (default: S&P 500).
Each shutdown period is shown with vertical lines and shaded boxes, along with labels indicating the duration in days.
Data Source: U.S. House History – Funding Gaps and Shutdowns in the Federal Government
Features:
• Displays every historical shutdown automatically
• Optional shading, lines, and duration labels
• Ongoing shutdowns dynamically extend to the current date
Useful for analyzing volatility around fiscal policy events and long-term macro correlations.
