Bitcoin Correlation MapHello everyone,
This indicator shows the correlation coefficients of altcoins with bitcoin in a table.
What is the correlation coefficient?
The correlation coefficient is a value that takes a value between 0 and 1 when a parity makes similar movements with the reference parity, and takes a value between 0 and -1 when it makes opposite movements.
In order to obtain more meaningful and real-time results in this indicator, the weighted average of the correlation values of the last 200bar was used. You can change the bar length as you wish. With the correlation value, you can see the parities that have similar movements with bitcoin and integrate them into your strategy.
You can change the coin list as you wish, and you can also calculate their correlation with etherium instead of bitcoin .
The indicator shows the correlation value of 36 altcoins at the moment.
The indicator indicates the color of the correlated parities as green and the color of the inversely correlated parities as red.
Cheers
Correlation

Correlation Coefficient: Visible Range Dynamic Average R -Correlation Coefficient with Dynamic Average R (shows R average for the visible chart only, changes as you zoom in or out)
-Label: Vis-Avg-R = Visable Average R
-the Correlation Coefficient function for Pearson's R is taken from "BA🐷 CC" indicator by @balipour (highly recommended; more thorough treatment of R and other stats, but without the dynamic average)
-I wrote this primarily to add a dynamic Average R, showing correlation for arbitrary start times/end times; whether it be the last month, last year, of some specific period from the past (backtest mode)
-I have been using this to get an idea of correlation regimes over time between Bonds vs Stocks (ZB1! vs ES1!).
-As you see from the above, most of 2022 has seen an unusually strong positive correlation between Bonds and Stocks
~~inputs:
-lookback length for calculation of R
-Backtest mode (true by default): displays Average R for ONLY the visible range displayed on any part of chart history (LHS to RHS of screen only)
-source for both Ticker and compared Asset (close, open, high, low, ohlc4.. etc)
~~some other assets worth comparing:
Aussie vs Gold; Aussie vs ES; Btc vs ES; Copper vs ES

Correlated ATR MA | AdulariHow do I use it?
Never use this indicator as standalone trading signal, it should be used as confluence.
When the price is above the moving average this shows the bullish trend is strong.
When the price is below the moving average this shows the bearish trend is strong.
When the moving average is purple, the trend is bullish, when it is gray, the trend is bearish.
Features:
Purple line for bullish trend and gray line for bearish trend.
Custom formula combining an ATR and Hull MA to clearly indicate trend strength and direction.
Unique approach to moving averages by taking the average of 3 types of MA's combined with custom ATR's.
How does it work?
1 — ATR value is calculated, then the correlation between the source and ATR is calculated.
2 — Signal value is calculated from the difference between the previous source and ATR values.
3 — Final value is being calculated using the following formula:
cor * target + (1 - cor) * nz(atr , target)
4 — Moving average is calculated by getting the average of 3 values: a normal HMA, HMA plus final value, and HMA minus final value.

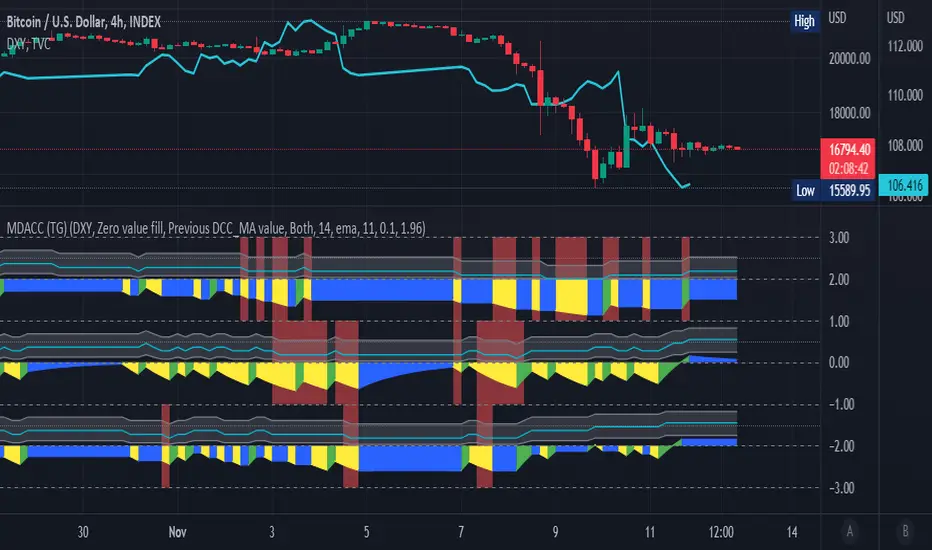
Multi Delta-Agnostic Correlation Coefficient (tartigradia)Display three DACC plots simultaneously, to visualize both directional (up on top, down at bottom) and adirectional DACC (in the middle) simultaneously.
Delta Agnostic Correlation calculates a correlation between two symbols based only on the sign of their changes using a Sign Test (en.m.wikipedia.org), regardless of the amplitude of price change. Compared to a standard Pearson correlation (quantitative test), Sign Test correlations (discrete test) are highly sensitive to directional change with 0 lag, at the expense of lacking sensitivity to quantity correlation (ie, it does not matter if changes are big or small).
Hence, this Delta-Agnostic Correlation Coefficient (DCC or DACC) indicator is better used to detect early changes in correlations, and then confirmation with a typical Pearson correlation or a non-parametric Spearman test or Mutual Information (all three are quantitative tests, hence accounting for quantity and not just direction) can allow to be more sensitive to quantities too and hence be a robust combination to demonstrate strong correlations both in direction and amplitude.
Adequate statistical significance testing, using a two-sided binomial statistical test, is also implemented. Note however that one assumption of the sign test may here be violated: independence of observations for each symbol. If you assume the market is not acting on a random walk, then there is a temporal autocorrelation, and this biases the sign test. However, in practice, the test works well enough.
The directional variants of the test allow to test the correlation hypothesis only if the index symbol goes into one direction. For example, if we suspect that the index symbol is correlated with the current symbol but only when the index symbol is bullish, we can select "Up" to test this hypothesis. Note that given the specificities of how directional and adirectional tests differ in how they work, the default fill is different: zero-value fill for adirectional test to simulate how price action tend to lose momentum during market close periods, previous DCC_MA (= no change in DCC value) during both market close periods and when the direction is opposite for the directional variants of the test, so that while the market is moving opposite, we don't lose the statistical significance built up to now, otherwise it would be nonsensical (for the directional tests).
For more information on the theory behind, see the original DACC indicator, which is the same script but with only one plot:
Volatility Inverse Correlation CandleThis is an educational tool that can help you find direct or inverse relations between two assets.
In this case I am using VIX and SPX .
The way it works is the next one :
So I am looking at the current open value of VIX in comparison with the previous close ( if it either above or below) and after on the SPX I am looking into the history and see for example which type of candle we had in respect with the opening value from VIX .
So for example, lets imagine that today is monday, and the weekly open value from VIX was higher than previous friday close value. Now I am going to see with the inverse correlation , if based on this idea, the current weekly candle from SPX finished in a bear candle.
The same can be applied for the bearish situation, so if we had an open from VIX lower than previous close, we are looking to check the SPX bull candle accuracy.
At the same time, for a different type of calculation I have added an internal lookup into heikin ashi values.
If you have any questions please let me know !

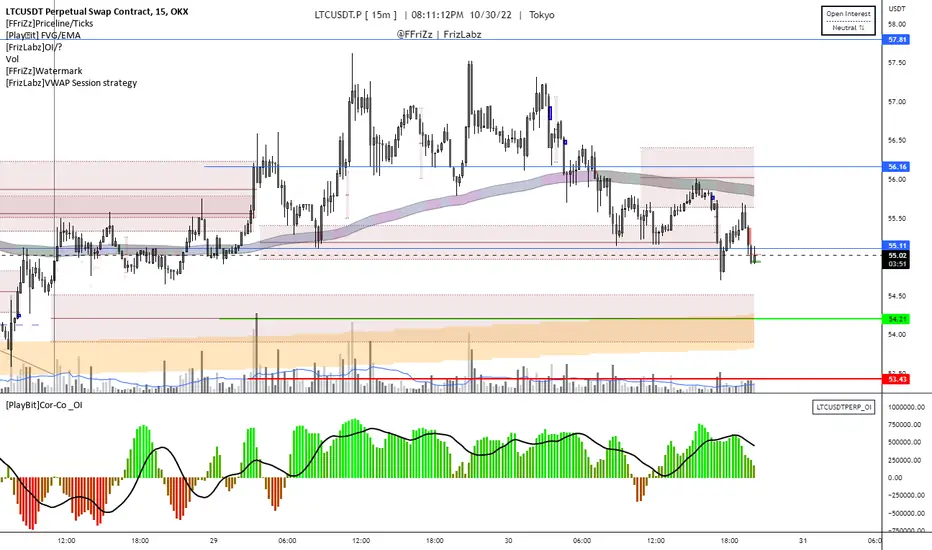
[PlayBit]Correlation-Co _OI Correlation-Co _OI
This Indicator uses a Correlation Coefficient to compare a Crypto Currency to the Binance Open Interest feed if the data is provided
A move in the same direction is indicated with a positive value (the indicator will move up)
A move in the opposite direction the indicator will indicate with a negative value (the indicator will move down)
If both are moving in the same direction and are converging or diverging this will be shown by larger values for divergence and smaller for convergence but will be a positive value
Negative values are shown when price and _OI are moving opposite each other
You can toggle the auto Open Interest option in the settings to use something other than Open Interest if you would like
I still need to add a visual showing when longs are unwinding or opening and when shorts are covering or opening
This is a concept that I made for @Johnny a while back and I'm republishing public from private
This can be useful when comparing a Asset with its Open Interest
The main bit of code was taken from:
by @mortdiggiddy
Let me know if you have any Ideas or suggestions or if I overlooked something
Hope you enjoy,
@FFriZz | @FrizLabz
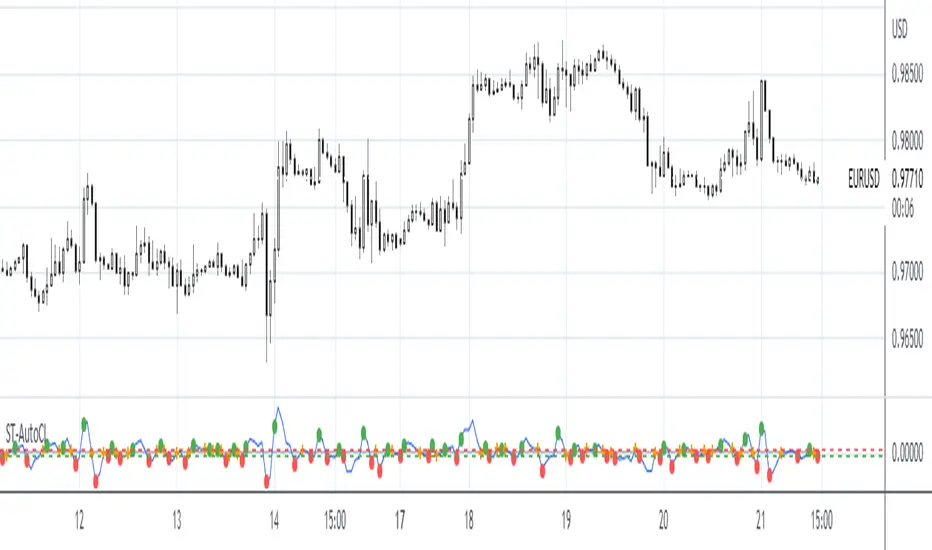
SpreadTrade - Auto-Cointegration (ps5)Decsription: Auto-Cointegration-Based Pair Trading Strategy (revised version)
To review, there are three popular styles of Pair trading: distance-based pair trading, correlation-based pair trading and cointegration-based pair trading. Typically, they require preliminary statistical estimation of the viability of the corresponding strategy.
Basically a pair trade strategy boils down to shorting the outperforming instrument and going long on the underperforming instrument whenever the temporary correlation weakens which means one instrument is going up and another is going down. Apart from the typical cointegration strategy which employs two cointegrated instruments, this script uses just one instrument, in base timeframe and in lagged timeframe, actually making it an auto-cointegration, or better still, an auto-correlation strategy.
Notice that each moving average function may require different Threshold settings.The orange cross symbol indicates the exit points. To filter out the signals use higher values for the LongWindow and the Threshold parameters. Also pay attention that in some cases with some moving averages the color of the signals has to be inverted.
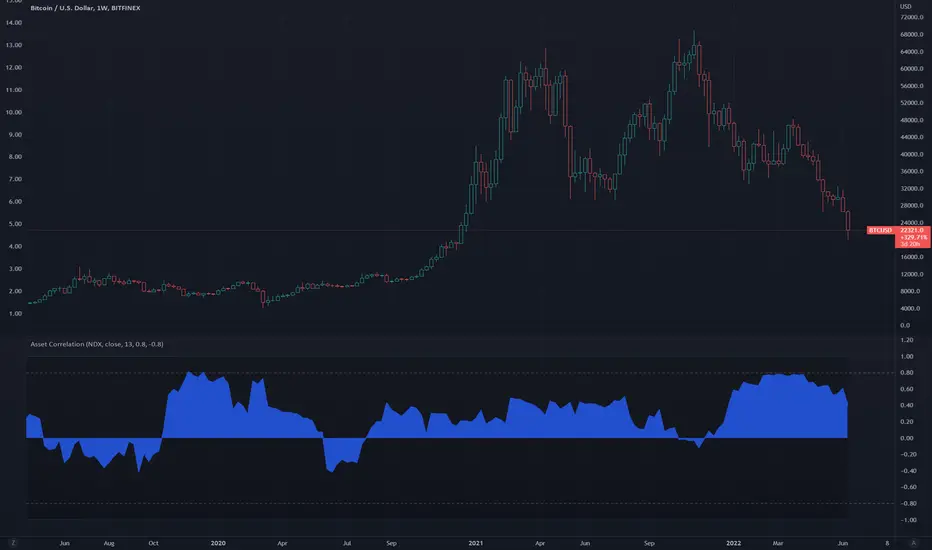
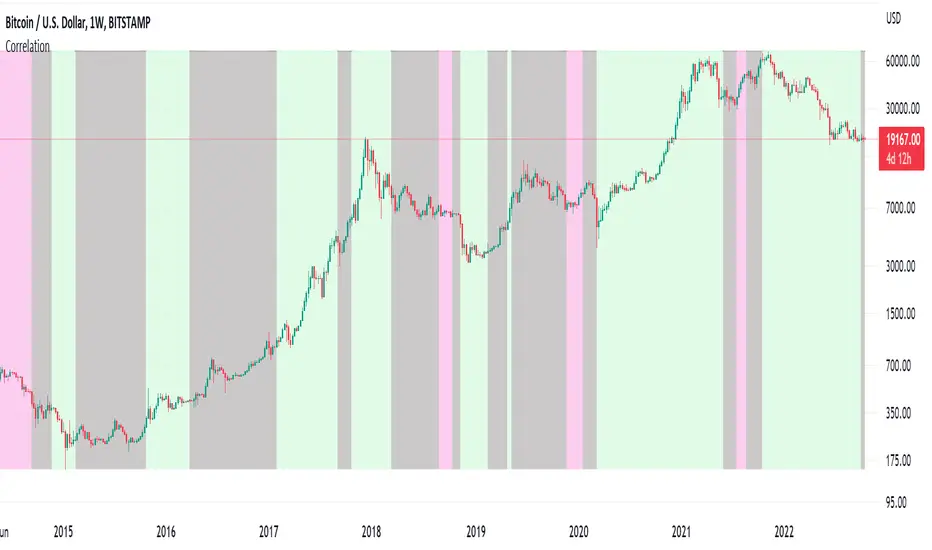
Correlation ZonesThis indicator highlights zones with strong, weak and negative correlation. Unlike standard coefficient indicator it will help to filter out noise when analyzing dependencies between two assets.
With default input setting Correlation_Threshold=0.5:
- Zones with correlation above 0.5, will be colored in green (strong correlation)
- Zones with correlation from -0.5 to 0.5 will be colored grey (weak correlation)
- Zones with correlation below -0.5 will be colore red (strong negative correlation)
Input parameter "Correlation_Threshold" can be modified in settings.
Provided example demonstrates BTCUSD correlation with NASDAQ Composite . I advice to use weekly timeframe and set length to 26 week for this study
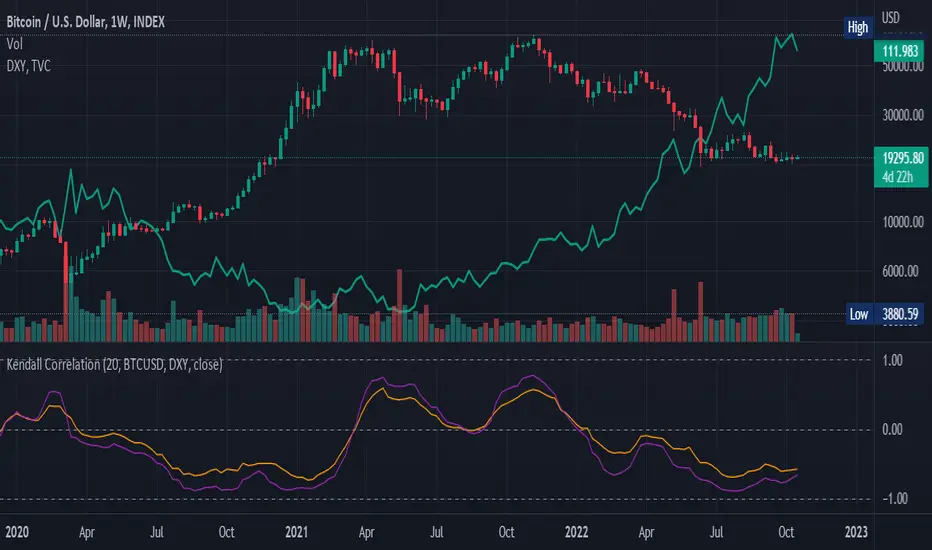
Kendall Rank Correlation Coefficient (alt)This is a non-parametric correlation statistical test, which is less sensitive to magnitude and more to direction, hence why some people call this a "concordance test".
This indicator was originally created by Alex Orekhov (everget), if you like this one, please show the original author some love:
This version is extended by tartigradia (2022) to make it more readily useable:
* Update to pinescript v5
* Default compare to current symbol (instead of only fixed symbols)
* Add 1.0, 0.0 and -1.0 correlation levels lines.
This indicator plots both the Kendall correlation in orange, and the more classical parametric Pearson correlation in purple for comparison. Either can be disabled in the Style tab.
Correlation with P-Value & Confidence Interval (alt)Shows the Pearson correlation between two symbols, including statistical significance test.
This is a fork of the original script by Balipour, with the addition of EMA that can be used instead of SMA in the Pearson correlation as an attempt to capture correlation trend changes more quickly, and conversion to pinescript v5. In the end, the EMA does not help much, for a faster capture of correlation trend changes, another kind of correlation is necessary, such as sign test correlation (another one of my indicators implement this idea).
Please show the original indicator's author some love if you appreciate this work:

Delta-Agnostic Correlation Coefficient (alt)Calculate a sort of correlation between two symbols based only on the sign of their changes, regardless of the amplitude of price change.
When positive, the two symbols tend to move together. When negative, the symbols move in opposite directions.
Since there is no significance calculation, and that the result is binary, keep in mind that correlation will always tend to go towards 1 or -1 even when there is no correlation. To reduce this issue, an EMA or SMA is applied to smooth out transitions: SMA smoothes over the selected length period but adds lag, whereas EMA smoothes amplitude without any additional lag. Hence, to know if the correlation is true or not, try to look at the amplitude and the number of consecutive days the correlation is maintained (both quantities are related), because when the correlation is spurious, it will tend to switch more or less alternatively between 1 and -1 and hence will hover around 0, whereas if the correlation is true, it will get further away from 0 and closer to 1 or -1.
In addition, since there is some time lag for the correlation to switch sign, the area is colored to know the current candle's correlation, regardless of past data's correlation: blue is a positive correlation (1), yellow is negative. The coloring can allow to know a trend reversal early on, but it's noisy.
Finally, symbols with closing days are better accounted for, with the correlation set to 0 on closed days (e.g., on week-ends), and the area is then colored in gray to signal that there is no new correlation data.
This is an improved fork over the original indicator by alexjvale, please show him some love if you like this work:

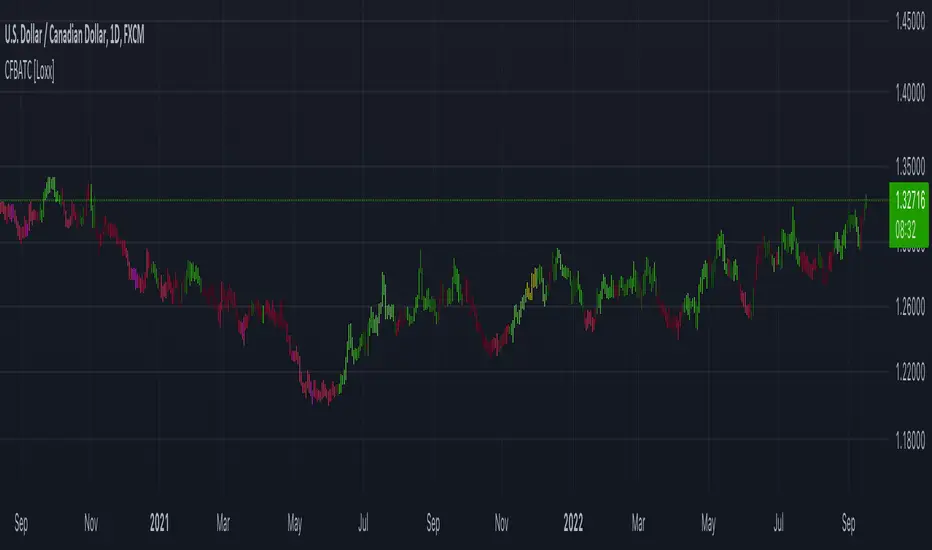
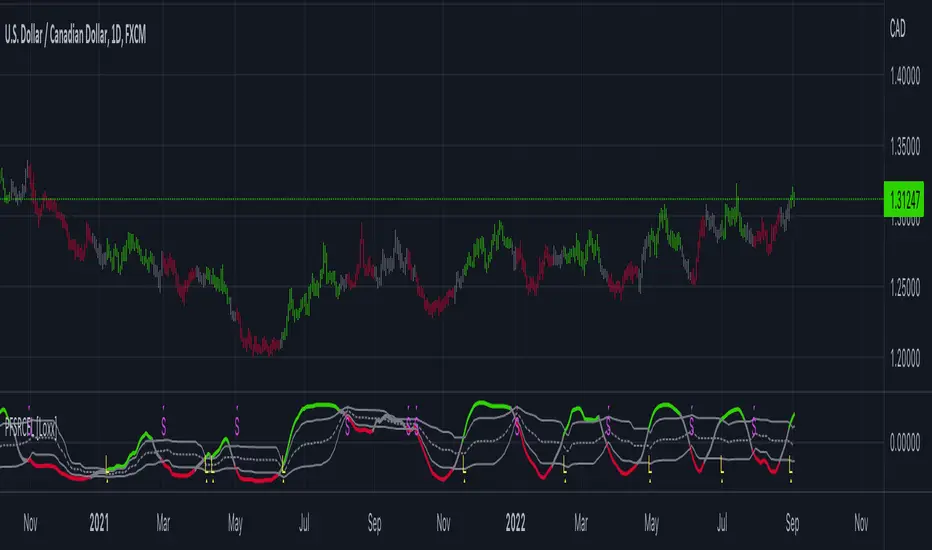
CFB-Adaptive Trend Cipher Candles [Loxx]CFB-Adaptive Trend Cipher Candles is a candle coloring indicator that shows both trend and trend exhaustion using Composite Fractal Behavior price trend analysis. To do this, we first calculate the dynamic period outputs from the CFB algorithm and then we injection those period inputs into a correlation function that correlates price input price to the candle index. The closer the correlation is to 1, the lighter the green color until the color turns yellow, sometimes, indicating upward price exhaustion. The closer the correlation is to -1, the lighter the red color until it reaches Fuchsia color indicating downward price exhaustion. Green means uptrend, red means downtrend, yellow means reversal from uptrend to downtrend, fuchsia means reversal from downtrend to uptrend.
What is Composite Fractal Behavior ( CFB )?
All around you mechanisms adjust themselves to their environment. From simple thermostats that react to air temperature to computer chips in modern cars that respond to changes in engine temperature, r.p.m.'s, torque, and throttle position. It was only a matter of time before fast desktop computers applied the mathematics of self-adjustment to systems that trade the financial markets.
Unlike basic systems with fixed formulas, an adaptive system adjusts its own equations. For example, start with a basic channel breakout system that uses the highest closing price of the last N bars as a threshold for detecting breakouts on the up side. An adaptive and improved version of this system would adjust N according to market conditions, such as momentum, price volatility or acceleration.
Since many systems are based directly or indirectly on cycles, another useful measure of market condition is the periodic length of a price chart's dominant cycle, (DC), that cycle with the greatest influence on price action.
The utility of this new DC measure was noted by author Murray Ruggiero in the January '96 issue of Futures Magazine. In it. Mr. Ruggiero used it to adaptive adjust the value of N in a channel breakout system. He then simulated trading 15 years of D-Mark futures in order to compare its performance to a similar system that had a fixed optimal value of N. The adaptive version produced 20% more profit!
This DC index utilized the popular MESA algorithm (a formulation by John Ehlers adapted from Burg's maximum entropy algorithm, MEM). Unfortunately, the DC approach is problematic when the market has no real dominant cycle momentum, because the mathematics will produce a value whether or not one actually exists! Therefore, we developed a proprietary indicator that does not presuppose the presence of market cycles. It's called CFB (Composite Fractal Behavior) and it works well whether or not the market is cyclic.
CFB examines price action for a particular fractal pattern, categorizes them by size, and then outputs a composite fractal size index. This index is smooth, timely and accurate
Essentially, CFB reveals the length of the market's trending action time frame. Long trending activity produces a large CFB index and short choppy action produces a small index value. Investors have found many applications for CFB which involve scaling other existing technical indicators adaptively, on a bar-to-bar basis.
Included
Loxx's Expanded Source Types
Related indicators:
Adaptive Trend Cipher loxx]
Dynamic Zones Polychromatic Momentum Candles
RSI Precision Trend Candles
energies_correlation_zscoreA table to help track correlations between the four major energies contracts of the CME. The table shows the z-score of the current correlation value between HO, RB, CL, and NG. The inputs are:
- timeframe: the timeframe of the calcluation. the default is 5 minutes.
- window: the rolling window over which to calculate the correlations. the default is 48, or four hours given the default timeframe.
A score of zer means that the correlation over the latest window is in line with the average for all windows sampled from the chart history. More positive scores imply higher positive correlation than normal, and vice versa for negative scores.

Normalized Correlation CoefficientThis is a normalized correlation coefficient that can be used with any timeframe or symbol desired (found in the indicator settings). The normalization function makes the coefficient bound between 0-1. There is a subjective threshold at 0.80 where anything below the threshold tends to be higher risk in trading as opposed to above the threshold.
Suggestions:
- Use a timeframe slightly higher than your current chart for optimal results.
- Do not use as a standalone strategy, rather, use it as a layer of confirmation.
- For altcoin cryptocurrencies, we suggest tethering the indicator to the "OTHERS" chart.

Correlation with Matrix TableCorrelation coefficient is a measure of the strength of the relationship between two values. It can be useful for market analysis, cryptocurrencies, forex and much more.
Since it "describes the degree to which two series tend to deviate from their moving average values" (1), first of all you have to set the length of these moving averages. You can also retrieve the values from another timeframe, and choose whether or not to ignore the gaps.
After selecting the reference ticker, which is not dependent from the chart you are on, you can choose up to eight other tickers to relate to it. The provided matrix table will then give you a deeper insight through all of the correlations between the chosen symbols.
Correlation values are scored on a scale from 1 to -1
A value of 1 means the correlation between the values is perfect.
A value of 0 means that there is no correlation at all.
A value of -1 indicates that the correlation is perfectly opposite.
For a better view at a glance, eight level colors are available and it is possible to modify them at will. You can even change level ranges by setting their threshold values. The background color of the matrix's cells will change accordingly to all of these choices.
The default threshold values, commonly used in statistics, are as follows:
None to weak correlation: 0 - 0.3
Weak to moderate correlation: 0.3 - 0.5
Moderate to high correlation: 0.5 - 0.7
High to perfect correlation: 0.7 - 1
Remember to be careful about spurious correlations, which are strong correlations without a real causal relationship.
(1) www.tradingview.com

Nearest Neighbor Extrapolation of Price [Loxx]I wasn't going to post this because I don't like how this calculates by puling in the Open price, but I'm posting it anyway. This does work in it's current form but there is a. better way to do this. I'll revisit this in the future.
Anyway...
The k-Nearest Neighbor algorithm (k-NN) searches for k past patterns (neighbors) that are most similar to the current pattern and computes the future prices based on weighted voting of those neighbors. This indicator finds only one nearest neighbor. So, in essence, it is a 1-NN algorithm. It uses the Pearson correlation coefficient between the current pattern and all past patterns as the measure of distance between them. Also, this version of the nearest neighbor indicator gives larger weights to most recent prices while searching for the closest pattern in the past. It uses a weighted correlation coefficient, whose weight decays linearly from newer to older prices within a price pattern.
This indicator also includes an error window that shows whether the calculation is valid. If it's green and says "Passed", then the calculation is valid, otherwise it'll show a red background and and error message.
Inputs
Npast - number of past bars in a pattern;
Nfut -number of future bars in a pattern (must be < Npast).
lastbar - How many bars back to start forecast? Useful to show past prediction accuracy
barsbark - This prevents Pine from trying to calculate on all past bars
Related indicators
Hodrick-Prescott Extrapolation of Price
Itakura-Saito Autoregressive Extrapolation of Price
Helme-Nikias Weighted Burg AR-SE Extra. of Price
Weighted Burg AR Spectral Estimate Extrapolation of Price
Levinson-Durbin Autocorrelation Extrapolation of Price
Fourier Extrapolator of Price w/ Projection Forecast

Investing - Correlation Table This correlation tables idea is nothing new, many sites provides it.
However, I couldn't find any simple correlation indicator on TradingView despite how simple this indicator is.
This indicator works as its called. Calculating the correlation between 2 projects (can be used in stocks as well) using the 'ta.correlation' feature built into pinescript.
When it comes to investing, we do not want our stocks / crypto project to be heavily correlated to each other.
If they are heavily correlated to each other, then there isn't much point in diversifying.
That being said, it can be useful for traders who trade multiple pairs.
-----------------------------------------------------------------------------------------------------------------------------------------------------------
In this indicator, consist of 5 primary input and 15 secondary input (Symbol List).
Correlation Source:
This input options allow you to change how the correlation is calculated. By default, it uses 'close'.
Correlation Percentage(%):
This input options allows you configure how many (%) of correlation is considered as 'decoupled'.
This correlation will only move between -100% ~ 100%.
100% refers to it moving together.
-100% refers to it moving the opposite direction.
For example, Project A rises in Price, what is the possibility of Project B following:
A 100% correlation between Project A and Project B, refers to Project B will follow Project A movement.
A 50% correlation between Project A and Project B, refers to there is only 50% chance for Project B to follow Project A movement.
A -20% correlation between Project A and Project B, refers to there is a 20% chance of Project B moving the opposite direction of Project A
(Refers to the table on chart above to better understand what the numbers means. DOT/USD has a 100% correlation to DOT/USD. However. MXCUSDT has a -37.2% correlation to DOT/USD.)
Amounts Bars To Check:
This input options will check the amount of bars since the last bar in the chart.
If you want to know the correlation of the past 100 days in a daily chart, you will enter '100' into this options and it will check only the past 100 days.
Symbol List
This will allow you to input all the project symbol ticker ID to add into the correlation table.
-----------------------------------------------------------------------------------------------------------------------------------------------------------
Originally, I wish to use for loop to go through the symbol list to reduce the amount of code required. However, due to limitation of 'request.security' feature, I had to abandon that idea and use hard-coded for requesting security and use a while loop to identify the symbol correlation value in the array set then set the table value accordingly.
If there is any script writer could improve this or any unclear explanation, feel free to drop a comment below.

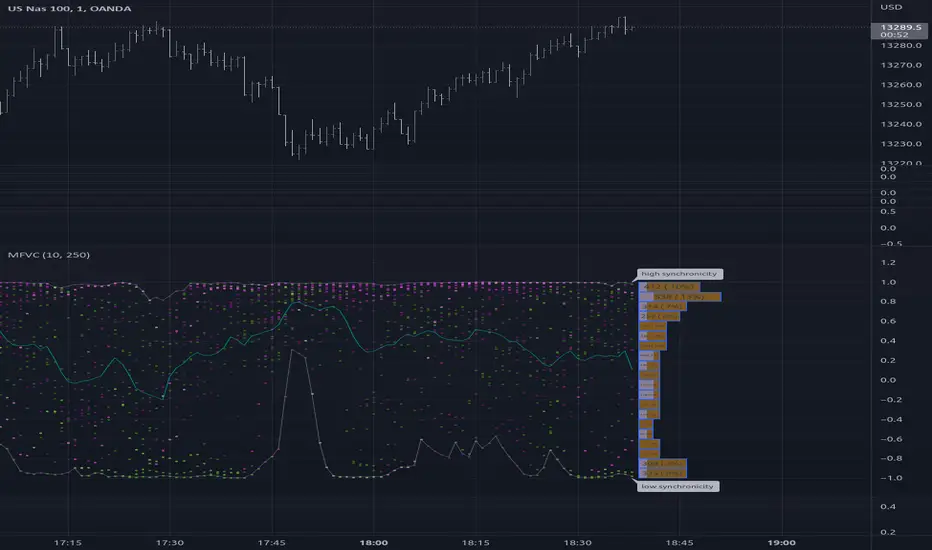
Multiple Frequency Volatility CorrelationThis is a complex indicator that looks to provide some insight into the correlation between volume and price volatility.
Rising volatility is depicted with the color green while falling volatility is depicted with purple.
Lightness of the color is used to depict the length of the window used, darker == shorter in the 2 -> 512 window range.
Price-Filtered Spearman Rank Correl. w/ Floating Levels [Loxx]Price-Filtered Spearman Rank Correl. w/ Floating Levels is a Spearman Rank Correlation indicator with optional source filtering and floating levels.
What is Spearman rank correlation?
Spearman rank correlation, also known as Spearman coefficient is a formula used to identify the strength of the link between two datasets. This coefficient is a method that can be used to assess the strength of a relationship apart from the direction it takes. The formula, named after Charles Spearman, a mathematician, can only be used in circumstances where data can be categorized or put in order, for instance, the highest to the lowest.
For a better understanding of Spearman coefficient, it helps to get a sense of what monotonic function means. There’s a monotonic relationship under these circumstances:
– When the variable values rise together.
– When one variable value rises the other variable value lowers.
– The rate of movement of the variables need not necessarily be constant.
The Spearman correlation coefficient or rs, between +1 and -1, where +1 indicates a perfect strength between variables, while zero shows no association and -1 shows a perfect negative strength.
Spearman rank correlation theory:
A nonparametric (distribution-free) rank statistic proposed by Spearman in 1904 as a measure of the strength of the associations between two variables (Lehmann and D'Abrera 1998). The Spearman rank correlation coefficient can be used to give an R-estimate, and is a measure of monotone association that is used when the distribution of the data make Pearson's correlation coefficient undesirable or misleading.
Included:
Zero-line and signal cross options for bar coloring, signals, and alerts
Alerts
3 Signal types
Loxx's Expanded Source Types
Greater Currency Correlation Matrix (Forex)Other available matrixes I found have a limited number of forex symbols. Consequentially, you need to keep switching them if you want to do a proper analysis. As a result of that, I produced my own currency matrix.
Correlation studies relationships between different price charts.
High correlation may be completely random in the short term, but it may signify a fundamental relationship between the two symbols if calculated over the long term.
For example, the currency of an oil-producing country may rally along with oil, whereas the importer's currency may drop. This means that watching the oil price chart may be worth it for such pairs.
The script includes all Major and Minor pairs with the addition of Gold (XAUEUR) and two optional symbols.
▬▬▬▬
To avoid too frequent use of security(), I decided to calculate all symbol values from EUR pairs. It should improve performance and keep room for some additional symbols in the future.
Please report any bugs.
Overlay Mini Plot(s) of Correlated Asset(s)Overlay a small plot of a correlated asset of your choosing. Shrink/expand, Set vertical and horizontal position, plot multiple mini-plots via duplicate indicators with varied settings.
Plots the last X bars of any asset; including the live candle currently painting
Useful for low time frame trading when you want to see correlated asset price movement right alongside the price movement you're watching.
Useful for quick and simple comparisons; when you don't want the clutter of split screen or multi-pane view.
Useful for backtesting.
Price scale agnostic; just plots the shape of the recent price action, with several optional labels: Asset+timeframe | Live Price | Highest price over X bars | Lowest price over X bars.
Works fine with all the assets i've tested it on.
~~User inputs~~
-number of bars to paint.
-horizontal offset: plot to right X bars or to left X bars
-vertical offset: shift up or down, shrink or expand; by using 2 'spacer' inputs
-color/transparancy of candles and price labels.
-width (pixels) of candle bodies.
-choose to display price labels or not
-choose to display asset label or not
~~Tips~~
--Add several of these indicators; changing the vertical 'Shift/Shrink' settings on each to visually separate them.
--In the above chart or EurUsd, there are three indicators =>> three mini-plots overlaid: DXY, EurGbp and GbpUsd. Using the following settings for Space Above:Space Below: DXY- 0.1:4.5 | EurGbp- 1.8:1.8 | GbpUsd- 4.5:0.1
--the more you add, the more you'll have to vertically shrink the plots
© twingall

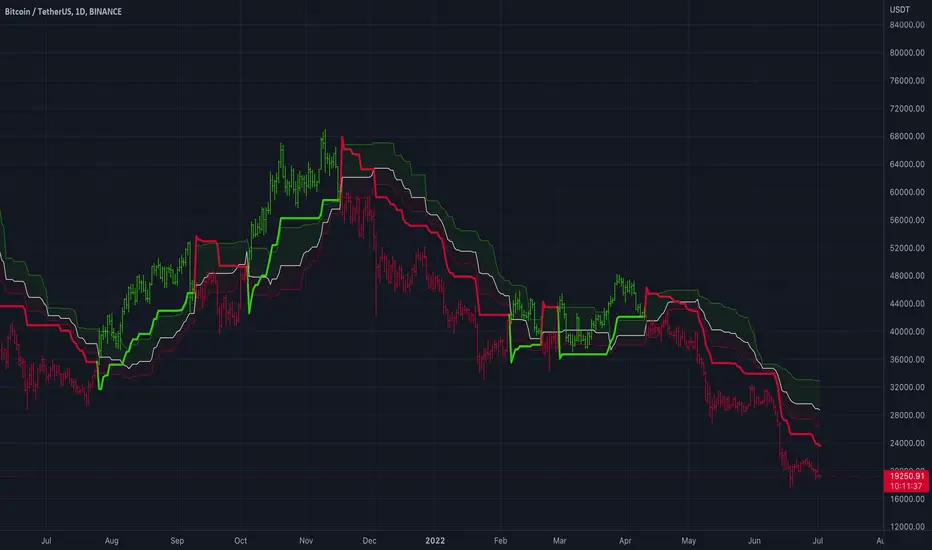
Adaptive Supertrend w/ Floating Levels [Loxx]Adaptive Supertrend w/ Floating Levels is a Supertrend indicator made adaptive by comparing the coefficient of determination / average of the least squares. The basic concept is this: use correlation with an r-squared line to adapt the period of the indicator, thereby resulting in a more versatile Supertrend. This adaptive formula makes the Supertrend more reactive to small fluctuation in the market while still doing what it's supposed to do: track trend. In addition, floating levels are drawn above or below the Supertrend which are calculated with percentage of the highest and lowest values of the Supertrend within the last “lookback” period. These floating levels act as filter to detect / prevent false trend reversals. T
What is the Supertrend?
Supertrend indicator was created by Olivier Seban to work on different time frames. It works for futures, forex, and equities. It is used in 15 minutes, hourly, weekly, and daily charts. Based on the parameters of multiplier and period, the indicator normally uses 3 for multiplier and 7 for the ATR period as default values. Average True Range is represented by the number of days while the multiplier is the value by which the range is multiplied.
Included
-Toggle on/off bar coloring
-Toggle on/off adaptivity
-Toggle on/off fill coloring
Asset CorrelationThis indicator shows correlation strength between the source asset plotted in the main chart and a user-input asset in the indicator panel. For example, if the main chart panel is displaying BTCUSD and the correlation indicator is NDX, then the correlation strength is plotted as the relationship between the two. A strong positive correlation target is set at 0.80 but can be changed. A strong negative correlation target is set at -0.80 and can also be changed.
The indicator also has an option for a plot of the ta.correlation() function for a reference line.