Squeeze Weekday Frequency [CHE] Squeeze Weekday Frequency — Tracks historical frequency of low-volatility squeezes by weekday to inform timing of low-risk setups.
Summary
This indicator monitors periods of unusually low volatility, defined as when the average true range falls below a percentile threshold, and tallies their occurrences across each weekday. By aggregating these counts over the chart's history, it reveals patterns in squeeze frequency, helping traders avoid or target specific days for reduced noise. The approach uses persistent counters to ensure accurate daily tallies without duplicates, providing a robust view of weekday biases in volatility regimes.
Motivation: Why this design?
Traders often face inconsistent signal quality due to varying volatility patterns tied to the trading calendar, such as quieter mid-week sessions or busier Mondays. This indicator addresses that by binning low-volatility events into weekday buckets, allowing users to spot recurring low-activity days where trends may develop with less whipsaw. It focuses on historical aggregation rather than real-time alerts, emphasizing pattern recognition over prediction.
What’s different vs. standard approaches?
- Reference baseline: Traditional volatility trackers like simple moving averages of range or standalone Bollinger Band squeezes, which ignore temporal distribution.
- Architecture differences:
- Employs array-based persistent counters for each weekday to accumulate events without recounting.
- Includes duplicate prevention via day-key tracking to handle sparse data.
- Features on-demand sorting and conditional display modes for focused insights.
- Practical effect: Charts show a persistent table of ranked weekdays instead of transient plots, making it easier to glance at biases like higher squeezes on Fridays, which reduces the need for manual logging and highlights calendar-driven edges.
How it works (technical)
The indicator first computes the average true range over a specified lookback period to gauge recent volatility. It then ranks this value against its own history within a sliding window to identify squeezes when the rank drops below the threshold. Each bar's timestamp is resolved to a weekday using the selected timezone, and a unique day identifier is generated from the date components.
On detecting a squeeze and valid price data, it checks against a stored last-marked day for that weekday to avoid multiple counts per day. If it's a new occurrence, the corresponding weekday counter in an array increments. Total days and data-valid days are tracked separately for context.
At the chart's last bar, it sums all counters to compute shares, sorts weekdays by their squeeze proportions, and populates a table with the selected subset. The table alternates row colors and highlights the peak weekday. An info label above the final bar summarizes totals and the top day. Background shading applies a faint red to squeeze bars for visual confirmation. State persists via variable arrays initialized once, ensuring counts build incrementally without resets.
Parameter Guide
ATR Length — Sets the lookback for measuring average true range, influencing squeeze sensitivity to short-term swings. Default: 14. Trade-offs/Tips: Shorter values increase responsiveness but raise false positives in chop; longer smooths for stability, potentially missing early squeezes.
Percentile Window (bars) — Defines the history length for ranking the current ATR, balancing recent relevance with sample size. Default: 252. Trade-offs/Tips: Narrower windows adapt faster to regime shifts but amplify noise; wider ones stabilize ranks yet lag in fast markets—aim for 100-500 bars on daily charts.
Squeeze threshold (PR < x) — Determines the cutoff for low-volatility classification; lower values flag rarer, tighter squeezes. Default: 10.0. Trade-offs/Tips: Tighter thresholds (under 5) yield fewer but higher-quality signals, reducing clutter; looser (over 20) captures more events at the cost of relevance.
Timezone — Selects the reference for weekday assignment; exchange default aligns with asset's session. Default: Exchange. Trade-offs/Tips: Use custom for cross-market analysis, but verify alignment to avoid offset errors in global pairs.
Show — Toggles the results table visibility for quick on/off of the display. Default: true. Trade-offs/Tips: Disable in multi-indicator setups to save screen space; re-enable for periodic reviews.
Pos — Positions the table on the chart pane for optimal viewing. Default: Top Right. Trade-offs/Tips: Bottom options suit long-term charts; test placements to avoid overlapping price action.
Font — Adjusts text size in the table for readability at different zooms. Default: normal. Trade-offs/Tips: Smaller fonts fit more data but strain eyes on small screens; larger for presentations.
Dark — Applies a dark color scheme to the table for contrast against chart backgrounds. Default: true. Trade-offs/Tips: Toggle false for light themes; ensures legibility without manual recoloring.
Display — Filters table rows to show all, top three, or bottom three weekdays by squeeze share. Default: All. Trade-offs/Tips: Use "Top 3" for focus on high-frequency days in active trading; "All" for full audits.
Reading & Interpretation
Red-tinted backgrounds mark individual squeeze bars, indicating current low-volatility conditions. The table's summary row shows the highest squeeze count, its percentage of total events, and the associated weekday in teal. Detail rows list selected weekdays with their absolute counts, proportional shares, and a left arrow for the peak day—higher percentages signal days where squeezes cluster, suggesting potential for calmer trend development. The info label reports overall days observed, valid data days, and reiterates the top weekday with its count. Drifting counts toward zero on a weekday imply rarity, while elevated ones point to habitual low-activity sessions.
Practical Workflows & Combinations
- Trend following: Scan for squeezes on high-frequency weekdays as entry filters, confirming with higher highs or lower lows in the structure; pair with momentum oscillators to time breaks.
- Exits/Stops: On low-squeeze days, widen stops for breathing room, tightening them during peak squeeze periods to guard against false breaks—use the table's percentages as a regime proxy.
- Multi-asset/Multi-TF: Defaults work across forex and indices on hourly or daily frames; for stocks, adjust percentile window to 100 for shorter histories. Scale thresholds up by 5-10 points for high-vol assets like crypto to maintain signal sparsity.
Behavior, Constraints & Performance
- Repaint/confirmation: Counts update only on confirmed bars via day-key changes, with no future references—live bars may shade red tentatively but tallies finalize at session close.
- security()/HTF: Not used, so no higher-timeframe repaint risks; all computations stay in the chart's resolution.
- Resources: Relies on a fixed-size array of seven elements and small loops for sorting and table fills, capped at 5000 bars back—efficient for most charts but may slow on very long intraday histories.
- Known limits: Ignores weekends and holidays implicitly via data presence; early chart bars lack full percentile context, leading to initial undercounting; assumes continuous sessions, so gaps in data (e.g., news halts) skew totals.
Sensible Defaults & Quick Tuning
Start with the built-in values for broad-market daily charts: ATR at 14, window at 252, threshold at 10. For noisier environments, lower the threshold to 5 and shorten the window to 100 to prioritize rare squeezes. If too few events appear, raise the threshold to 15 and extend ATR to 20 for broader capture. To combat overcounting in sparse data, widen the window to 500 while keeping others stock—monitor the info label's data-days count before trusting patterns.
What this indicator is—and isn’t
This serves as a statistical overlay for spotting calendar-based volatility biases, aiding in session selection and filter design. It is not a standalone signal generator, predictive model, or risk manager—integrate it with price action, volume, and broader strategy rules for decisions.
Disclaimer
The content provided, including all code and materials, is strictly for educational and informational purposes only. It is not intended as, and should not be interpreted as, financial advice, a recommendation to buy or sell any financial instrument, or an offer of any financial product or service. All strategies, tools, and examples discussed are provided for illustrative purposes to demonstrate coding techniques and the functionality of Pine Script within a trading context.
Any results from strategies or tools provided are hypothetical, and past performance is not indicative of future results. Trading and investing involve high risk, including the potential loss of principal, and may not be suitable for all individuals. Before making any trading decisions, please consult with a qualified financial professional to understand the risks involved.
By using this script, you acknowledge and agree that any trading decisions are made solely at your discretion and risk.
Do not use this indicator on Heikin-Ashi, Renko, Kagi, Point-and-Figure, or Range charts, as these chart types can produce unrealistic results for signal markers and alerts.
Best regards and happy trading
Chervolino
Cycles

First-Move-Wrong Toolkit [CHE] First-Move-Wrong Toolkit — Session-bound sweep rejection with structure confirmation
Summary
This indicator marks potential “first move wrong” reversals during a defined trading session. It looks for a quick sweep beyond the prior day high or low, or the opening range high or low, followed by rejection and a basic structure confirmation. Optional rules require a retest and a VWAP reclaim in the direction of the trade idea. The script renders session levels as right-extended lines, signals as labels, optional SL/TP guide lines for visualization, and background tints during sweep events. Pivots are confirmed using swing width, which reduces repaint risk compared to live swings.
Motivation: Why this design?
Intraday reversals often start with a liquidity sweep around obvious highs or lows. Acting on the sweep alone can be noisy, while waiting for structure break and a retest can be slow. This tool balances both by checking a sweep and rejection at session-relevant levels, then requiring a simple structure cue and, optionally, a retest and a VWAP filter. The goal is a clear, rule-based signal layer that is easy to audit on chart without hidden state.
What’s different vs. standard approaches?
Baseline reference: Simple sweep detectors or basic CHOCH markers that ignore session context and liquidity anchors.
Architecture differences:
Session-aware opening range tracking that finalizes after the chosen minutes from session start.
Daily previous high and low pulled without lookahead, then extended forward as visual anchors.
Confirmed pivot highs and lows to avoid repaint from live, unconfirmed swings.
Optional retest rule using crossover or crossunder at the trigger level.
Optional VWAP filter to demand reclaim in the intended direction.
Global label cooldown to prevent clusters of signals.
Practical effect: Fewer one-off flips around noisy levels, clearer alignment with session structure, and compact visual feedback through lines, labels, and tints.
How it works (technical)
Levels: During the defined session, the script builds an opening range high and low until the configured minute mark after session start, then freezes those levels for the day. It also fetches the previous day high and low from the daily timeframe without lookahead and extends them forward.
Sweep and rejection: A sweep is defined as price moving beyond a target level and then rejecting back inside on the same bar. The script checks this condition separately for highs and lows against opening range and previous-day levels.
Structure validation: Confirmed pivot highs and lows are computed using a symmetric swing width. A bearish idea requires a prior sweep of a high plus a break through the last confirmed swing low. A bullish idea requires a prior sweep of a low plus a break through the last confirmed swing high.
Optional retest: If enabled, a bearish signal needs a cross under the bearish trigger level; a bullish signal needs a cross over the bullish trigger level.
VWAP filter (optional): The script requires a reclaim of VWAP in the intended direction when enabled.
State handling: Opening range values, previous-day lines, and the label cooldown timestamp are stored in persistent variables. Lines are created once and updated each bar to extend forward.
Repaint considerations: Pivots confirm only after the specified swing width, reducing repaint. The daily level request is performed without lookahead. Signals use closed-bar checks implied by crossover and crossunder logic.
Parameter Guide
Session (local) — Defines the active trading window. Default nine to seventeen. Narrower windows focus on the main session drive.
Opening Range (min) — Minutes from session start to finalize OR levels. Default fifteen. Shorter values react faster; longer values stabilize levels.
Use PrevDay H/L levels — Toggle previous-day anchors. On by default.
Use OR H/L levels — Toggle opening range anchors. On by default.
Equal H/L tolerance (ticks) — Intended tolerance for equal highs or lows. Default one. (Unknown/Optional) in current signals.
Swing width — Bars on both sides for confirmed pivots. Default two. Larger values reduce noise but confirm later.
Require CHOCH after sweep — Enforces structure break after a sweep. On by default.
Prefer retest entries — Requires crossover or crossunder of the trigger level. On by default.
VWAP filter — Demands a reclaim of VWAP in signal direction. Off by default.
TP in R (guide) — Multiplier for visual TP guides. Default one. Visualization only.
Show levels / Show signals / Show R-guides — Rendering toggles. R-guides are visual aids, not orders.
Label cooldown (bars) — Minimum bars between labels. Default five. Higher values reduce clusters.
Palette inputs — Colors and transparencies for levels, labels, VWAP, and tints.
Reading & Interpretation
Lines: Dotted lines represent opening range high and low after the OR window completes. Dashed lines represent previous-day high and low.
Signals: “Long” labels appear after a low-side sweep with rejection and structure confirmation, subject to optional retest and VWAP rules. “Short” labels mirror this on the high side.
Background tints: Red-tinted bars indicate a high-side sweep and rejection. Green-tinted bars indicate a low-side sweep and rejection.
R-guides: Circles display a visual stop level at the bar extreme and a target guide based on the selected multiple. They are informational only.
Practical Workflows & Combinations
Session reversal scans: During the first hour, watch for sweeps around previous-day or opening range levels, then wait for structure confirmation and optional retest.
Trend following with filters: Combine signals with higher-timeframe structure or a moving average regime check. Ignore signals against the dominant regime.
Exits and stops: Use the visual stop as a reference near the sweep extreme; adapt the target guide to volatility and market conditions.
Multi-asset / Multi-TF: Works on intraday timeframes for liquid futures, indices, forex, and large-cap equities. Start with default settings and adjust swing width and OR minutes to instrument volatility.
Behavior, Constraints & Performance
Repaint/confirmation: Pivots confirm after the swing window completes. Signals occur only when conditions are met on closed bars.
security()/HTF: Daily previous-day levels are requested without lookahead to reduce repaint.
Resources: Uses persistent variables and line updates per bar; no heavy loops or arrays.
Known limits: Signals can arrive later when swing width is large. Gaps around session boundaries may distort OR levels. VWAP behavior may vary with partial sessions or illiquid assets.
Sensible Defaults & Quick Tuning
Starting point: Session nine to seventeen, opening range fifteen minutes, swing width two, CHOCH required, retest on, VWAP off, cooldown five bars.
Too many flips: Increase swing width, enable VWAP filter, or raise label cooldown.
Too sluggish: Reduce swing width or shorten the opening range window.
Too many session-level hits: Disable either previous-day levels or opening range levels to simplify context.
What this indicator is—and isn’t
This is a session-aware visualization and signal layer focused on sweep-plus-structure behavior. It is not a complete trading system and does not manage orders, risk, or portfolio exposure. Use it with market structure, risk limits, and execution rules that fit your process.
Disclaimer
The content provided, including all code and materials, is strictly for educational and informational purposes only. It is not intended as, and should not be interpreted as, financial advice, a recommendation to buy or sell any financial instrument, or an offer of any financial product or service. All strategies, tools, and examples discussed are provided for illustrative purposes to demonstrate coding techniques and the functionality of Pine Script within a trading context.
Any results from strategies or tools provided are hypothetical, and past performance is not indicative of future results. Trading and investing involve high risk, including the potential loss of principal, and may not be suitable for all individuals. Before making any trading decisions, please consult with a qualified financial professional to understand the risks involved.
By using this script, you acknowledge and agree that any trading decisions are made solely at your discretion and risk.
Do not use this indicator on Heikin-Ashi, Renko, Kagi, Point-and-Figure, or Range charts, as these chart types can produce unrealistic results for signal markers and alerts.
Best regards and happy trading
Chervolino

Background Trend Follower by exp3rtsThe Background Trend Follower indicator visually highlights the market’s daily directional bias using subtle background colors. It calculates the price change from the daily open and shades the chart background according to the current intraday momentum.
🟢 Green background → Price is significantly above the daily open (strong bullish trend)
🔴 Red background → Price is significantly below the daily open (strong bearish trend)
🟡 Yellow background → Price is trading near the daily open (neutral or consolidating phase)
The script automatically detects each new trading day.
It records the opening price at the start of the day.
As the session progresses, it continuously measures how far the current price has moved from that open.
When the move exceeds ±50 points (custom threshold), the background color adapts to reflect the trend strength.
Perfect for traders who want a quick visual sense of intraday bias — bullish, bearish, or neutral — without cluttering the chart with extra indicators.

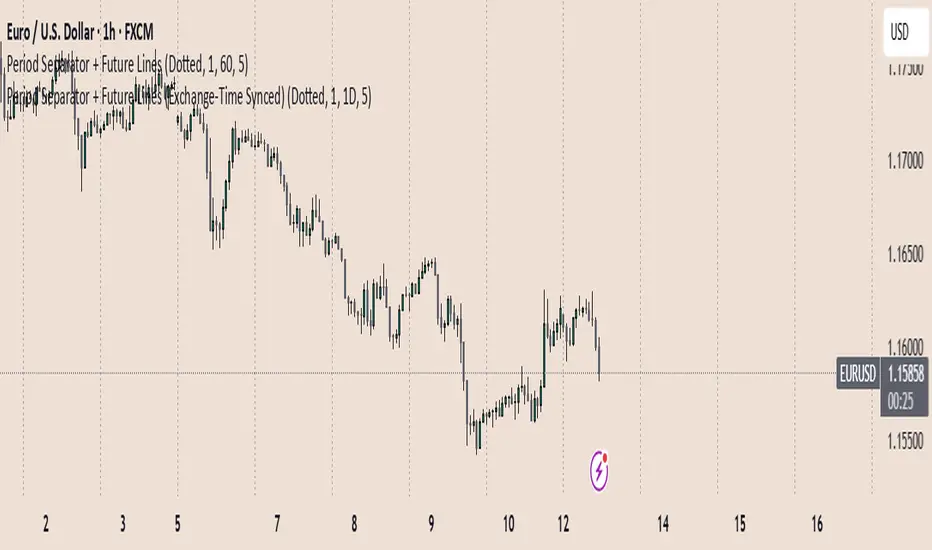
Period Separator + Future Lines (Exchange-Time Synced)Monthly, Weekly, Daily,4hr and hr dividers and future separators (custom as wish, how many lines it should show in future)
Future separators corrected
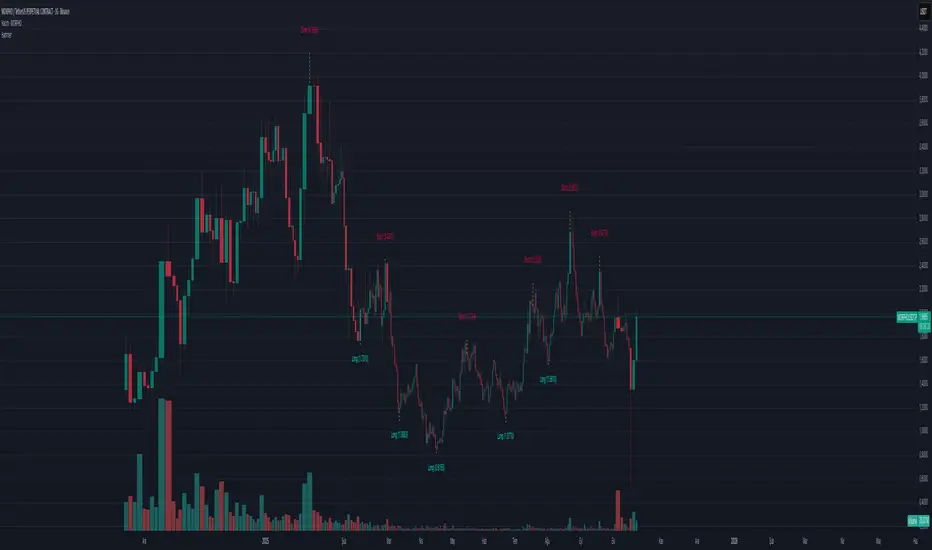
Tamu2.0Testing Oct 2025. Indicator tries to identify short periods of volatility and market manipulation.

Asia Risk MonitorAsia Risk Monitor for all those monitoring the financial situation in the US, looking for a clue of a move to the down or upside.

First week of the yearA very simple indicator that marks a channel on the candlestick for the first week of the year.
The channel can serve as an entry/exit point with a medium and long term focus.
Note: This indicator should be observed exclusively on the weekly timeframe.
MANOLES MINDSETBEST STRATEGY AT SUPPORTS “This indicator combines Bollinger Bands, RSI, Stochastic RSI, MACD, and a Moving Average to identify potential buy/sell points. It also includes alert conditions for trade signals.”

EMA50/200 — Nth Close After Break (Up/Down/Both)This indicator tracks EMA-based momentum confirmation using a customizable N-bar rule.
🧠 Logic:
- You can choose whether to track EMA 50 or EMA 200.
- When the price breaks above (or below) the selected EMA, the indicator starts counting.
- If the price stays on that side of the EMA for N consecutive closes, a single signal is triggered on the Nth bar.
- After signaling, the counter resets — the next signal appears only after a new EMA break.
⚙️ Parameters:
- Target EMA: Choose which EMA (50 or 200) the logic is based on.
- N: Number of consecutive bars required after a break.
- Direction: Up / Down / Both.
- Optional trend filters: Require EMA50 > EMA200 for Up signals, or EMA50 < EMA200 for Down signals.
- Blue ▲ = Bullish signal (Nth close after breaking above EMA)
- Red ▼ = Bearish signal (Nth close after breaking below EMA)
✅ Ideal for identifying strong trend confirmations and filtering out false EMA breakouts.

Squeeze Hour Frequency [CHE]Squeeze Hour Frequency (ATR-PR) — Standalone — Tracks daily squeeze occurrences by hour to reveal time-based volatility patterns
Summary
This indicator identifies periods of unusually low volatility, defined as squeezes, and tallies their frequency across each hour of the day over historical trading sessions. By aggregating counts into a sortable table, it helps users spot hours prone to these conditions, enabling better scheduling of trading activity to avoid or target specific intraday regimes. Signals gain robustness through percentile-based detection that adapts to recent volatility history, differing from fixed-threshold methods by focusing on relative lowness rather than absolute levels, which reduces false positives in varying market environments.
Motivation: Why this design?
Traders often face uneven intraday volatility, with certain hours showing clustered low-activity phases that precede or follow breakouts, leading to mistimed entries or overlooked calm periods. The core idea of hourly squeeze frequency addresses this by binning low-volatility events into 24 hourly slots and counting distinct daily occurrences, providing a historical profile of when squeezes cluster. This reveals time-of-day biases without relying on real-time alerts, allowing proactive adjustments to session focus.
What’s different vs. standard approaches?
- Reference baseline: Classical volatility tools like simple moving average crossovers or fixed ATR thresholds, which flag squeezes uniformly across the day.
- Architecture differences:
- Uses persistent arrays to track one squeeze per hour per day, preventing overcounting within sessions.
- Employs custom sorting on ratio arrays for dynamic table display, prioritizing top or bottom performers.
- Handles timezones explicitly to ensure consistent binning across global assets.
- Practical effect: Charts show a persistent table ranking hours by squeeze share, making intraday patterns immediately visible—such as a top hour capturing over 20 percent of total events—unlike static overlays that ignore temporal distribution, which matters for avoiding low-liquidity traps in crypto or forex.
How it works (technical)
The indicator first computes a rolling volatility measure over a specified lookback period. It then derives a relative ranking of the current value against recent history within a window of bars. A squeeze is flagged when this ranking falls below a user-defined cutoff, indicating the value is among the lowest in the recent sample.
On each bar, the local hour is extracted using the selected timezone. If a squeeze occurs and the bar has price data, the count for that hour increments only if no prior mark exists for the current day, using a persistent array to store the last marked day per hour. This ensures one tally per unique trading day per slot.
At the final bar, arrays compile counts and ratios for all 24 hours, where the ratio represents each hour's share of total squeezes observed. These are sorted ascending or descending based on display mode, and the top or bottom subset populates the table. Background shading highlights live squeezes in red for visual confirmation. Initialization uses zero-filled arrays for counts and negative seeds for day tracking, with state persisting across bars via variable declarations.
No higher timeframe data is pulled, so there is no repaint risk from external fetches; all logic runs on confirmed bars.
Parameter Guide
ATR Length — Controls the lookback for the volatility measure, influencing sensitivity to short-term fluctuations; shorter values increase responsiveness but add noise, longer ones smooth for stability — Default: 14 — Trade-offs/Tips: Use 10-20 for intraday charts to balance quick detection with fewer false squeezes; test on historical data to avoid over-smoothing in trending markets.
Percentile Window (bars) — Sets the history depth for ranking the current volatility value, affecting how "low" is defined relative to past; wider windows emphasize long-term norms — Default: 252 — Trade-offs/Tips: 100-300 bars suit daily cycles; narrower for fast assets like crypto to catch recent regimes, but risks instability in sparse data.
Squeeze threshold (PR < x) — Defines the cutoff for flagging low relative volatility, where values below this mark a squeeze; lower thresholds tighten detection for rarer events — Default: 10.0 — Trade-offs/Tips: 5-15 percent for conservative signals reducing false positives; raise to 20 for more frequent highlights in high-vol environments, monitoring for increased noise.
Timezone — Specifies the reference for hourly binning, ensuring alignment with market sessions — Default: Exchange — Trade-offs/Tips: Set to "America/New_York" for US assets; mismatches can skew counts, so verify against chart timezone.
Show Table — Toggles the results display, essential for reviewing frequencies — Default: true — Trade-offs/Tips: Disable on mobile for performance; pair with position tweaks for clean overlays.
Pos — Places the table on the chart pane — Default: Top Right — Trade-offs/Tips: Bottom Left avoids candle occlusion on volatile charts.
Font — Adjusts text readability in the table — Default: normal — Trade-offs/Tips: Tiny for dense views, large for emphasis on key hours.
Dark — Applies high-contrast colors for visibility — Default: true — Trade-offs/Tips: Toggle false in light themes to prevent washout.
Display — Filters table rows to focus on extremes or full list — Default: All — Trade-offs/Tips: Top 3 for quick scans of risky hours; Bottom 3 highlights safe low-squeeze periods.
Reading & Interpretation
Red background shading appears on bars meeting the squeeze condition, signaling current low relative volatility. The table lists hours as "H0" to "H23", with columns for daily squeeze counts, percentage share of total squeezes (summing to 100 percent across hours), and an arrow marker on the top hour. A summary row above details the peak count, its share, and the leading hour. A label at the last bar recaps total days observed, data-valid days, and top hour stats. Rising shares indicate clustering, suggesting regime persistence in that slot.
Practical Workflows & Combinations
- Trend following: Scan for hours with low squeeze shares to enter during stable regimes; confirm with higher highs or lower lows on the 15-minute chart, avoiding top-share hours post-news like tariff announcements.
- Exits/Stops: Tighten stops in high-share hours to guard against sudden vol spikes; use the table to shift to conservative sizing outside peak squeeze times.
- Multi-asset/Multi-TF: Defaults work across crypto pairs on 5-60 minute timeframes; for stocks, widen percentile window to 500 bars. Combine with volume oscillators—enter only if squeeze count is below average for the asset.
Behavior, Constraints & Performance
Logic executes on closed bars, with live bars updating counts provisionally but finalizing on confirmation; table refreshes only at the last bar, avoiding intrabar flicker. No security calls or higher timeframes, so no repaint from external data. Resources include a 5000-bar history limit, loops up to 24 iterations for sorting and totals, and arrays sized to 24 elements; labels and table are capped at 500 each for efficiency. Known limits: Skips hours without bars (e.g., weekends), assumes uniform data availability, and may undercount in sparse sessions; timezone shifts can alter profiles without warning.
Sensible Defaults & Quick Tuning
Start with ATR Length at 14, Percentile Window at 252, and threshold at 10.0 for broad crypto use. If too many squeezes flag (noisy table), raise threshold to 15.0 and narrow window to 100 for stricter relative lowness. For sluggish detection in calm markets, drop ATR Length to 10 and threshold to 5.0 to capture subtler dips. In high-vol assets, widen window to 500 and threshold to 20.0 for stability.
What this indicator is—and isn’t
This is a historical frequency tracker and visualization layer for intraday volatility patterns, best as a filter in multi-tool setups. It is not a standalone signal generator, predictive model, or risk manager—pair it with price action, news filters, and position sizing rules.
Disclaimer
The content provided, including all code and materials, is strictly for educational and informational purposes only. It is not intended as, and should not be interpreted as, financial advice, a recommendation to buy or sell any financial instrument, or an offer of any financial product or service. All strategies, tools, and examples discussed are provided for illustrative purposes to demonstrate coding techniques and the functionality of Pine Script within a trading context.
Any results from strategies or tools provided are hypothetical, and past performance is not indicative of future results. Trading and investing involve high risk, including the potential loss of principal, and may not be suitable for all individuals. Before making any trading decisions, please consult with a qualified financial professional to understand the risks involved.
By using this script, you acknowledge and agree that any trading decisions are made solely at your discretion and risk.
Do not use this indicator on Heikin-Ashi, Renko, Kagi, Point-and-Figure, or Range charts, as these chart types can produce unrealistic results for signal markers and alerts.
Best regards and happy trading
Chervolino
Thanks to Duyck
for the ma sorter

HammerThis indicator automatically detects powerful candlestick formations such as Hammer, Inverted Hammer, Bullish Engulfing, Hanging Man, Shooting Star, and Bearish Engulfing.
It visually marks potential reversal zones on the chart and provides instant Long / Short alerts.
By combining pattern recognition with swing levels, it helps you identify possible trend reversals more clearly.
A simple, fast, and price-action-focused tool for smarter trading decisions.
💡 Yellow dotted lines indicate possible reaction zones around swing points.
Cycle KROUFR Multi-Timeframejo wast eh, a boa zyklen über einander daun kennst die eh scho aus heast.

[ZP] Fixed v6 testDISCLAIMER:
This indicator in Pine V6 as my first ever Tradingview indicator, has been developed for my personal trading analysis, consolidating various powerful indicators that I frequently use. A number of the embedded indicators within this tool are the creations of esteemed Pine Script developers from the TradingView community. In recognition of their contributions, the names of these developers will be prominently displayed alongside the respective indicator names. My selection of these indicators is rooted in my own experience and reflects those that have proven most effective for me. Please note that the past performance of any trading system or methodology is not necessarily indicative of future results. Always conduct your own research and due diligence before using any indicator or tool.
===========================================================================
Introducing the ultimate all-in-one DIY strategy builder indicator, With over 30+ famous indicators (some with custom configuration/settings) indicators included, you now have the power to mix and match to create your own custom strategy for shorter time or longer time frames depending on your trading style. Say goodbye to cluttered charts and manual/visual confirmation of multiple indicators and hello to endless possibilities with this indicator.
Available indicators that you can choose to build your strategy, are coded to seamlessly print the BUY and SELL signal upon confirmation of all selected indicators:
EMA Filter
2 EMA Cross
3 EMA Cross
Range Filter (Guikroth)
SuperTrend
Ichimoku Cloud
SuperIchi (LuxAlgo)
B-Xtrender (QuantTherapy)
Bull Bear Power Trend (Dreadblitz)
VWAP
BB Oscillator (Veryfid)
Trend Meter (Lij_MC)
Chandelier Exit (Everget)
CCI
Awesome Oscillator
DMI ( Adx )
Parabolic SAR
Waddah Attar Explosion (Shayankm)
Volatility Oscillator (Veryfid)
Damiani Volatility ( DV ) (RichardoSantos)
Stochastic
RSI
MACD
SSL Channel (ErwinBeckers)
Schaff Trend Cycle ( STC ) (LazyBear)
Chaikin Money Flow
Volume
Wolfpack Id (Darrellfischer1)
QQE Mod (Mihkhel00)
Hull Suite (Insilico)
Vortex Indicator

My EMA IndicatorMy Absolutely Profitable Indicator
It can be use when ema9 crosses ema100 and so on...
Use it with Volume Oscillator...

Crypto Black swan theory 加密黑天鵝事件標記Only displayed on the daily K-line.
Open source code.
Can be copied and modified.
只在日K顯示
開源程式碼
可以自己複本出去改

三维资金流向(多色版)1️⃣ Colors Correspond to Capital Flow
Based on your multi-color logic:
Green bars → BTC-only inflow
Blue bars → Major altcoins-only inflow
Yellow bars → BTC + major altcoins inflow simultaneously
Red bars → USDT inflow (risk-off / capital retreat)
On the chart, you can observe:
Red bars densely appearing → BTC and alt prices often consolidate or decline, indicating market funds are retreating to safety.
Green bars concentrated → BTC is generally in an uptrend, indicating capital is mainly flowing into BTC.
Blue bars appearing → Major altcoins may rise while BTC is flat, showing that altcoins are absorbing funds.
Yellow bars appearing → BTC and altcoins rise together, usually signaling an overall bullish market.
2️⃣ Observed Patterns
Capital flow vs price movement:
Green + Yellow bars concentrated → BTC shows clear upward movement
Blue bars concentrated → Altcoins rise noticeably
Red bars → Both BTC and altcoins may decline or consolidate
Capital rotation phenomenon:
Red → Green → Yellow → Blue → Can be seen as a rotation of USDT → BTC → BTC+Alt → Alt
This indicates that at different stages, the market rotates between risk-off, major assets, and altcoins.
Volatility:
Tall, frequently alternating bars → Market volatility is high
Short bars → Capital flow is weak, market tends to move sideways

SMC POI Entry System HUDEntry, RR, Exit, of supply and demand zones taught in smart money trading. 12 types of zones and setups around Flips, Order Blocks, High Probability, and Extreme Demand Zones. Includes Checklist for Entry, Exit Rules, Take Profit Targets, Stop Loss spots, and Context

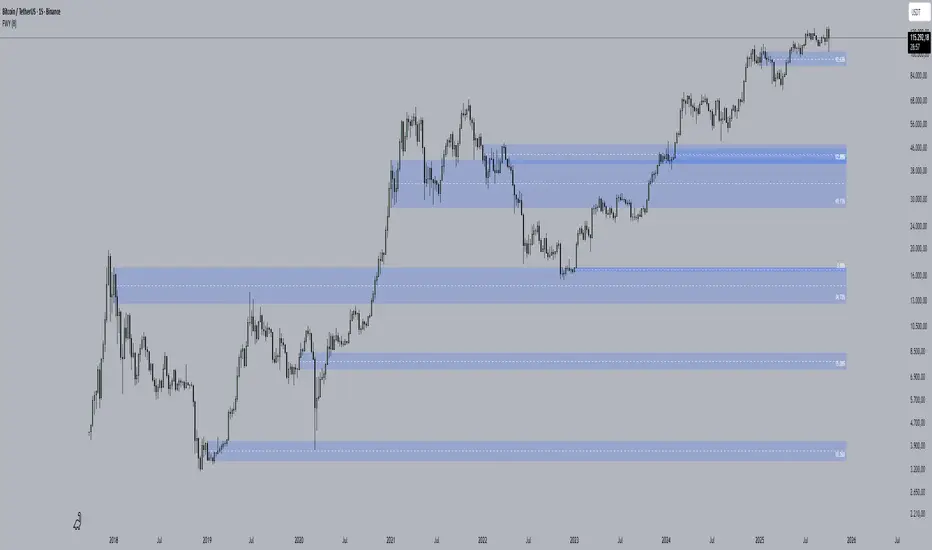
Confluence Zone BuilderWhat It Does
The Confluence Zone Builder is a technical analysis indicator that identifies high-probability price levels by detecting where multiple technical factors align (converge) at the same price area. These "confluence zones" represent levels where price is statistically more likely to react - either bouncing (support/resistance) or breaking through (breakout targets).
How It Works
1. Multi-Factor Analysis
The indicator calculates key technical levels from various sources:
Fibonacci Retracements (23.6%, 38.2%, 50%, 61.8%, 78.6%) - Support/resistance levels based on recent price swings
Fibonacci Extensions (127.2%, 141.4%, 161.8%, 200%, 261.8%) - Breakout targets beyond the current range (both bullish and bearish)
Pivot Points (Classic pivots: P, R1-R3, S1-S3) - Daily/weekly reference points traders watch
Moving Averages (EMA 20, 50 and SMA 100, 200) - Dynamic support/resistance that institutions track
VWAP - Volume-weighted average price, popular among institutional traders
Psychological Levels - Round numbers that attract orders
Previous Period Levels - Prior day/week high, low, and close
2. Proximity Clustering
When multiple factors fall within a defined proximity range (default 0.5%), they're grouped together into a single "confluence zone." This prevents cluttering the chart with dozens of individual lines.
3. Weighted Scoring System
Not all technical factors are equal. The indicator assigns importance weights:
Key Fibonacci levels (61.8%) and major MAs (200, 50) get higher weights (2.0-2.5x)
Pivot points and VWAP get medium weights (1.5x)
Minor factors get lower weights (1.0x)
The total score reflects both the number of factors and their importance.
4. Historical Validation
The indicator analyzes the last 50 bars (customizable) to track:
Touches: How many times price reached each zone
Rejections: Times price bounced off the zone (✅)
Breaks: Times price broke through the zone (❌)
Win Rate: Percentage of times the zone held (rejections ÷ touches)
5. Dynamic Adjustment
Zones aren't static - they adapt based on how price interacts with them:
Strengthens (+0.5 per rejection, +0.2 per touch): Zones that repeatedly hold become more important
Weakens (-0.8 per break): Zones that fail to hold lose credibility
Visual Indicators:
Thick solid lines = Strong zones (more rejections than breaks)
Dashed lines = Weak zones (more breaks than rejections)
Color-coded by score: Blue (low), Yellow (medium), Red (high)
What You Gain From Using It
For Support/Resistance Trading:
High-probability entries: Enter at zones with high confluence scores and strong historical win rates
Better risk management: Place stops beyond strong confluence zones that are likely to hold
Reduced false signals: Multi-factor confirmation reduces reliance on single indicators
For Breakout Trading:
Target identification: Fibonacci extensions provide profit targets beyond current ranges
Breakout confirmation: Weak zones (dashed lines, low win rates) are easier to break - ideal for breakout entries
False breakout avoidance: Strong zones (thick lines, high win rates) require more confirmation before entering
For Position Management:
Exit planning: Take profits at high-confluence zones ahead
Stop placement: Use strong zones as logical stop-loss levels
Trade filtering: Higher probability setups occur at stronger zones
Key Advantages:
Objective confluence detection - No manual line drawing needed
Data-driven validation - Historical performance shows which zones actually matter
Adaptive intelligence - Zones strengthen/weaken based on real price action
Clean visualization - Top zones only, with compact labels showing score and factors
Customizable - Adjust weights, components, and thresholds to your trading style
Bottom Line:
Instead of guessing which technical level matters most, this indicator does the heavy lifting - analyzing multiple factors, validating them historically, and highlighting only the zones where price is most likely to react. It's like having confluence analysis automated with statistical backing.

Daytrade Forex Scalper TwinPulse Auction Timer IndicatorWhat this indicator is
TwinPulse Auction Timer is a multi component execution aid designed for liquid markets. It looks for two families of opportunities
Breakouts that leave a compression area after a fresh sweep
Reversals that trigger after a sweep with strong wick polarity
It does not try to predict future prices. It measures present auction conditions with transparent rules and shows you when those conditions align. You get a simple table that says LONG SHORT or WAIT, optional session shading, clean entry and exit level visuals, and alerts you can wire to your workflow.
Why it is different
Most tools show a single signal. TwinPulse combines several independent signals into an Edge Score that you can tune. The components are
• Pulse. A signed measure of wick asymmetry with candle body direction
• Compression. Current true range compared with an average range
• Sweep timer. Bars elapsed since the most recent sweep of a prior high or low
• Bias. Direction of a higher timeframe candle
• Regime. Efficiency ratio and the relation of micro to macro volatility
• Location. Distance from the daily anchored VWAP
• Session. London and New York filter by time windows
Each component is visible in the inputs and in the table so you can understand why a suggestion appears. The script uses request.security() with lookahead off in all calls so it does not peek into the future. Shapes may move while a bar is open since price is still forming. They stop moving when the bar closes.
What you will see on the chart
• L and S shapes on entry bars
• An Exit shape at the price where a stop or the runner target would have been hit
• Four horizontal lines while a trade is active
Entry
Stop
TP1 at one R
TP2 at the runner target expressed in R
• Labels anchored to each line so you can instantly read Entry SL TP1 and TP2 with current values
• Optional shading during your session windows
• Optional daily VWAP line
The table in the top right shows
Action LONG SHORT IN LONG IN SHORT or WAIT
Session ON or OFF
Bias UP DOWN or FLAT
Pulse value
Compression value
Edge L percent and Edge S percent
How it works in detail
Pulse
For each bar the script measures up wick minus down wick divided by range and multiplies that by the sign of the candle body. The result is averaged with pulse_len. Positive numbers indicate aggressive buying. Negative numbers indicate aggressive selling. You control the minimum absolute value with pulse_thr.
Compression
Compression is the ratio of current range to an average range. You can choose the range basis. HL SMA uses simple high minus low smoothed by range_len. ATR uses classic True Range smoothed by atr_len. Values below comp_thr indicate a coil.
Sweeps and the timer
A sweep occurs when price trades beyond the highest high or lowest low seen in the previous sweep_len bars. A strict sweep requires a close back inside that prior range. The timer measures how many bars have elapsed since the last sweep. Breakout setups require the timer to exceed timer_thr.
Bias on a confirmation timeframe
A higher timeframe candle is read with confirm_tf. If close is above open bias is UP. If close is below open bias is DOWN. This keeps breakouts aligned with the prevailing drift.
Regime filters
Efficiency ratio measures the straight line change over the sum of absolute bar to bar changes over er_len. It rises in trendy conditions and falls in noise. Minimum efficiency is controlled by er_min.
Micro to macro volatility ratio compares a short lookback average range with a longer lookback average range using your chosen basis. For breakouts you usually want micro volatility to be near or above macro hence mvr_min. For reversals you often want micro volatility that is not overheated relative to macro hence mvr_max_rev.
VWAP distance gate
Daily anchored VWAP is rebuilt from the open of each session. The script computes the absolute distance from VWAP in units of your average range and requires that distance to exceed vwap_dist_thr when use_vwap_gate is true. This keeps entries away from the mean.
Edge Score
Each gate contributes a weight that you control. The script sums weights of the satisfied gates and divides by the sum of all weights to produce an Edge percent for long and an Edge percent for short. You can then require a minimum Edge percent using edge_min_pct. This turns the indicator into a step by step checklist that you can tune to your taste.
Using the indicator step by step
Choose markets and timeframes
The logic is designed for liquid instruments. Major currency pairs, index futures and cash index CFDs, and the most liquid crypto pairs work well. On intraday use one to fifteen minutes for signals and fifteen to sixty minutes for confirmation. On swing use one hour to one day for signals and one day for confirmation.
Decide on entry mode
Breakouts require a compression area and a sweep timer. Reversals require a strict sweep and a strong pulse. If you are unsure leave the default which allows both.
Pick a range basis
For FX and crypto HL SMA is often stable. For indices and single name equities with gaps ATR can adapt better. If results look too reactive increase the window. If results are too slow reduce it.
Tune regime filters
If you trade trend continuation raise er_min and mvr_min. If you trade counter rotation lower them and rely on the reversal path with the strict sweep condition.
Set the VWAP gate
Enabling it helps you avoid entries at the mean. Push the threshold higher on range bound days. Reduce it in strong trend days.
Table driven decision
Watch Action and the Edge percents. If the script says WAIT you can read Pulse and Compression to see what is missing. Often the best trades appear when both Edge percents are well separated and your session switch is ON.
Use the visuals
When a suggestion triggers you will see entry stop and targets. You can mirror the levels in your own workflow or use alerts.
Consider bar close
Signals are computed in real time. For a strict process you can wait until the bar closes to reduce noise.
Inputs explained with quick guidance
Setup
Signal TF chooses where the logic is computed. Leave blank to use the chart.
Confirm TF sets the higher timeframe for bias.
Session filter restricts signals to the London and New York windows you specify.
Invert flips long and short. It is useful on inverse instruments.
Logic options
Entry mode allows Breakouts Reversals or Both.
Average range basis selects HL SMA or ATR.
ATR length is used when ATR is selected.
Pulse source can be Regular OHLC or Heikin Ashi. Heikin Ashi smooths noisy series, but the script still runs on regular bars and you should publish and use it on standard candles to respect the platform guidance.
Core numeric settings
Sweep lookback controls the size of the liquidity pool targeted by the sweep condition.
Pulse window smooths the wick polarity measure.
Average range window controls your base range when you use HL SMA.
Pulse threshold sets the minimum polarity required.
Compression threshold sets the maximum current range relative to average to consider the market coiled.
Expansion timer bars sets how much time has passed since the last sweep before you allow a breakout.
Regime filters
Efficiency ratio length and minimum value keep you out of aimless drift.
Micro and Macro range lengths feed the micro to macro ratio.
Minimum micro to macro for breakouts and maximum micro to macro for reversals steer the two entry families.
VWAP gate and distance threshold keep you away from the mean.
Levels and trade management visuals
Runner target in R sets TP2 as a multiple of initial risk.
Stop distance as average range multiple sets initial risk size for the visuals.
Move stop to entry after one R touch turns on break even logic once price has traveled one risk unit.
Trail buffer as R fraction uses the last sweep as an anchor and keeps a dynamic stop at a chosen fraction of R beyond it.
Cooldown after exit prevents immediate re entries.
Edge Score
Weights for pulse compression timer bias efficiency ratio micro to macro VWAP gate and session let you align the checklist with your style.
Minimum Edge percent to suggest applies a final filter to LONG or SHORT suggestions.
UI
Table and markers switch the compact dashboard and the shapes.
TP and SL lines and labels draw and name each level.
TP1 partial label percent is printed in the TP1 label for clarity.
Session shading helps with focus.
Daily VWAP line is optional.
Alerts
The script provides alerts for Long Short Exit and for Edge percent crossing the threshold on either side. Use them to drive notifications or to sync with webhooks and your broker integration. Alerts trigger in real time and will repaint during a bar. For conservative use trigger on bar close.
Recommended presets
Intraday trend continuation
Confirm TF fifteen minutes
Entry mode Breakouts
Range basis HL SMA
Pulse threshold near 0.10
Compression threshold near 0.60
Timer around 18
Minimum efficiency ratio near 0.20
Minimum micro to macro near 1.00
VWAP gate enabled with distance near 0.35
Edge minimum 50 or higher
Intraday mean reversion at sweeps
Entry mode Reversals
Pulse source Regular OHLC
Compression threshold can be a little higher
Maximum micro to macro near 1.60
Efficiency ratio minimum lower near 0.12
VWAP gate enabled
Edge minimum 40 to 60
Swing trend continuation
Signal TF one hour
Confirm TF one day
Range basis ATR
ATR length around 14
Average range window 20 to 30
Efficiency ratio minimum near 0.18
Micro to macro windows 12 and 60
Edge minimum 50 to 70
These are starting points only. Your instrument and timeframe will require small adjustments.
Limitations and honest warnings
No indicator is perfect. TwinPulse will mark attractive conditions that do not always lead to profitable trades. During economic releases or very thin liquidity the assumptions behind compression and sweeps may fail. In strong gap environments the HL SMA basis may lag while ATR may overreact. Heikin Ashi pulse can help in choppy markets but it will lag during sharp reversals. Session times use the exchange time of your chart. If you switch symbol or exchange verify the windows.
Edge percent is not a probability of profit. It is the fraction of satisfied gates with your chosen weights. Two traders can set different weights and see different Edge readings on the same bar. That is the design. The score is a guide that helps you act with discipline.
This indicator does not place orders or manage real risk. The lines and labels show a model entry a model stop and two model targets built from the average range at entry and from recent swing points. Use them as references and not as hard rules. Always test on historical data and demo first. Past results do not guarantee anything in the future.
Credits and originality
All code in this publication is original and written for this indicator. The concept of the efficiency ratio originates from Perry Kaufman. The use of a daily anchored volume weighted average price is a standard industry tool. The specific combination of pulse from wick polarity strict sweep timing compression and the tunable Edge Score is unique to this script at the time of publication. If you reuse parts of the open source code in your own work remember to credit the author and contribute meaningful improvements.
How to read the table at a glance
Action reflects your current state.
IN LONG or IN SHORT appears while a trade is active.
LONG or SHORT appears when conditions for entry are met and the Edge threshold is satisfied.
WAIT appears when at least one gate is missing.
Session shows ON during your chosen windows.
Bias shows the color of the confirmation candle.
Pulse is the smoothed polarity number.
Comp shows current range divided by the average range. Values below one mean compression.
Edge L percent and Edge S percent show the long and short checklists as percents.
Final thoughts
Markets move because orders accumulate at certain prices and at certain times. The indicator tries to measure two things that often matter at those turning points. One is the existence of a hidden imbalance revealed by wick polarity and by sweeps of prior extremes. The other is the presence of energy stored in a coil that can release in the direction of a drift. Neither force guarantees profit. Together they can improve your selection and your timing.
Use the defaults for a few days so you learn the personality of the signals. After that adjust one group at a time. Start with the session filter and the Edge threshold. Then tune compression and the timer. Finally adjust the regime filters. Keep notes. You will learn which weights matter for your market and timeframe. The result is a process you can apply with consistency.
Disclaimer
This script and description are for education and analysis. They are not investment advice and they do not promise future results. Use at your own risk. Test thoroughly on historical data and in simulation before considering any live use.

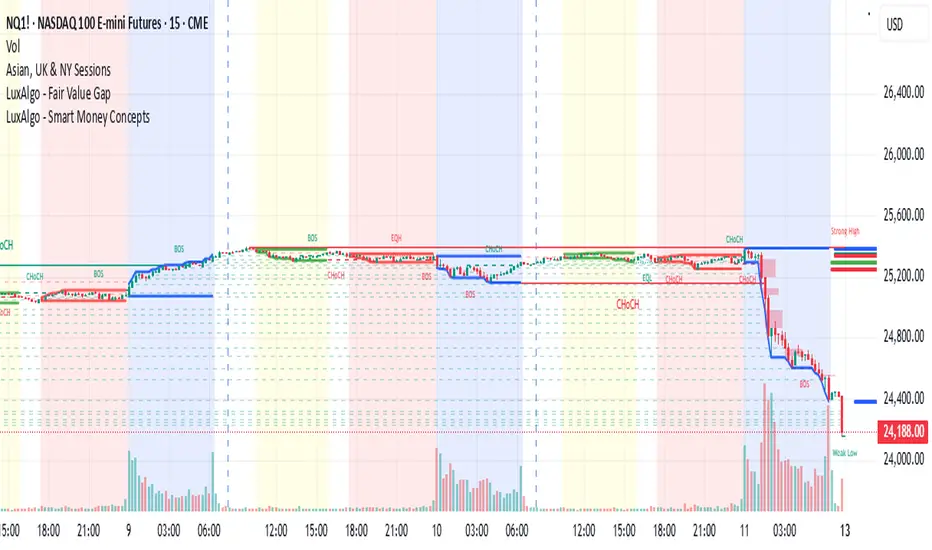
Asian, UK & NY SessionTimes and Day Highs and LowsWhat It Does
The Asian, UK & NY Sessions indicator automatically identifies and highlights the three major global trading sessions on your chart.
For each session, it:
Detects session time in its local timezone.
Tracks the session’s highest and lowest prices.
Plots colored horizontal lines to show those levels throughout the trading day.
Optionally shades each session’s background in its signature color for instant visual context:
🟡 Asian Session: Yellow background
🔴 London Session: Red background
🔵 New York Session: Blue background
This helps traders see how price reacts within and between sessions — spotting overlaps, liquidity zones, and daily ranges.
⚙️ Inputs and Variables
Input Description
Extend lines until next session start (extendLines) Extends each session’s high/low lines forward until the next session begins.
Show prices in scale column (showScaleValues) Controls whether the price labels for session highs/lows appear on the chart’s right-hand price scale.
Show All Session Highs & Lows (showAllHighsLows) Master switch — turn this off to hide all session lines instantly, keeping the chart clean.
Show Session Backgrounds (showBackgrounds) Turns all background shading on or off. When off, all session colors disappear.
Background Opacity (bgOpacityAll) Adjusts the transparency for all session backgrounds (0 = solid, 100 = fully transparent).
🎨 Visual Color Scheme
Session Background High/Low Line
Asian Yellow Green
London Red Red
New York Blue Blue
Each color has a consistent role — making it easy to distinguish sessions even in replay or live view.
Price Tracking:
For each session, the indicator resets High and Low when the new session starts, then updates them as bars print.
Display Control:
If lines or backgrounds are disabled via settings, they’re completely hidden (no clutter, no partial transparency).
💡 How Traders Use It
Identify daily ranges in each global session.
Compare volatility between markets.
Align entries or exits with session transitions.
Observe how price respects previous session highs/lows.
Orderflow Label with OffsetThis Pine Script automatically displays orderflow labels on the chart to visualize the current market structure and potential breakout or reversal zones.
It compares the current candle’s high and low with those of the previous cycle (e.g., 90 minutes) and places descriptive labels that highlight possible bullish or bearish behavior.
Functionality & Logic (Step-by-step explanation)
Inputs:
cycleLength: Defines the duration of one “cycle” in minutes (for example, 90 minutes).
labelXOffset: Moves the label a few bars to the right, so it doesn’t overlap the current candle.
labelStyleOffset: Controls whether labels appear pointing to the right or left side of the chart.
Previous Cycle:
The script uses request.security to retrieve the high and low from the previous cycle timeframe.
These act as reference points (similar to key levels or market structure highs/lows).
Current Candle:
The script reads the current bar’s high, low, and close values for comparison.
Orderflow Conditions:
bullSupport: The current high and close are both above the previous high → bullish breakout (strong continuation).
bullReject: The high breaks above the previous high but closes below → bullish rejection / possible top.
bearRes: The low and close are both below the previous low → bearish breakdown (continuation to downside).
bearReclaim: The low goes below the previous low but closes above → bearish reclaim / possible reversal.
Label Logic:
Before creating a new label, the previous one is deleted (label.delete(flowLbl)) to avoid clutter.
The label’s X position is shifted using xPos = bar_index + labelXOffset.
The style (left/right) is set based on the user’s preference.
Displayed Labels:
🟢 Bullish Breakout → price closes above the previous cycle high.
🟠 Bullish Rejection → fake breakout or possible top.
🔴 Bearish Breakdown → price closes below the previous cycle low.
🟡 Bearish Reclaim → failed breakdown or potential trend reversal.
⚪ Neutral (Wait) → no clear signal, advises patience and watching for setups (like CHoCH or FVGs).
Visual Behavior:
The labels appear slightly to the right of the bar for better visibility.
The color and text alignment dynamically adjust depending on whether the label is pointing left or right.
