Exponential Moving Average (EMA)

EMA Ribbons
The Gray Ribbon (EMA 1–3) is designed for trend trading. When the market is trending, price tends to respect the ribbon and bounce off it. If price frequently chops through the ribbon, the market is likely ranging and the ribbon should be ignored.
The 100 EMA and 200 EMA (EMA 4 & 5) are commonly used as dynamic support and resistance levels.
EMA 6 & 7 are calculated from a higher timeframe to provide broader market context.

EMA and Dow Theory Strategies V2📘 Overview
This strategy is an advanced evolution of the original EMA × Dow Theory hybrid model. V2 introduces true swing‑based trend detection, gradient trend‑zones, higher‑timeframe swing overlays, and dynamic exit logic designed for intraday to short‑term trading across crypto, forex, stocks, and indices.
The system provides precise entries, adaptive exits, and highly visual guidance that helps traders understand trend structure at a glance.
🧠 Key Features
🔹 1. Dual‑EMA Trend Logic (Symbol + External Index)
Both the chart symbol and an external index (OTHERS.D) are evaluated using fast/slow EMAs to determine correlation‑based trend bias.
🔹 2. Dow Theory Swing Detection (Real‑time)
The script identifies swing highs/lows and updates trend direction when price breaks them. This creates a structural trend model that reacts faster than EMAs alone.
🔹 3. Gradient Trend Zones (Visual Trend Strength)
When trend is up or down, the area between price and the latest swing level is filled with a multi‑step gradient. This makes trend strength and distance-to-structure visually intuitive.
🔹 4. Higher‑Timeframe Swing Trend (htfTrend)
Swing highs/lows from a higher timeframe (e.g., 4H) are plotted to show macro structure. Used only for visual context, not for filtering entries.
🔹 5. RSI‑Based Entry Protection
RSI prevents entries during extreme overbought/oversold conditions.
🔹 6. Dynamic Exit System
Includes:
Custom stop‑loss (%)
Partial take‑profit (TP1/TP2/TP3)
Automatic scale‑out when trend color weakens
“Color‑change lockout” to prevent immediate re‑entry
Real‑time PnL tracking and labels
🔹 7. Alerts for All Key Events
Entry, stop‑loss, partial exits, and trend‑change exits all generate structured JSON alerts.
🔹 8. Visual PnL Labels & Equity Tracking
PnL for the latest trade is displayed directly on the chart, including scale‑out adjustments.
⚙️ Input Parameters
Parameter Description
Fast EMA / Slow EMA EMAs used for symbol trend detection
Index Fast / Slow EMA EMAs applied to external index
StopLoss (%) Custom stop‑loss threshold
Scale‑Out % Portion to exit when trend color weakens
RSI Period / Levels Overbought/oversold filters
Swing Detection Length Bars used to detect swing highs/lows
Stats Display Position of statistics table
🧭 About htfTrend (Higher Timeframe Trend)
The higher‑timeframe swing trend is displayed visually but not used for entry logic.
Why? Strict HTF filtering reduces trade frequency and often removes profitable setups. By keeping it visual‑only, traders retain flexibility while still benefiting from macro structure awareness.
Use it as a contextual guide, not a constraint.
📘 概要
本ストラテジーは、V1 を大幅に拡張した EMA × ダウ理論 × スイング構造 × 上位足トレンド可視化 の複合型モデルです。 短期〜デイトレード向けに最適化されており、仮想通貨・FX・株式・指数など幅広いアセットで利用できます。
V2 では、スイング構造の自動検出、グラデーションによるトレンド強度の可視化、上位足スイングライン、動的な利確/損切りロジック が追加され、視覚的にもロジック的にも大幅に強化されています。
🧠 主な機能
🔹 1. 銘柄+外部インデックスの EMA クロス判定
対象銘柄と OTHERS.D の EMA を比較し、相関を考慮したトレンド方向を判定します。
🔹 2. ダウ理論に基づくスイング高値・安値の自動検出
スイング更新によりトレンド方向を切り替える、構造ベースのトレンド判定を採用。
🔹 3. グラデーション背景によるトレンド強度の可視化
スイングラインから現在価格までを段階的に塗り分け、 「どれだけトレンドが伸びているか」を直感的に把握できます。
🔹 4. 上位足スイングトレンド(htfTrend)の表示
4H などの上位足でのスイング高値・安値を表示し、 大局的なトレンド構造を視覚的に把握できます(ロジックには未使用)。
🔹 5. RSI による過熱・売られすぎフィルター
極端な RSI 状態でのエントリーを防止。
🔹 6. 動的イグジットシステム
カスタム損切り(%)
TP1/TP2/TP3 の段階的利確
トレンド色の弱まりによる自動スケールアウト
色変化後の再エントリー制限(waitForColorChange)
リアルタイム PnL の追跡とラベル表示
🔹 7. アラート完備(JSON 形式)
エントリー、損切り、部分利確、トレンド反転などすべてに対応。
🔹 8. 損益ラベル・統計表示
直近トレードの損益をチャート上に表示し、視覚的に把握できます。
⚙️ 設定項目
設定項目名 説明
Fast / Slow EMA 銘柄の EMA 設定
Index Fast / Slow EMA 外部インデックスの EMA 設定
損切り(%) カスタム損切りライン
部分利確割合 トレンド弱化時のスケールアウト割合
RSI 期間・水準 過熱/売られすぎフィルター
スイング検出期間 スイング高値・安値の検出に使用
統計表示位置 テーブルの表示位置
🧭 上位足トレンド(htfTrend)について
上位足スイングの更新に基づくトレンド判定を表示しますが、 エントリー条件には使用していません。
理由: 上位足を厳密にロジックへ組み込むと、トレード機会が大幅に減るためです。
本ストラテジーでは、 「大局の把握は視覚で、エントリーは柔軟に」 という設計思想を採用しています。
→ 裁量で利確判断や逆張り回避に活用できます。

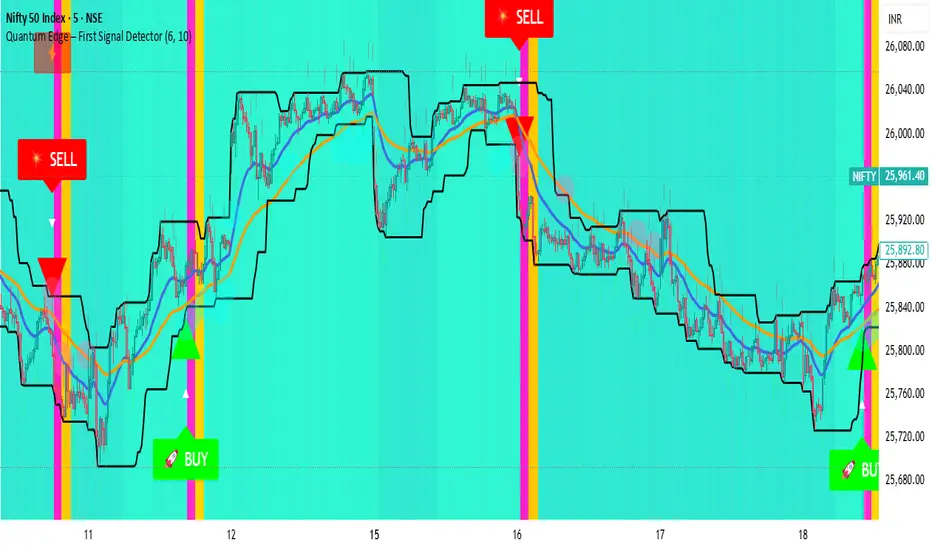
Quantum Edge First Signal DetectorQuantum Edge is a non-repainting, multi-confirmation indicator that detects the first high-probability BUY & SELL signals using momentum, trend, volume, volatility, and price-action voting logic.
🧠 About This Indicator
Quantum Edge – First Signal Detector is designed to solve one common trader problem:
too many late or repeated signals.
Instead of firing continuous entries, this indicator focuses only on the FIRST valid signal after a market shift — helping traders enter early, reduce noise, and avoid over-trading.
It uses a quantum-style voting engine where multiple independent market factors must align before a signal is confirmed.
⚙️ Core Logic (How It Works)
Each candle is evaluated using 6 independent factors:
RSI Momentum
Bullish when RSI > 50
Bearish when RSI < 40
Price Location
Price near recent highs or lows
Volume Expansion
Current volume above moving average
EMA Trend Direction
EMA 20 vs EMA 50
Candle Strength
Strong bullish or bearish candle bodies
Volatility Filter
ATR-based low volatility confirmation
Each factor gives 1 vote.
When minimum confirmations are met, a FIRST BUY or FIRST SELL signal is generated.
🚀 Key Features
✅ First-Signal-Only Logic
Only the first BUY or SELL after trend change
No repeated signals in the same direction
Built-in signal cooldown (user-controlled)
✅ Non-Repainting
Signals are confirmed on candle close
No future data, no repainting
✅ Smart Trend Filtering
EMA-based directional bias
Avoids weak counter-trend entries
✅ Advanced Visual System
Clear BUY / SELL triangles
Trend, volume & momentum backgrounds
Support & resistance zones
Market sentiment bar coloring
✅ Alert Support
Buy alert
Sell alert
📊 Best Timeframes
Scalping: 1m – 5m
Intraday: 5m – 15m
Swing Confirmation: 30m – 1H
Works on:
Forex
Crypto
Indices
Stocks
🎯 How to Trade (Simple Guide)
BUY Setup
✔ First BUY signal appears
✔ Trend is bullish
✔ Use nearby support as reference
SELL Setup
✔ First SELL signal appears
✔ Trend is bearish
✔ Use nearby resistance as reference
Always combine with risk management.
Disclaimer: This indicator is for educational purposes only and does not constitute financial advice. Trading involves risk. Use proper risk management.
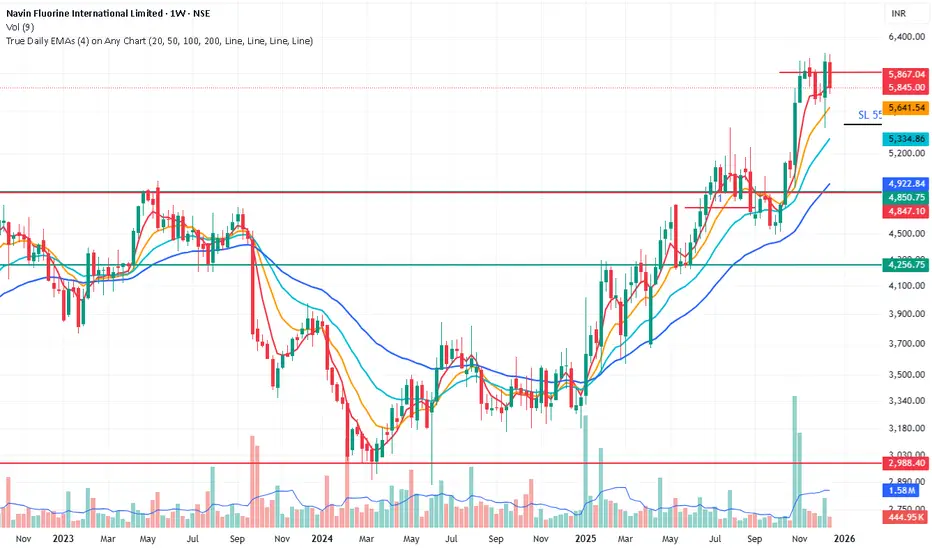
True Daily EMAs (4) on Any ChartIt calculated the 4 EMAs based on days as input. Even on a weekly or monthly chart it shows 20/50/100/200 Day EMAs. Changing the time frame of chart does not effect the EMAs

EMA Strategy Flip/DCA + PnL (Aidan)This is a long only , trend focused EMA strategy designed for capital preservation and entries in sustained market movement, rather than short term trading.
At its core, the system is intentionally simple:
-Uses a dual EMA trend structure to identify bullish and bearish regimes
-Avoids unnecessary exits when price action is indecisive
-Emphasizes staying aligned with the larger market direction
All of these characteristics inherently work best on longer time frames, I typically use the 1D view but have also tested in the 1W and 4H views as well.
Philosophy 🧠
Markets do not move in clean, continuous trends. They alternate between:
-Expansion (breakouts/breakdowns)
-Compression (consolidation/chop)
Most traditional EMA crossover strategies fail because they:
-Overreact during consolidation
-Constantly flip positions
-Slowly bleed capital in sideways markets
This indicator attempts to solve that issue by filtering how sell signals are treated depending on market behavior, rather than blindly acting on every crossover. These are denoted by the "weak sell" indications which are defined by the length of each EMA expansion period.
HOW IT WORKS ⚙️
Buy Signals
Buy signals are generated when the EMA structure flips bullish.
On higher timeframes, these buys aim to align with broader market momentum, not short-term noise.
Weak Sell vs Strong Sell
Not every bearish EMA flip is treated equally. Short, flickering EMA flips (common in consolidation) are treated as “weak sells”, meaning the position is held. The length that defines each "weak sell" can be edited through settings under "flip-distance regime" if you so choose. I keep mine between 20-30 ticks.
Capital is not forced out of the market prematurely. Only when an EMA move shows sufficient trend persistence does the indicator issue a strong sell, fully closing the position.
DCA-Friendly by Design
One of the strengths of this indicator is that it can be used in a dollar-cost-averaging (DCA) mindset.
Some users may choose to:
-Simply buy on each buy signal
-Hold positions through weak sell periods
-Use strong sell signals as higher-confidence exits
This approach can be particularly effective for traders or investors with a long-term outlook who prefer gradual position building with less emotion on each buy. The amount of max tolerable DCA entries can be edited through settings (default 6)
Best Practices & Usage Notes
-This indicator performs best on 4H and 1D charts (be sure to note your "flip distance regime" in settings or the weak sell periods may be inaccurate)
-Blue chip and macro markets prove to yield the most consistent results during back testing, although I've seen impressive results on volatile markets as well.
-It is not designed for scalping or very low timeframes
-No indicator is perfect — not every buy or sell will be optimal
-For best results, it should be used alongside:
-Higher-timeframe trend analysis
-Market structure (higher highs / higher lows)
-Macro context or sector strength
-Your own risk management rules
Think of this tool as a framework, not a prediction engine. When used with discipline and proper context, it can serve as a reliable indicator for traders focused on sustainable growth rather than constant activity.
I am always open to suggestions on improvements; please feel free to comment below and let me know any ideas you might have for bettering the indicator, or if you just have questions I'll be happy to answer any!
Good luck out there!!

RiskyInvesting Algo v1.0.0 - BasicA multi‑layer trend‑following and momentum‑confirmation system designed around dual adaptive baselines, and smart candle‑strength filtering. This indicator blends volatility‑based trailing logic with macro trend bias tools (EMA + SMMA) to identify clean directional flips and filter out weak signals.
This indicator uses 5 parameters to determine the trend direction.
Disclaimer:
- Please use this in conjunction with other tools and confirmations. Labels are not meant to be used as financial advice.
Core features include:
- Two Adaptive Trailing Baselines: ATR‑adjusted equations (Parameter 1 & 2) that flip direction based on baseline breaks.
- Directional Shift Detection: Buy markers on bullish dual‑baseline flip; sell markers on bearish dual‑baseline flip.
- Trend Bias Filtering: Uses EMA vs SMMA relationship to color signals and provide market bias context.
- Candle Strength Filter: Ensures signals only trigger on meaningful momentum candles relative to ATR.
- Clean Visual Display: Auto‑coloring buy/sell labels, baseline plots, and signal triangles.
🟩/🟥 = Strong Directional Bias
🟦/🟧 = Neutral Directional Bias
Built for traders who want a structured trend‑flip system that avoids noise, highlights strong directional moments, and maintains visual clarity even on volatile intraday charts.

Triple EMA// Triple EMA indicator designed for TradingView free users.
// Displays 3 standard EMAs in one indicator slot.

llama fixed-length moving averages [SMA, WMA]Llama Moving Averages
I needed moving averages on my charts, but I wanted them hardcoded based on the following values:
timframe --- MA length
Daily --- 20D (==1 trading month)
Weekly --- 30W (30W moving averages for assessing long term trends)
15m --- 1W (or 5 days)
Two averages:
EMA and WMA: fast moving and slow moving based on closes.
In addition to this, I needed the following things:
1. MAs ONLY on 15m, 1D and 1W timeframes.
2. Consistent colors.
3. for 15m chart, we want a 5D SMA, so 1D = 15m * 25(±1); times 5; 25*5 = 125
4. Option to configure different values for the daily chart, since I trade the daily chart. Defaults: 20.
If you were looking for something similar, enjoy!

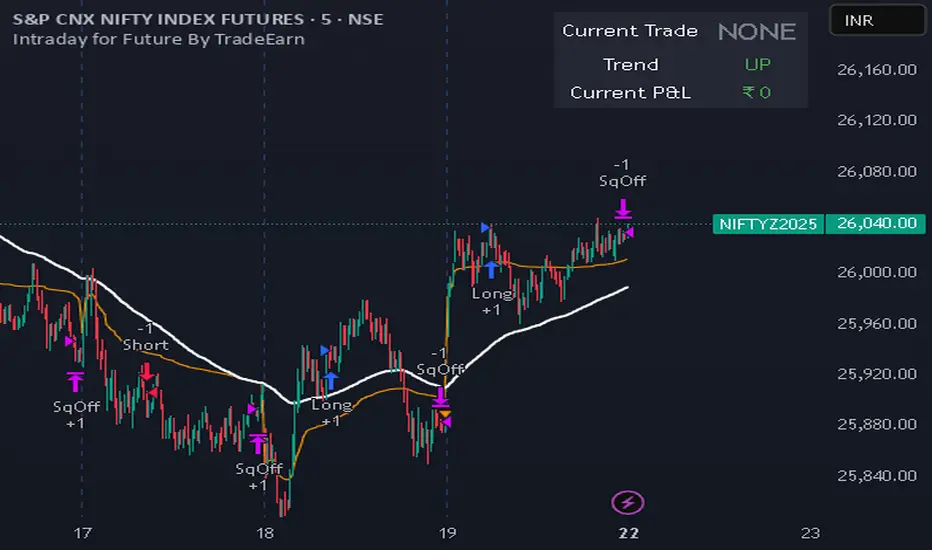
Intraday for Future By TradeEarnIntraday Strategy (StochRSI + VWAP + EMA)
Overview The Intraday Pullback Scalper is a specialized trend-following strategy designed for futures and equity traders who prefer to enter existing trends on pullbacks rather than chasing breakouts. By combining volume-weighted data (VWAP) with exponential moving averages (EMA) and momentum oscillators (Stochastic RSI), this script identifies high-probability entry points during intraday sessions. It includes built-in automation hooks (Alerts) compatible with bridge services for seamless execution.
How It Works
The strategy relies on a three-step confirmation process to filter noise and precision-time entries:
Trend Definition (The Filter):
VWAP (Volume Weighted Average Price): Acts as the primary regime filter. Longs are only permitted if price > VWAP; Shorts only if price < VWAP.
EMA (Exponential Moving Average): A secondary trend filter (default 100 periods) ensures alignment with the broader trend.
Time Range Breakout (Optional): Users can enable an "Initial Balance" filter where trades are only taken if the price breaks out of a specific time range (e.g., first hour High/Low).
Entry Trigger (The Signal):
Long Entry: The market must be in an Uptrend (Price > VWAP & EMA). The script waits for a "dip" where the Stochastic RSI drops below the Oversold level (default 20) and then crosses back up.
Short Entry: The market must be in a Downtrend (Price < VWAP & EMA). The script waits for a "rally" where the Stochastic RSI rises above the Overbought level (default 80) and then crosses back down.
Risk Management:
The strategy uses fixed Target Profit and Stop Loss values defined in currency (₹) relative to the trade quantity.
It features visual SL and TP lines on the chart for the duration of the trade to assist with manual monitoring.
Key Features
Universal Compatibility: Works on the "Current Chart" (Nifty, Bank Nifty, Stocks, Commodities) without needing complex dropdown selection.
Visual Dashboard: An on-screen table displays the Current Trade Status (Long/Short), Trend Direction, and Running P&L in real-time.
Algobaba Bridge Ready: Pre-formatted alert messages are included for users utilizing the Algobaba bridge for automation (supports MIS/NRML product types).
Customizable Trend Filters: Users can toggle the Time Range filter or adjust the VWAP Anchor (Session, Week, Month).
Settings & Configuration
Trade Quantity: Set your default lot size (e.g., 50 for Nifty).
Risk Settings: Define Target and Stop Loss in Rupees (₹) per trade setup.
Indicators: Adjustable lengths for EMA, RSI, and Stochastic.
Trading Window: Restrict entries to specific session hours (e.g., 09:15 - 15:10).
⚠️ IMPORTANT DISCLAIMER & RISK WARNING ⚠️
1. Educational Purpose Only This strategy script is provided solely for educational, informational, and research purposes. It does not constitute financial advice, investment recommendations, or a solicitation to buy or sell any securities, futures, or derivatives. The author is not a SEBI registered Research Analyst or Investment Advisor.
2. No Guarantee of Profit The "P&L" and performance metrics displayed on the chart are hypothetical and based on historical data. Past performance is not indicative of future results. Market conditions change, and a strategy that worked in the past may fail in the future.
3. Limitations of Backtesting
Slippage & Commission: The script results may not fully account for real-world execution costs such as broker commissions, taxes (STT/GST), slippage, or liquidity issues.
Repainting/Data Lag: While every effort is made to ensure code stability, real-time data feeds may vary from historical data due to internet latency or data provider differences.
4. High Risk in Derivatives Trading Futures and Options (F&O) involves a substantial risk of loss and is not suitable for every investor. You can lose more than your initial capital. Please assess your risk tolerance and financial situation before trading.
5. Automation & Third-Party Tools This script includes alert messages formatted for third-party bridge services (e.g., Algobaba). The author assumes no responsibility for:
Technical failures, API errors, or connectivity issues with your broker or bridge provider.
Incorrect order execution resulting from automation.
Users are solely responsible for monitoring their trades and verifying order execution.
Usage Agreement By using this script, you acknowledge that you are trading at your own risk and hold the author harmless from any losses incurred. Always test on a paper trading account before deploying real capital.
Boyen_Multi EMA LTF HTFKey Features:
Short-Term Trend (Lower Timeframe - LTF):
EMA 13: A 13-period EMA that reacts quickly to recent price changes, ideal for capturing short-term momentum and early trend shifts.
EMA 21: A 21-period EMA offering a slightly smoother view of price action, balancing sensitivity and reliability for short-term analysis.
EMA 25: A 25-period EMA providing additional confirmation of short-term trends with a bit more lag for stability.
Medium-Term Trend:
SMA 100: A 100-period SMA that serves as a benchmark for medium-term trend direction, often used to gauge broader market sentiment and key levels.
Long-Term Trend (Higher Timeframe - HTF):
EMA 200: A 200-period EMA, widely recognized as a critical long-term trend indicator, helping traders assess the overall market bias.
SMA 300: A 300-period SMA for an even deeper perspective on long-term price movements, smoothing out noise to highlight major trends.

Black OPS Pro Edition (White Knight) v1.0Black OPS Pro Edition (White Knight) v1.0
Black OPS Pro Edition (White Knight) v1.0 is a professional-grade educational trading tool designed for trend analysis, volatility measurement, and intrabar signal detection. It combines ATR-based volatility tracking, Bollinger Bands, EMA bounces, and stochastic filtering to provide clear visual cues on market movements.
Features:
ATR & Volatility Analysis: Tracks market volatility and directional movement.
Bollinger Bands: Upper, lower, and midline bands with smoothing to identify breakouts and pullbacks.
Trend Detection: Automatically identifies bullish, bearish, and neutral trends.
EMA Bounces: Detects price interactions with multiple EMA levels (1- 200).
Stochastic Filter: Confirms trend signals and helps reduce false alerts.
Visual Signals: Up 🚀 and down 💥 arrows for trend flips, plus EMA bounce indicators ⚔️ 🕵️.
Dashboard: Displays current volatility and trend strength.
Background Coloring: Highlights bullish and bearish periods.
Screen-Fixed Disclaimer: Table at the bottom-right with a permanent educational disclaimer.
User Customization:
Adjust ATR length, volatility lookback, Bollinger Band parameters, EMA settings, and other thresholds to fit your trading style.
Disclaimer:
For educational purposes only. This script does NOT provide financial advice or guarantee profits. Users are fully responsible for their own trading decisions and risk management. Always perform your own analysis before making trades.

Smart MA Zone Crossover [HMA-EMA]Smart MA Zone Crossover is a trend-following indicator designed to capture early momentum shifts using the crossover between Hull Moving Average (HMA) and Exponential Moving Average (EMA).
The indicator visually highlights trend direction using a dynamic colored zone, making it easy to identify bullish and bearish market phases at a glance.
🔸 Step 1: Moving Average Calculation
HMA (Hull Moving Average) → Faster, smoother, reacts quickly to price
EMA (Exponential Moving Average) → Stable trend reference
Both MA lengths are **fully adjustable** from the settings panel.
🔸 Step 2: Trend Detection
Bullish Trend: HMA is above EMA
Bearish Trend: HMA is below EMA
The area between the two averages is filled with color to visually represent the current trend state.
Step 3: Signal Generation (Non-Repainting)
Signals are generated **only on confirmed crossovers**:
✅ BUY Signal- HMA crosses above EMA
❌ SELL Signal-HMA crosses belowEMA
Signals do **not repaint** and appear only once per crossover.
🔸 Step 4: Visual Customization
Users can enable or disable:
* Moving average lines
* Colored MA zone fill
* Buy/Sell arrows
* Buy/Sell text labels
This allows the indicator to remain **minimal or detailed**, depending on user preference.
🔹 Key Features
✔ Non-repainting logic
✔ Clean crossover-based signals
✔ Customizable HMA & EMA lengths
✔ Optional MA zone fill
✔ Buy/Sell arrows & labels
✔ Works on all timeframes
✔ Beginner-friendly & scalper-ready
🔹 Best Use Cases
* Trend confirmation
* Momentum trading
* Scalping & intraday trading
* Swing trend filtering
For best results, combine with:
* Support & resistance
* Volume
* Higher-timeframe trend
🔹 Disclaimer
This indicator is provided for **educational purposes only**.
It is **not financial advice**. Always backtest and use proper risk management before trading live markets.

Trend Core Strategy v1.0 - GUMROADLog Regression Channel Pro Strategy
This is a trend-following pullback strategy built for TradingView (Pine Script v6).
It uses logarithmic regression channels to define the market’s primary trend, and looks for low-risk pullback entries within strong trending conditions.
Momentum and trend strength filters are applied to avoid ranging or weak markets.
This strategy is designed to be used when the market is clearly trending, not during choppy or sideways price action.
Best Used When
Strong uptrend or downtrend is present
Price is pulling back toward the regression channel
Volatility is sufficient (ADX confirms trend strength)
Suitable for 1H / 4H timeframes
Commonly used on BTC, ETH, and major crypto pairs
Key Characteristics
Non-repainting logic
Volatility-based risk management (ATR)
Designed for realistic backtesting
No martingale, no grid, no over-optimization
Gumroad Disclaimer (3 Lines)
This strategy is provided for educational purposes only and is not financial advice.
Trading involves risk, and losses may occur.
You are fully responsible for your own trading decisions.

ES Signals (Sequencer Labels)Here i am using EMA crossover systems to catch the market. One can use this with their own choice.
Using Some simple rules, we can get some good quality trades! You can see for yourself before trading.
=== HOW TO USE THIS INDICATOR ===
1) Choose your market and timeframe. ( according to their need )
2) Choose if the strategy is long-only or bidirectional.
Don't overthink nobody knows the best answer of market. We're going to test and find out.
After you find a good combination, set up an alert system with the default Exponential Moving Average indicators provided by TradingView.
=== TIPS ===
Change the Time frame according to their need.
i) for intraday 3-5 minute.
ii) 60 minute for 3-4 days View
iii) Daily for positional
Try a Long-Only strategy to see if that performs better.

EMA Slope Angle V2 Auto Threshold# EMA Slope Angle Indicator
## Overview
The EMA Slope Angle Indicator visualizes the Exponential Moving Average (EMA) slope as an angle in degrees, providing traders with a clear, quantitative measure of trend strength and direction. The indicator features **automatic threshold calculation based on Gaussian distribution**, making it adaptive to any market and timeframe.
## Key Features
### 🎯 **Automatic Threshold Calculation (NEW!)**
- **Gaussian Distribution-Based**: Automatically calculates optimal thresholds from the 50% interquartile range (IQR) of historical angle data
- **Asset-Adaptive**: Thresholds adjust to each instrument's unique volatility and price characteristics
- **No Manual Tuning Required**: Simply enable "Use Auto Thresholds" and let the indicator optimize itself
### 📊 **Dynamic EMA Coloring**
- **Color Intensity**: EMA line color intensity reflects slope strength
- **Visual Feedback**:
- Green shades for uptrends (darker = stronger)
- Red shades for downtrends (darker = stronger)
- Gray for flat/neutral conditions
### 📈 **Regime Detection**
- **Three Regimes**: RISING, FALLING, and FLAT
- **Smart Classification**: Based on statistical distribution of angles
- **Non-Repainting**: All calculations use confirmed bars only
### 🔔 **Trend-Shift Signals**
- **Visual Arrows**: Automatic signals when transitioning from FLAT to RISING/FALLING
- **Configurable**: Enable/disable signals as needed
- **Reliable**: Only triggers on significant regime changes
### 📋 **KPI Dashboard**
- **Real-Time Metrics**: Current angle, regime, and last signal
- **Auto-Threshold Display**: Shows calculated thresholds when auto-mode is active
- **Statistics**: Optional angle distribution statistics
- **Clean Layout**: Top-right corner, non-intrusive
### 📊 **Angle Statistics (Optional)**
- **Distribution Analysis**: Histogram of angle ranges
- **Dynamic Buckets**: Automatically adjusts to data distribution when auto-mode is enabled
- **Percentage Breakdown**: See how often each angle range occurs
## Settings
### Main Settings
- **EMA Length**: Period for the Exponential Moving Average (default: 50)
- **Slope Lookback Bars**: Number of bars to calculate slope over (default: 5)
### Angle Settings
- **Use Auto Thresholds**: Enable automatic threshold calculation (recommended!)
- **Analysis Period**: Number of bars to analyze for distribution (default: 500)
- **Manual Thresholds**: Flat, Rising, and Falling triggers (used when auto-mode is off)
- **Max Angle for Color Saturation**: Maximum angle for color intensity scaling
### Display Options
- **Colors**: Customize uptrend, downtrend, and flat colors
- **Show Signals**: Enable/disable trend-shift arrows
- **Show Statistics**: Display angle distribution table
- **Show Dashboard**: Toggle KPI dashboard visibility
## How It Works
### Angle Calculation
The indicator calculates the angle between the current EMA value and the EMA value N bars ago:
```
Angle = arctan((EMA_now - EMA_then) / lookback) × 180° / π
```
### Auto-Threshold Calculation
When enabled, the indicator:
1. Analyzes historical angle data over the specified period
2. Calculates mean and standard deviation
3. Determines thresholds based on the 50% interquartile range (IQR):
- **Flat Threshold**: ±0.674σ (middle 50% of data)
- **Rising Trigger**: 75th percentile (mean + 0.674σ)
- **Falling Trigger**: 25th percentile (mean - 0.674σ)
### Regime Classification
- **FLAT**: Angle within ±Flat Threshold
- **RISING**: Angle ≥ Rising Trigger
- **FALLING**: Angle ≤ Falling Trigger
## Use Cases
### Trend Following
- Identify strong trends (high angle values)
- Spot trend reversals (regime changes)
- Filter trades based on trend strength
### Range Trading
- Detect flat/consolidation periods
- Avoid trading during choppy markets
- Enter when regime shifts from FLAT to RISING/FALLING
### Multi-Timeframe Analysis
- Apply to different timeframes for confirmation
- Use higher timeframe for trend direction
- Use lower timeframe for entry timing
## Tips for Best Results
1. **Enable Auto-Thresholds**: Let the indicator adapt to your instrument
2. **Adjust Analysis Period**: Use more bars for stable markets, fewer for volatile ones
3. **Combine with Price Action**: Use regime changes as confirmation, not standalone signals
4. **Multi-Timeframe**: Check higher timeframes for trend context
5. **Backtest First**: Test settings on historical data before live trading
## Technical Details
- **Non-Repainting**: All calculations use `barstate.isconfirmed`
- **Pine Script v6**: Latest version for optimal performance
- **Efficient**: Minimal computational overhead
- **Customizable**: Extensive settings for fine-tuning
## Version History
**v2.0** (Current)
- Added automatic threshold calculation based on Gaussian distribution
- Dynamic bucket adjustment for statistics
- Enhanced dashboard with auto-threshold display
- Improved regime detection using IQR method
**v1.0**
- Initial release with manual thresholds
- Basic EMA coloring
- Trend-shift signals
- KPI dashboard
## Support
For questions, suggestions, or bug reports, please leave a comment or contact the author.
---
**Disclaimer**: This indicator is for educational purposes only. Past performance does not guarantee future results. Always use proper risk management and never risk more than you can afford to lose.
**Keywords**: EMA, slope, angle, trend, automatic thresholds, Gaussian distribution, regime detection, non-repainting, adaptive

MultiTimeFrame SMA/EMA & clouds [PACHI]This will allow you to plot multiple moving averages and clouds for the current timeframe and also up to 5 from different timeframes

Trend Prediction Meter [PointAlgo]The Trend Prediction Meter & Levels is a composite market-bias and volatility visualization tool designed to summarize trend strength, momentum, price positioning, and volatility into a single normalized score.
It provides a structured framework to interpret directional bias and probable price expansion zones during active market conditions.
Concept Overview
Markets often reflect multiple conditions simultaneously—trend direction, momentum strength, price location within a range, and volatility.
This indicator combines these elements into a unified Bullish Score (0–100), displayed as a meter and supported by projected ATR-based levels.
Rather than focusing on a single signal, the script aims to present context about current market conditions.
Bullish Score Composition (0–100)
The meter represents a weighted blend of multiple market factors:
1. Trend Strength (EMA Structure)
Uses a fast and slow EMA to assess directional bias.
The distance between EMAs is normalized into a trend strength score.
Strong separation indicates directional conviction; compression suggests balance.
2. Momentum Strength (RSI Blend)
Combines a short-term and mid-term RSI.
Helps capture both immediate momentum and broader directional stability.
Higher readings indicate sustained bullish pressure, lower readings indicate bearish pressure.
3. Position Within Recent Range
Measures where price is trading relative to its recent high–low range.
Values near the top of the range reflect strength; values near the bottom reflect weakness.
Mid-range positioning indicates equilibrium.
4. Volume Participation
Compares current volume against its recent average.
Acts as a minor confidence modifier rather than a primary driver.
Each component is normalized and combined using fixed weights to produce a final Bullish Score between 0 and 100.
Bias Classification
The Bullish Score is translated into descriptive market states:
Extreme Bullish
Very Bullish
Bullish
Neutral
Bearish
Very Bearish
These labels describe current bias, not future certainty.
Meter Visualization
The meter plot dynamically changes color based on the score range.
A dashed midline at 50 represents balance.
Background shading highlights strong bullish or bearish dominance zones.
Crossovers of the 50-level indicate shifts in directional control.
ATR-Based Projection Levels:
To provide volatility context, the indicator calculates ATR-based upside and downside reference levels:
Two potential expansion levels (TP1 and TP2) are projected above and below price.
The distance of these levels adapts based on current bias strength.
These levels are contextual reference zones, not fixed targets.
Prediction Dashboard
An optional side table summarizes key readings at the most recent bar:
Symbol
Current bias label
Bullish Score
Current price
ATR value
Upside and downside projection levels
Directional comment (Upside favoured / Downside favoured / Balanced)
This dashboard is designed to provide a quick structural overview without requiring manual calculation.
Signals & Alerts
Built-in alerts are available for:
Bullish bias conditions
Bearish bias conditions
Bullish Score crossing above 50
Bullish Score crossing below 50
Alerts are informational and reflect internal state changes only.
Customization:
Users can adjust:
RSI lengths
EMA lengths
Range lookback period
ATR parameters
Display options for the meter and dashboard
This allows adaptation across different instruments and timeframes.
Usage Notes
Best suited for analytical interpretation rather than standalone decision-making.
Designed to complement price action, structure, or other indicators.
Works across multiple markets where volume and volatility data are available.
Disclaimer :
This indicator is intended for educational and analytical purposes only.
It does not provide investment, trading, or financial advice.
All signals and levels should be validated with independent analysis and appropriate risk management.

[Backtest Crypto] Cross MAThis script is designed for testing the moving average crossover strategy.
Script settings:
Select testing range
Indicator settings: Select moving average type (EMA, SMA, WMA, SMMA, HMA) and period
Trade management: Select risk-to-reward ratio, stop-loss defined as min/max for a certain number of candles (you can set a desired number), option to partially lock in a position by moving the stop-loss to breakeven, trailing stop, or close a position on an opposite signal.
Option to limit the stop-loss by ATR to prevent it from becoming too large during volatile movements.
===============================================================
Скрипт предназначен для тестирования стратегии пересечение скользящих средних.
Настройки скрипта:
Выбор диапазона тестирования
Настройки индикатора: выбор типа скользящей (EMA, SMA, WMA, SMMA, HMA) и периода
Сопровождение сделки: выбор соотношения риска к прибыли, стоп-лосс определяется как мин/мах за определенное количество свечей (можно устанавливать желаемое количество), возможность частичной фиксации позиции с переносом стоп-лосса в безубыток, трейлинг-стоп, или закрытие позиции по противоположному сигналу.
Возможность ограничения стоп-лосса по ATR, чтобы при волатильных движениях он не был слишком большим.

MA Crossovers (EMA + SMA)A versatile Moving Average tool designed to spot trends using a hybrid EMA/SMA setup. It provides clear visual signals and an on-chart trade simulator to track potential performance.
Features:
Hybrid Setup: Combines a fast EMA (Length 9) with three SMAs (50, 100, 150) for balanced trend detection.
4 Crossover Alerts: Monitors up to 4 different crossover pairs simultaneously with customizable markers.
Visual P&L Simulator: Automatically draws entry/exit lines and calculates Profit/Loss percentages for the primary crossover, helping you visualize trade potential.
Price Labels: Displays the exact price at every crossover point for precision.
Fully Customizable: extensive control over colors, opacity, line widths, and label positioning to keep your chart clean.

TrendSurfer Pro
TrendSurfer Pro 🚀 - Advanced Multi-Signal Trading Indicator
TrendSurfer Pro is a comprehensive all-in-one trading system that combines multiple proprietary algorithms and technical indicators to identify high-probability trading opportunities across all timeframes.
**Key Features:**
🔹 **Master Trend System** - Identifies major trend reversals using a combination of EMAs, RSI, and custom filters
🔹 **Smart Money Analysis** - Order Blocks detection with Z-Score impulse identification and rejection signals
🔹 **Session-Based Trading** - Tokyo, London, and New York session analysis with automatic breakout/rejection detection
🔹 **IFVG Detection** - Institutional Fair Value Gap identification for precision entries
🔹 **Multi-Timeframe Signals** - Triangle signals with volume analysis and VWAP proximity filtering
🔹 **KCandle/Boost System** - Advanced engulfing pattern detection with golden area projections
🔹 **CCI Signals** - Commodity Channel Index crosses with MACD confirmation filter
🔹 **Take Profit System** 🎯 - Advanced exit system combining 8 technical indicators (RSI, MACD, Stochastic, Bollinger Bands, Supertrend, CCI, EMA Cross, Price Action) with customizable confirmation requirements
**Unique Advantages:**
✅ Yellow Box Filter - Proprietary reversal zone detection
✅ Time Filters - Trade only during your preferred hours
✅ VWAP Integration - All signals respect price position relative to VWAP
✅ Customizable Alerts - Get notified for every signal type
✅ Visual Dashboard - Real-time trend confirmation table
Perfect for day traders, swing traders, and scalpers seeking precise entries and optimal exits! 🚀

Trend Fusion Indicator🎯 Trend Fusion Indicator🎯
Professional trading indicator combining EMA momentum with Supertrend volatility for high-probability signals.
📊KEY FEATURES:
• 9 EMA & Supertrend (10,3) crossover signals
• Visual trend direction with colored fills
• Buy/Sell arrows at crossover points
• Real-time trend tracking
• Clean, professional interface
⚡SIGNAL LOGIC:
✅ BUY: When EMA crosses ABOVE Supertrend
✅ SELL: When EMA crosses BELOW Supertrend
🎨VISUAL INDICATORS:
• Green Zone/Fill: Bullish trend (EMA > Supertrend)
• Red Zone/Fill: Bearish trend (EMA < Supertrend)
• Triangle Arrows: Entry signals
• Background Colors: Trend confirmation
⚙️CUSTOMIZABLE SETTINGS:
• EMA Length (Default: 9)
• Supertrend ATR Length (Default: 10)
• Supertrend Factor (Default: 3.0)
🔔ALERTS INCLUDED:
• Buy Alert: EMA crosses above Supertrend
• Sell Alert: EMA crosses below Supertrend
📈 BEST FOR:
• Swing Trading
• Day Trading
• Trend Following
• Market Reversals
⚠️ DISCLAIMER: This indicator is for educational purposes only.
Trading involves risk. Not financial advice. Use at your own risk.
