200 EMA AlertHow It Works:
The 200 EMA calculates the average price over the last 200 periods, giving more weight to recent price movements for a smoother and more responsive trend line.
It helps traders determine whether the market is in a bullish (above 200 EMA) or bearish (below 200 EMA) phase.
Why Traders Use the 200 EMA:
✅ Trend Confirmation – If the price is above the 200 EMA, the trend is bullish; if below, the trend is bearish.
✅ Dynamic Support & Resistance – Price often reacts around the 200 EMA, making it a key level for entries and exits.
✅ Works on All Timeframes – Whether on the 1-minute chart or the daily timeframe, the 200 EMA is effective for scalping, swing trading, and long-term investing.
✅ Easy to Combine with Other Indicators – Traders pair it with RSI, MACD, or price action for stronger confirmation.
How to Use It in Trading:
📌 Trend Trading – Buy when price pulls back to the 200 EMA in an uptrend; sell when price retests it in a downtrend.
📌 Breakout Strategy – A strong candle breaking above/below the 200 EMA signals a possible trend reversal.
📌 Filtering Trades – Many traders only take long trades above and short trades below the 200 EMA to align with the overall market trend.
Conclusion:
The 200 EMA is an essential indicator for traders of all levels, offering clear trend direction, strong support/resistance zones, and trade filtering for better decision-making. Whether you're trading forex, stocks, or crypto, mastering the 200 EMA can give you a significant edge in the markets. 🚀📈
Exponential Moving Average (EMA)

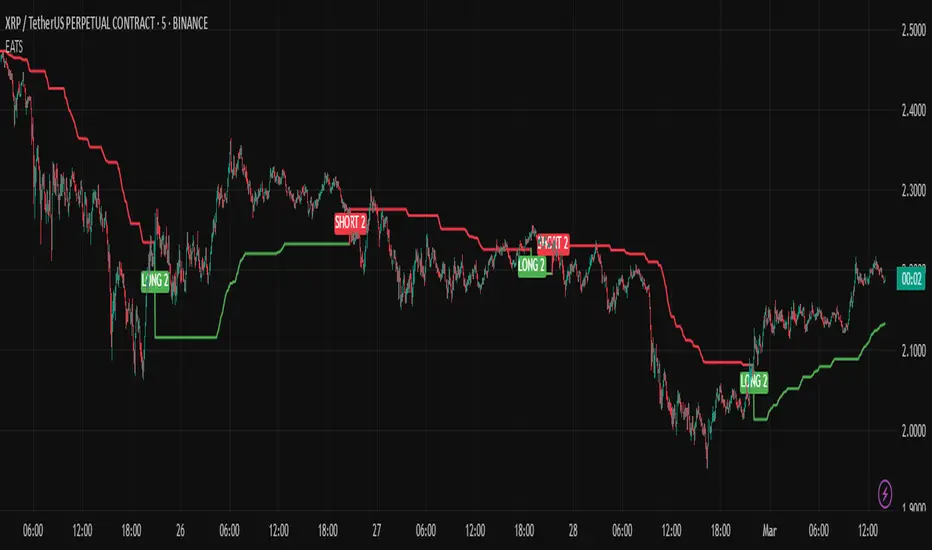
EMA Adaptive Trailing StopThe EMA Adaptive Trailing Stop Strategy is a versatile and comprehensive Pine Script designed for TradingView. This script provides an adaptive trailing stop mechanism that leverages the Exponential Moving Average (EMA) to adjust trailing stops based on market conditions. The strategy dynamically switches between trending and ranging markets by utilizing both Average True Range (ATR) and Average Directional Index (ADX) to detect market conditions.
Key Features:
EMA-Based Trailing Stop:
The script uses the EMA value to set trailing stops precisely. The EMA offers a more responsive calculation to price changes, ensuring closer and more accurate trailing stops that follow market movements effectively.
Market Condition Detection:
The script employs ATR and ADX to distinguish between trending and ranging markets. ATR measures market volatility, while ADX gauges trend strength. The combination of these two indicators provides a more accurate market condition detection.
Customizable Settings:
The script offers various flexible parameters to adjust EMA length, multipliers, and ATR length. Users can customize these settings according to their preferences and trading strategy.
Two Modes:
The script adapts to market conditions by providing two modes: trending mode and ranging mode. In trending mode, the trailing stop is tighter to follow price movements closely, whereas in ranging mode, the trailing stop is looser to accommodate lower volatility.
Entry and Exit Conditions:
The script detects market conditions to set buy and sell signals. These conditions include the calculations of EMA, ATR, and ADX to ensure the signals generated are valid and profitable.
Alerts:
The script provides buy and sell signals through alert conditions for efficient trade management. Users can enable these alerts to get real-time notifications when valid buy or sell signals are detected.
Suitable for Scalping and Swing Trading:
The script is well-suited for both scalping and swing trading strategies. Scalpers can benefit from the responsive and tighter trailing stops during trending conditions, while swing traders can take advantage of the adaptive and looser trailing stops during ranging conditions, allowing them to capture larger price movements.
Explanation of Mode 1 and Mode 2:
Mode 1: Trending Market:
In this mode, the market is identified as trending based on the ADX and ATR values.
LONG 1: This label indicates a buy signal in the trending market mode. It signifies that the trailing stop has been activated and a long position (buy) should be taken when the market is trending.
SHORT 1: This label indicates a sell signal in the trending market mode. It signifies that the trailing stop has been activated and a short position (sell) should be taken when the market is trending.
Mode 2: Ranging Market:
In this mode, the market is identified as ranging based on the ADX and ATR values.
LONG 2: This label indicates a buy signal in the ranging market mode. It signifies that the trailing stop has been activated and a long position (buy) should be taken with a looser trailing stop when the market is ranging.
SHORT 2: This label indicates a sell signal in the ranging market mode. It signifies that the trailing stop has been activated and a short position (sell) should be taken with a looser trailing stop when the market is ranging.
Technical Usage:
Variable Initialization:
The script initializes variables to store values such as trailing stop, long position status, and short position status.
Market Condition Detection:
The script calculates ATR and ADX values to detect whether the market is trending or ranging. This includes the use of f_adx function to calculate ADX values and determine market conditions.
EMA-Based Trailing Stop Calculation:
The script adjusts the trailing stop based on EMA values and ATR. The calculation involves customizable multipliers and parameters that influence the trailing stop's precision.
Plot Trailing Stop:
The script displays the trailing stop on the chart for clear visualization. This includes plotting the trailing stop line with appropriate colors to indicate long and short positions.
Entry and Exit Conditions:
The script determines the entry (buy) and exit (sell) conditions based on market condition detection and trailing stop settings. These conditions are crucial for generating valid buy or sell signals.
Plotshape and Alert:
The script provides plotshapes for buy and sell signals and sets up alert conditions for real-time notifications when a valid buy or sell signal is detected.
POC-Candle-EMA-ATR-LongShadow-50percCandleThis is a script for those who trade based on volume and smart money strategies.
Some of the features of this script:
- Display "Time Price Opportunity Chart". These points help traders to identify price opportunities over time and have a better analysis of the market.
- Mark candles that have traded more volume than previous candles.
- Mark candles whose body is at least and not more than 50% of the total candle size, these candles can be found more easily in smart money strategies.
- Mark spike candles to find FVG faster
- Mark candles that have a shadow of at least more than 380 points and can be good reversal points.
- EMA indicator to check the market trend
- DonchianChannel indicator to check the price trend on the chart
Regards

IBS (Internal Bar Strength) Trading Strategy for SPY and NDQImplementation by AlgoTradeKit
Overview
The IBS Trading Strategy is a daily bars long-only trading system, based on the concept of Internal Bar Strength (IBS). The strategy aims to identify potential reversals by monitoring how the previous bar’s close positions itself within its high-low range. It is suitable for stock and US indices. The default parameters are optimized for SPY/SPX and NDQ/QQQ
Strategy Concept
The Internal Bar Strength (IBS) is calculated using the formula:
IBS = (Previous Close - Previous Low) / (Previous High - Previous Low)
This value always lies between 0 and 1. An IBS value below 0.2 is typically interpreted as an oversold condition, while a value above 0.9 suggests an overbought state.
Trading Rules
- Long Entry :
- Condition 1 : IBS is below the user-defined entry threshold (default is 0.2).
- Condition 2 : The current price is above an N-period Exponential Moving Average (EMA) (default period is 252).
- Note : You can disable the EMA condition by setting the EMA period to 0.
- Long Exit
- The position is closed when IBS rises above the user-defined exit threshold (default is 0.9).
Customization Options
- IBS Entry Threshold : Adjust to set the sensitivity for entering a long trade based on oversold conditions.
- IBS Exit Threshold : Customize to define the exit point when the market becomes overbought.
- EMA Period : Set the lookback period for the EMA to align with your trend bias; disable this condition by setting the period to 0.
Risk Management & Trading Considerations
- Designed for daily charts, the strategy captures higher timeframe trends and minimizes noise.
- The entry and exit conditions are straightforward, aiming to avoid over-trading while letting clear signals dictate trade management.
- Always use proper risk management techniques and test the strategy thoroughly on historical data and in a simulated environment before applying it in live markets.
Disclaimer
This strategy is for educational and informational purposes only and does not constitute financial advice. Trading involves risk, and past performance is not indicative of future results. Always conduct your own research and consider your risk tolerance before making any trades.

Smart Buy/Sell Signal IndicatorOverview
The Smart Buy/Sell Signal Indicator is a multi-factor trading tool that i ntegrates Supertrend, Bollinger Bands, RSI, ADX, and Moving Averages to generate high-probability buy and sell signals. Unlike simple crossover-based strategies, this indicator leverages multiple layers of confirmation to reduce false signals and improve trade execution accuracy.
This indicator is designed for trend-following traders, scalpers, and swing traders, helping them identify key reversal points and momentum shifts with precise breakout conditions.
How It Works
The Smart Buy/Sell Signal Indicator filters out weak trade signals by combining trend, volatility, momentum, and strength indicators in the following manner:
✅ Supertrend-Based Trend Filtering:
• The script checks if the price is above or below the Supertrend level before confirming a buy or sell signal.
• Buy signals occur below the Supertrend Down level, confirming support.
• Sell signals occur above the Supertrend Up level, confirming resistance.
✅ Bollinger Bands for Overbought & Oversold Conditions:
• Buy signals are confirmed when price touches the Bollinger Lower Band (suggesting oversold conditions).
• Sell signals are confirmed when price touches the Bollinger Upper Band (suggesting overbought conditions).
• This ensures that trades occur at high-probability reversal zones, rather than random price action.
✅ RSI Momentum Confirmation:
• Buy trades trigger when RSI is below 50 (indicating strength building from an oversold region).
• Sell trades trigger when RSI is above 50 (indicating weakness forming in an overbought region).
• This ensures signals are momentum-backed and not counter-trend moves.
✅ ADX Strength Confirmation:
• The script filters signals using the ADX (Average Directional Index) to ensure that only trades with sufficient market strength are executed.
• If the ADX value is below a threshold (default: 15), the signal is ignored to prevent false breakouts in choppy markets.
✅ Confirmation Moving Average (MA) for Trend Validation:
• The script applies an additional confirmation filter using a Moving Average (SMA/EMA).
• Buy signals trigger only when the price is above the MA, aligning with trend direction.
• Sell signals trigger only when the price is below the MA, ensuring alignment with the broader market structure.
✅ Trade Cooldown Mechanism (Minimum Bars Between Signals):
• To avoid frequent signals in sideways markets, a cooldown period is implemented.
• Default: 5 bars between signals (adjustable).
• Prevents rapid consecutive trades, reducing false entries.
Key Features
✔️ Supertrend & Moving Average Confirmation – Ensures trades are taken only in the correct trend direction.
✔️ Bollinger Bands Integration – Helps identify high-probability reversal zones.
✔️ ADX Strength Filtering – Ensures trades are only executed when the market has enough strength.
✔️ Momentum-Based RSI Filtering – Avoids counter-trend trades and confirms directional strength.
✔️ Trade Cooldown Mechanism – Reduces overtrading and noise in sideways markets.
✔️ Webhook Alerts for Automation – Auto-execute trades or receive real-time notifications.
✔️ Customizable Inputs – Adjustable thresholds, EMA/SMA length, ADX filter, cooldown period for flexibility.
✔️ Works Across Multiple Timeframes – Suitable for scalping (5m, 15m), swing trading (1H, 4H), and position trading (Daily).
How to Use
📌 Scalping & Intraday Trading:
• Use on 5m, 15m, or 30m timeframes.
• Look for Bollinger Band touch + RSI confirmation + Supertrend support/resistance validation before entering trades.
📌 Swing Trading:
• Use on 1H or 4H timeframes.
• Enter only when ADX is strong and price aligns with Supertrend direction.
📌 Webhook Automation:
• Set up TradingView Alerts to auto-execute trades via Webhook-compatible platforms.
Why This Combination?
This indicator is not just a simple moving average crossover tool.
It is designed to filter out weak breakouts and only execute trades that have:
✅ Trend confirmation (Supertrend + Moving Average)
✅ Volatility filtering (Bollinger Bands for overbought/oversold confirmation)
✅ Momentum validation (RSI threshold filtering)
✅ Market strength requirement (ADX ensures sufficient momentum)
This multi-layered approach ensures that only the highest-quality setups are executed, improving both win rate and reliability.
Why It’s Worth Using?
🚀 Reduces False Breakouts – Avoids weak breakouts by requiring ADX confirmation.
🚀 Works in All Market Conditions – Trend-following logic for trending markets, volatility-based entries for reversals.
🚀 Customizable to Any Trading Style – Adjustable parameters for trend, momentum, and strength filtering.
🚀 Seamless Webhook Automation – Execute trades automatically with TradingView alerts.
🚀 Ready to trade smarter?
✅ Add the Smart Buy/Sell Signal Indicator to your TradingView chart today! 🎯🔥

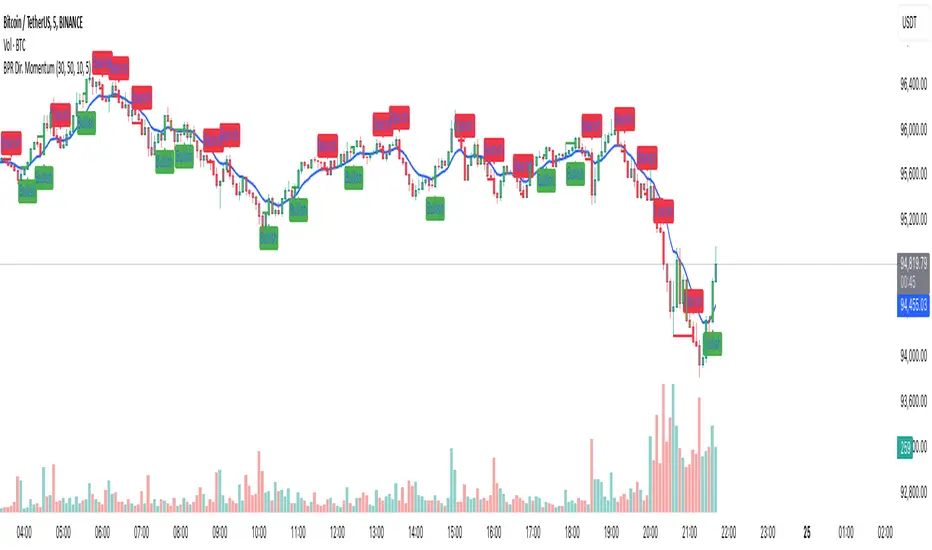
Balance Price Range (BPR) IndicatorOverview
The BPR with Directional Momentum-Filtered Breakouts indicator is designed to identify Balanced Price Ranges (BPR) and d etect high-probability breakouts and breakdowns with directional momentum confirmation . By leveraging historical BPR structures, EMA-based momentum filtering , and a trade cooldown mechanism , this script provides a structured approach to identifying potential trading opportunities while reducing false signals.
This invite-only indicator is ideal for traders who seek precise breakout confirmation, reduced noise, and trend-following logic while maintaining flexibility through adjustable parameters.
How It Works
The script follows a multi-step breakout detection process by integrating multiple key technical components:
1. Balanced Price Range (BPR) Detection:
• A Balanced Candle is identified when the price remains within a specific percentage of its range midpoint.
• These BPR zones represent areas of equilibrium , where a breakout or breakdown is likely to occur.
• The script historically tracks BPR levels across the entire chart to monitor price action around key areas.
2. Momentum-Filtered Breakout & Breakdown Logic:
• Bullish Breakout: Occurs when the price breaks above the historical BPR high with bullish momentum.
• Bearish Breakdown: Occurs when the price breaks below the historical BPR low with bearish momentum.
• Momentum Confirmation: Each breakout requires a strong directional move, measured against the Exponential Moving Average (EMA) .
• Only confirmed breakouts are marked, reducing the likelihood of false signals in choppy markets.
3. Candle-Based Background Visualization:
• Grey Background: Represents a Balanced Price Range (BPR), indicating potential breakout zones.
• Green Background: Indicates a Bullish Breakout when the price successfully breaks and holds above the BPR high.
• Red Background: Indicates a Bearish Breakdown when the price drops below the BPR low.
4. Trade Cooldown Mechanism:
• Prevents consecutive signals from triggering too frequently.
• Default cooldown period: 5 bars (adjustable).
• Ensures that trades are not clustered, improving signal quality.
5. EMA for Trend Direction & Confirmation:
• A 20-period EMA (default, adjustable) is used to confirm trade direction.
• Breakouts above the EMA align with uptrend continuation.
• Breakdowns below the EMA align with downtrend momentum.
Key Features
✔️ Historical BPR Detection – Tracks past BPR levels across the entire chart for structured breakout zones.
✔️ Momentum-Based Breakouts – Ensures breakouts are confirmed by directional price movement before generating signals.
✔️ Candle-Based Background Logic – Subtle candle highlights rather than full background fills, for better chart clarity.
✔️ Trade Cooldown Period – Prevents consecutive buy/sell signals within a defined period, improving signal efficiency.
✔️ Dynamic EMA Confirmation – Ensures trades align with the overall trend, reducing counter-trend trades.
✔️ Customizable Inputs – Adjust breakout thresholds, EMA length, and cooldown periods as per trading style.
✔️ Works Across Multiple Timeframes – Can be applied to intraday, swing, and positional trading strategies.
How to Use
1. Look for Balanced Price Ranges ( BPR )
• These zones highlight equilibrium areas where price is likely to break out.
• Grey-shaded candles indicate potential breakout zones.
2. Monitor for Bullish or Bearish Breakouts
• A green candle background signals a bullish breakout above BPR.
• A red candle background signals a bearish breakdown below BPR.
• The EMA filter helps confirm whether the breakout aligns with the prevailing trend.
3. Follow the Cooldown Logic
• After a breakout signal, wait for the cooldown period before another trade is allowed.
• This helps filter out noisy price action and prevents excessive trading.
4. Use Alongside Other Indicators
• Works well with volume analysis, support/resistance levels, and price action strategies.
• Can be combined with other momentum indicators for further trade confirmation.
Why This Combination?
Unlike generic breakout indicators, this script uniquely combines:
• BPR historical structures for defining potential breakout zones.
• Momentum-based breakout filtering using EMA confirmation.
• Trade cooldown logic to avoid excessive trading signals.
• Subtle candle-based highlights instead of cluttered full-background fills.
This structured approach makes the indicator more robust, adaptive, and reliable in different market conditions.
Why It’s Worth Using?
🔹 Avoid False Breakouts: Built-in momentum confirmation prevents weak or fake breakouts.
🔹 Clean Visualization: No excessive overlays—just precise, meaningful background coloring for breakouts.
🔹 Works in Any Market: Use on stocks, crypto, forex, indices, and commodities across different timeframes.
🔹 User-Friendly & Customizable: Fine-tune parameters to match individual trading styles.
⚠️ Note: This is an Invite-Only script. Access is granted to selected users.
✅ If you find it useful, consider incorporating it into your trend-following & breakout trading strategies.
🚀 Optimize your trading with structured breakout detection! 🚀
Bar Color - Moving Average Convergence Divergence [nsen]The Pine Script you've provided creates a custom indicator that utilizes the MACD (Moving Average Convergence Divergence) and displays various outputs, such as bar color changes based on MACD signals, and a table of data from multiple timeframes. Here's a breakdown of how the script works:
1. Basic Settings (Input)
• The script defines several user-configurable parameters, such as the MACD values, bar colors, the length of the EMA (Exponential Moving Average) periods, and signal smoothing.
• Users can also choose timeframes to analyze the MACD values, like 5 minutes, 15 minutes, 1 hour, 4 hours, and 1 day.
2. MACD Calculation
• It uses the EMA of the close price to calculate the MACD value, with fast_length and slow_length representing the fast and slow periods. The signal_length is used to calculate the Signal Line.
• The MACD value is the difference between the fast and slow EMA, and the Signal Line is the EMA of the MACD.
• The Histogram is the difference between the MACD and the Signal Line.
3. Plotting the Histogram
• The Histogram values are plotted with colors that change based on the value. If the Histogram is positive (rising), it is colored differently than if it's negative (falling). The colors are determined by the user inputs, for example, green for bullish (positive) signals and red for bearish (negative) signals.
4. Bar Coloring
• The bar color changes based on the MACD's bullish or bearish signal. If the MACD is bullish (MACD > Signal), the bar color will change to the color defined for bullish signals, and if it's bearish (MACD < Signal), the bar color will change to the color defined for bearish signals.
5. Multi-Timeframe Data Table
• The script includes a table displaying the MACD trend for different timeframes (e.g., 5m, 15m, 1h, 4h, 1d).
• Each timeframe will show a colored indicator: green (🟩) for bullish and red (🟥) for bearish, with the background color changing based on the trend.
6. Alerts
• The script has alert conditions to notify the user when the MACD shows a bullish or bearish entry:
• Bullish Entry: When the MACD turns bullish (crosses above the Signal Line).
• Bearish Entry: When the MACD turns bearish (crosses below the Signal Line).
• Alerts are triggered with custom messages such as "🟩 MACD Bullish Entry" and "🟥 MACD Bearish Entry."
Key Features:
• Customizable Inputs: Users can adjust the MACD settings, histogram colors, and timeframe options.
• Visual Feedback: The color changes of the histogram and bars provide instant visual cues for bullish or bearish trends.
• Multi-Timeframe Analysis: The table shows the MACD trend across multiple timeframes, helping traders monitor trends in different timeframes.
• Alert Conditions: Alerts notify users when key MACD crossovers occur.

3x Supertrend + EMA200 Signal Buy/Sell [nsen]The indicator uses signals from three Supertrend lines to determine whether to trade Buy or Sell, with the assistance of a moving average for bias.
Buy/Sell signals are generated when the conditions are met:
A Buy signal is triggered when all three Supertrend lines indicate a bullish trend and are above the EMA.
A Sell signal is triggered when all three Supertrend lines indicate a bearish trend and are below the EMA.
Indicator ใช้สัญญาณจาก Supertrend ทั้งหมด 3 เส้น โดยใช้ในการกำหนดว่าจะเลือกเทรด Buy หรือ Sell โดยการใช้ moveing average เข้ามาช่วยในการ bias
แสดงสัญญาณ Buy/Sell เมื่อเข้าเงื่อนไข
- Supertrend ทั้ง 3 เส้นเป็นสัญญาณ Bullish และอยู่เหนือเส้น EMA จะเปิดสัญญาณ Buy
- Supertrend ทั้ง 3 เส้นเป็นสัญญาณ Bearish และอยู่ใต้เส้น EMA จะเปิดสัญญาณ Sell

3 Period EMA Cloud [deepakks444]3 Period EMA Cloud Indicator
The 3EMA Cloud Indicator uses three key EMAs to capture trends and display the market's direction through a color-coded cloud. The EMAs used in this indicator are:
High EMA: The EMA of the high prices over a specified period.
Low EMA: The EMA of the low prices over a specified period.
Additional EMA: An extra EMA, typically based on the close prices, that serves as an independent confirmation tool for trend direction.
Indicator Logic and Cloud Visualization:
The cloud is drawn between the high EMA and the low EMA, and its color changes based on the price's relationship to the high EMA, low EMA, and additional EMA.
Cloud Color:
Green Cloud: When the price is above both the high EMA and the low EMA, it signals a bullish trend, and the cloud turns green.
Additionally, if the close price is above the Additional EMA, this further confirms the bullish trend.
Red Cloud: When the price is below both the high EMA and the low EMA, it signals a bearish trend, and the cloud turns red.
Additionally, if the close price is below the Additional EMA, this further confirms the bearish trend.
How the Indicator Captures Trends:
Bullish Market:
Price above both high EMA and low EMA: This indicates that the market is in an uptrend, and the cloud will turn green.
Confirmation with Additional EMA: When the close price is above the Additional EMA, this reinforces the bullish market sentiment.
The green cloud is the visual confirmation of a bullish trend, guiding traders to consider long positions.
Bearish Market:
Price below both high EMA and low EMA: This indicates that the market is in a downtrend, and the cloud will turn red.
Confirmation with Additional EMA: When the close price is below the Additional EMA, this confirms the bearish trend.
The red cloud is the visual confirmation of a bearish trend, guiding traders to consider short positions.
Key Components:
High EMA: Calculates the EMA based on high prices, which helps to determine the upper boundary of the cloud.
Low EMA: Calculates the EMA based on low prices, which helps to determine the lower boundary of the cloud.
Additional EMA: An extra EMA (often of the close prices) that acts as an independent trend confirmation. This is used to validate the market direction and filter out potential false signals.
Use Cases for the 3EMA Cloud:
Trend Identification:
The cloud helps to visually identify the prevailing trend. A green cloud suggests a bullish trend, while a red cloud indicates a bearish trend.
Confirmation Tool:
The Additional EMA serves as an additional confirmation tool. A close price above the Additional EMA signals a strong bullish trend, while a close below it signals a strong bearish trend.
Market Reversals:
When the price moves from above both the high EMA and low EMA to below them (or vice versa), this could indicate a trend reversal. Pay attention to cloud color changes and the movement of the close price relative to the Additional EMA for potential reversal signals.
Entry and Exit Signals:
Long Entry (Buy Signal):
Price is above both the high EMA and low EMA, confirming a bullish trend.
Close price is above the Additional EMA, confirming the bullish trend.
Enter a long position when the cloud turns green and the confirmation by the Additional EMA is in place.
Short Entry (Sell Signal):
Price is below both the high EMA and low EMA, confirming a bearish trend.
Close price is below the Additional EMA, confirming the bearish trend.
Enter a short position when the cloud turns red and the confirmation by the Additional EMA is in place.
Exit Signal:
Exit Long Position when the price moves below both the high EMA and low EMA (signaling a potential trend reversal), or if the close price falls below the Additional EMA.
Exit Short Position when the price moves above both the high EMA and low EMA (signaling a potential trend reversal), or if the close price rises above the Additional EMA.
How This Indicator Improves Trend Following:
The 3EMA Cloud indicator enhances trend-following strategies by:
Visual Clarity: The color-coded cloud provides immediate visual feedback on whether the market is in a bullish or bearish phase.
Price Confirmation: The indicator uses the relationship of price to three EMAs (high, low, and additional) to confirm trend strength, which can help reduce false signals.
Flexibility: The Additional EMA adds flexibility by serving as an independent confirmation tool for trend direction, ensuring that you don’t enter trades based on weak or choppy market conditions.
This 3EMA Cloud indicator is designed to help traders follow and confirm trends with precision, improving their ability to identify strong market movements and avoid getting caught in sideways or choppy conditions. It provides a clear visual cue for potential buy and sell opportunities based on price relative to multiple EMAs, ensuring that trend-following strategies are robust and effective.
Disclaimer:
This script and its associated indicators are for educational purposes only. The information provided does not constitute financial advice or a recommendation to buy or sell any financial instruments. Users are advised to conduct their own research and consult with a professional financial advisor before making any trading decisions. Trading and investing involve risk, and users should be aware of the risks involved in financial markets.
Sniper TradingSniper Trader Indicator Overview
Sniper Trader is a comprehensive trading indicator designed to assist traders by providing valuable insights and alerting them to key market conditions. The indicator combines several technical analysis tools and provides customizable inputs for different strategies and needs.
Here’s a detailed breakdown of all the components and their functions in the Sniper Trader indicator:
1. MACD (Moving Average Convergence Divergence)
The MACD is a trend-following momentum indicator that helps determine the strength and direction of the current trend. It consists of two lines:
MACD Line (Blue): Calculated by subtracting the long-term EMA (Exponential Moving Average) from the short-term EMA.
Signal Line (Red): The EMA of the MACD line, typically set to 9 periods.
What does it do?
Buy Signal: When the MACD line crosses above the signal line, it generates a buy signal.
Sell Signal: When the MACD line crosses below the signal line, it generates a sell signal.
Zero Line Crossings: Alerts are triggered when the MACD line crosses above or below the zero line.
2. RSI (Relative Strength Index)
The RSI is a momentum oscillator used to identify overbought or oversold conditions in the market.
Overbought Level (Red): The level above which the market might be considered overbought, typically set to 70.
Oversold Level (Green): The level below which the market might be considered oversold, typically set to 30.
What does it do?
Overbought Signal: When the RSI crosses above the overbought level, it’s considered a signal that the asset may be overbought.
Oversold Signal: When the RSI crosses below the oversold level, it’s considered a signal that the asset may be oversold.
3. ATR (Average True Range)
The ATR is a volatility indicator that measures the degree of price movement over a specific period (14 bars in this case). It provides insights into how volatile the market is.
What does it do?
The ATR value is plotted on the chart and provides a reference for potential market volatility. It's used to detect flat zones, where the price may not be moving significantly, potentially indicating a lack of trends.
4. Support and Resistance Zones
The Support and Resistance Zones are drawn by identifying key swing highs and lows over a user-defined look-back period.
Support Zone (Green): Identifies areas where the price has previously bounced upwards.
Resistance Zone (Red): Identifies areas where the price has previously been rejected or reversed.
What does it do?
The indicator uses swing highs and lows to define support and resistance zones and highlights these areas on the chart. This helps traders identify potential price reversal points.
5. Alarm Time
The Alarm Time feature allows you to set a custom time for the indicator to trigger an alarm. The time is based on Eastern Time and can be adjusted directly in the inputs tab.
What does it do?
It triggers an alert at a user-defined time (for example, 4 PM Eastern Time), helping traders close positions or take specific actions at a set time.
6. Market Condition Display
The Market Condition Display shows whether the market is in a Bullish, Bearish, or Flat state based on the MACD line’s position relative to the signal line.
Bullish (Green): The market is in an uptrend.
Bearish (Red): The market is in a downtrend.
Flat (Yellow): The market is in a range or consolidation phase.
7. Table for Key Information
The indicator includes a customizable table that displays the current market condition (Bull, Bear, Flat). The table is placed at a user-defined location (top-left, top-right, bottom-left, bottom-right), and the appearance of the table can be adjusted for text size and color.
8. Background Highlighting
Bullish Reversal: When the MACD line crosses above the signal line, the background is shaded green to highlight the potential for a trend reversal to the upside.
Bearish Reversal: When the MACD line crosses below the signal line, the background is shaded red to highlight the potential for a trend reversal to the downside.
Flat Zone: A flat zone is identified when volatility is low (ATR is below the average), and the background is shaded orange to signal periods of low market movement.
Key Features:
Customizable Time Inputs: Adjust the alarm time based on your local time zone.
User-Friendly Table: Easily view market conditions and adjust display settings.
Comprehensive Alerts: Receive alerts for MACD crossovers, RSI overbought/oversold conditions, flat zones, and the custom alarm time.
Support and Resistance Zones: Drawn automatically based on historical price action.
Trend and Momentum Indicators: Utilize the MACD and RSI for identifying trends and market conditions.
How to Use Sniper Trader:
Set Your Custom Time: Adjust the alarm time to match your trading schedule.
Monitor Market Conditions: Check the table for real-time market condition updates.
Use MACD and RSI Signals: Watch for MACD crossovers and RSI overbought/oversold signals.
Watch for Key Zones: Pay attention to the support and resistance zones and background highlights to identify market turning points.
Set Alerts: Use the built-in alerts to notify you of buy/sell signals or when it’s time to take action at your custom alarm time.

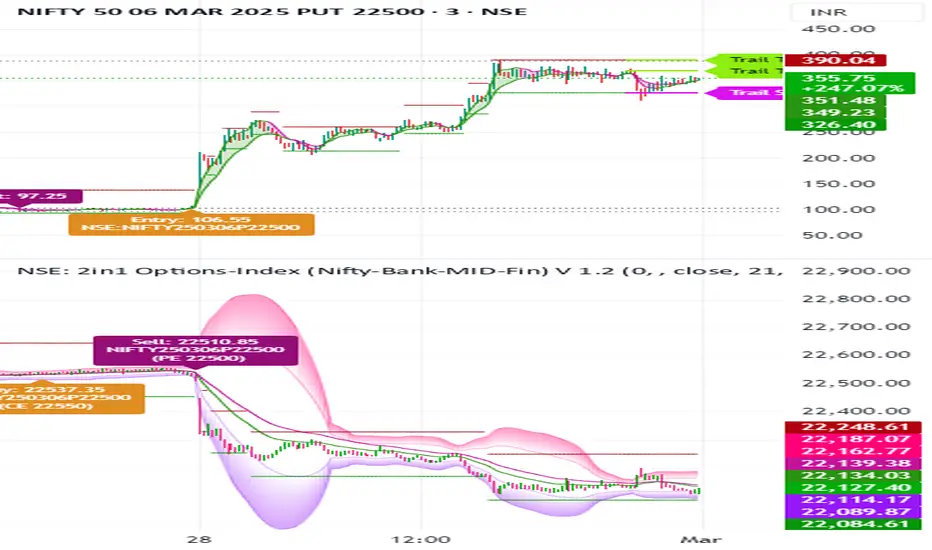
NSE: 2in1 Options-Index (Nifty-Bank-MID-Fin)
1. Using Two Charts in One Indicator with Buy and Sell Signals on Both Charts
Dual-Chart Functionality: This indicator allows you to monitor two charts simultaneously – the main chart (Options) and the underlying index chart (NIFTY, BANKNIFTY, etc.).
The index chart (below the main chart) shows the underlying index movement.
The main chart displays the Options data (e.g., NIFTY options, BANKNIFTY options).
Buy/Sell Signals on Both Charts:
Buy and sell signals are generated on both the options chart and the index chart, ensuring you don’t miss any trading opportunities.
This dual-chart setup helps you correlate the movement of the index with the options data for better decision-making.
2. Works Across Major Indices (NIFTY, BANKNIFTY, FINNIFTY, etc.)
Automatic Index Detection: The script automatically detects the underlying index based on the chart symbol. It supports:
NIFTY, BANKNIFTY, FINNIFTY, MIDCPNIFTY, SENSEX
Flexibility: Whether you’re trading NIFTY options or BANKNIFTY options, the indicator adapts to the selected index and provides accurate signals.
3. Helps You Select ATM, ITM, and OTM Strikes (Ideal for Beginners and Advanced Traders)
ATM (At-The-Money) Strike Calculation:
The script calculates the ATM strike price based on the current spot price of the underlying index.
ITM (In-The-Money) and OTM (Out-Of-The-Money) Strikes:
Users can adjust the strike price using a slider to select ITM or OTM strikes.
This feature is especially helpful for beginners who are learning about options trading and want to understand the difference between ITM, ATM, and OTM strikes.
Strike Price Display:
The selected strike price is displayed on the chart, making it easy to identify the right strike for your trades.
4. Double EMA Selection for Trading
Customizable EMAs:
The script uses two Exponential Moving Averages (EMAs) to generate signals:
Short EMA (Default: 21 periods)
Long EMA (Default: 34 periods)
Users can customize the EMA lengths based on their trading strategy.
5. Option Chart in the Main Chart with Index Chart Below for Easy Monitoring
Integrated Chart Setup:
The main chart displays the options data (e.g., NIFTY options, BANKNIFTY options).
The index chart (below the main chart) shows the underlying index movement.
Benefits:
This setup allows you to monitor both the options and the index in a single view, making it easier to:
Correlate the movement of the index with the options data.
Identify trading opportunities directly on the chart.
No need to switch between multiple charts – everything is in one place.
6. Targets and Stop-Loss When the Signal is Generated
Dynamic Targets and Stop-Loss:
The script calculates targets and stop-loss levels based on the Predicted Range (PR) bands.
Trailing Stop-Loss:
The stop-loss level adjusts dynamically as the price moves in your favor.
Target Levels:
Two target levels are provided (Target 1 and Target 2) based on the PR bands.
Visual Indicators:
Targets and stop-loss levels are plotted on the chart with labels and lines for easy reference.
Colors:
Trailing Stop: Light Pink
Target 1: Light Green
Target 2: Light Green
7. Various Other Options in One Indicator
Advanced Statistical Bands (KRO Settings):
The script includes Kernel Regression Oscillator (KRO) settings for advanced traders.
Plots upper and lower bands based on standard deviation and kernel regression.
Helps identify overbought and oversold conditions.
Customizable Alerts:
Users can enable/disable alerts for:
Buy/Sell signals.
Trailing stop-loss hits.
Target achievements.
Summary of Benefits
All-in-One Tool: Combines candlestick analysis, EMAs, options strike selection, targets, stop-loss, and advanced statistical bands in a single indicator.
Beginner-Friendly: Helps new traders understand ATM, ITM, and OTM strikes while providing clear buy/sell signals.
Advanced Features: Includes KRO settings, dynamic targets, and trailing stop-loss for experienced traders.
Dual-Chart Setup: Monitor options and the underlying index simultaneously for better decision-making.
Customizable: Adjust EMA lengths, strike prices, colors, and alerts to suit your trading style.
Squeeze Momentum Indicator with Entry Tactics### **Squeeze Momentum Indicator with Stacked EMAs**
#### **Description:**
This indicator is an enhanced version of the **Squeeze Momentum Indicator** (originally by John Carter and later modified by LazyBear). It identifies **periods of consolidation (squeeze)** and signals potential **explosive price moves** when momentum shifts. The added **stacked EMA concept** further refines entry signals by confirming trend strength. This is also an update to version 6 of PineScript
#### **How to Use:**
The indicator provides **three different entry tactics**, allowing traders to choose signals based on their strategy:
1. **Inside Day Pattern** – Detects inside candles, which indicate potential breakouts when volatility contracts.
2. **Consecutive Black Crosses (Squeeze Signal)** – A certain number of black crosses (low volatility periods) suggests a strong move is coming.
3. **Stacked EMA Concept** – When the **8 EMA > 21 EMA > 34 EMA**, combined with a momentum shift from negative to positive, it signals a **high-probability bullish entry**.
#### **Visual Cues:**
- **Histogram Bars**: Show momentum (green for increasing bullish, red for increasing bearish).
- **Black & Gray Dots**: Represent different squeeze states (low volatility vs. breakout conditions).
- **🔥 Bullish Label**: Appears when the stacked EMAs align and momentum shifts from negative to positive.
#### **Best Practices:**
- Look for **momentum shifts during a squeeze** for high-probability trades.
- Use **stacked EMAs as trend confirmation** before entering.
- Combine with **price action and volume analysis** for additional confluence.
This indicator helps traders **anticipate major price moves** rather than react, making it a powerful tool for trend-following and breakout strategies. 🚀

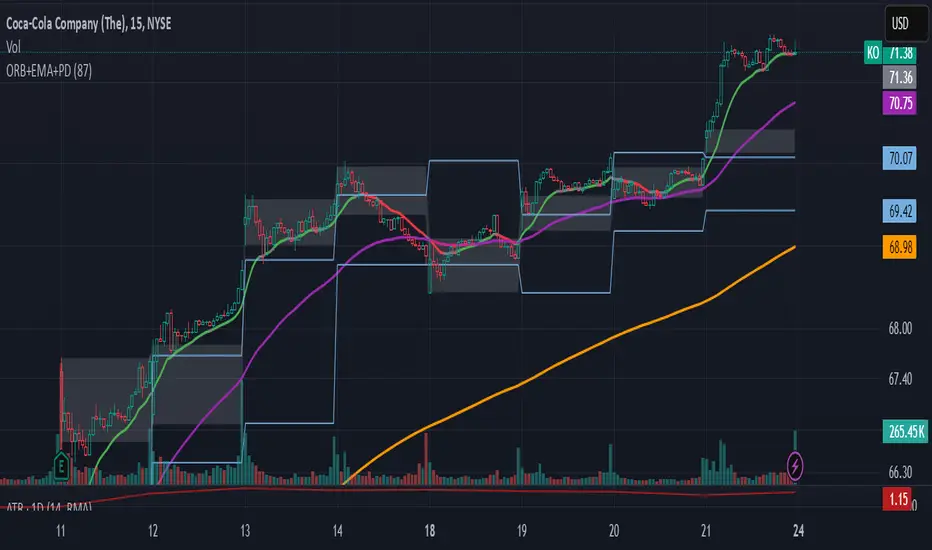
ORB-5Min + Adaptive 12/48 EMA + PDH/PDL
Overview:
This indicator combines the 5-Minute Opening Range Breakout (ORB), Adaptive 12/48 Exponential Moving Averages (EMAs), and Previous Day High/Low (PDH/PDL) levels to help traders identify key intraday levels and market trends.
Key Components and Logic:
5-Minute Opening Range Breakout (ORB):
Displays the high and low from the first 5-minute candle of the trading session.
Includes customizable opacity for the range fill.
Helps traders spot breakout opportunities and key support/resistance zones.
Adaptive 12/48 EMA System:
Displays EMAs for 9, 12, 48, and 200 periods.
The 12 EMA changes color based on whether the price is entirely above or below it.
The 48 EMA changes color depending on its relationship with the 12 EMA.
Provides dynamic trend identification and potential entry/exit signals.
Previous Day High/Low (PDH/PDL):
Displays the previous day’s high and low levels.
Useful for tracking key intraday support/resistance levels and potential reversal points.
Summary:
This script stands out by blending three popular intraday tools into a single comprehensive indicator. The combined visualization provides a layered market context that assists traders in making informed decisions quickly. The color-adaptive EMAs add clarity to trend direction, while the ORB and PDH/PDL levels highlight significant price zones for breakout or reversal trades.
How to Use:
Breakout Trades: Watch for price breaks above the ORB high or below the ORB low, especially when supported by EMA trends.
Trend Confirmation: Use the color-adaptive 12/48 EMA system to gauge momentum and market direction.
Reversal or Continuation: Observe how price reacts around PDH/PDL levels, especially if confluence with EMAs occurs.
This indicator is suitable for day traders seeking a clear and efficient way to track market structure, identify trends, and spot potential trade opportunities during regular market hours.
TTC EMA Scalping Machine with RSI Filter and MACDTTC EMA Scalping Machine with RSI Filter and MACD
TTC EMA Scalping Machine with RSI Filter and MACD is a multi-layered technical analysis tool designed for traders looking to scalp the markets with a combination of trend-following and momentum-based indicators. This strategy leverages Exponential Moving Averages (EMAs) , Relative Strength Index (RSI) , MACD , and Volume Analysis to help traders identify high-probability entry points for short and long trades. The indicator can be used in multiple market conditions and is suited for both beginners and experienced traders looking for clear entry signals.
---
Key Features :
1. EMA-Based Trend Filtering :
- The indicator uses four Exponential Moving Averages (EMAs) with different periods:
- EMA 10 (Short-Term) : The fastest-moving average for detecting quick price movements.
- EMA 20 (Medium-Term) : A central trendline for market momentum.
- EMA 30 (Long-Term) : To observe broader market trends.
- EMA 50 (Longest-Term) : To identify the overall market direction.
- These EMAs are plotted on the chart and used to create EMA bands , visually displaying potential support and resistance levels. Price action inside these bands helps identify scalping opportunities.
2. RSI Filter :
- RSI (Relative Strength Index) is used to gauge overbought and oversold conditions in the market:
- Overbought condition (RSI > 70) : The market may be overextended, signaling the possibility of a short.
- Oversold condition (RSI < 30) : The market may be undervalued, signaling the possibility of a long.
- The RSI filter ensures that trades are not taken when the market is overextended, offering a more conservative approach to trade entries.
3. MACD Momentum Analysis :
- The MACD (Moving Average Convergence Divergence) indicator is included to confirm the trend and momentum direction:
- Long Condition : The MACD line crosses above the signal line, confirming a bullish momentum.
- Short Condition : The MACD line crosses below the signal line, confirming a bearish momentum.
- This serves as an additional filter to verify if the market momentum aligns with the long or short entry criteria.
4. Long Entry (Buy Signal) :
- A long entry signal is triggered when the following conditions are met:
- The price is above EMA 20 (indicating an overall bullish market).
- The price is within the green EMA band (EMA 10 and EMA 20), suggesting short-term support.
- The RSI is below 70 (indicating the market is not overbought).
- The MACD line is above the signal line , showing bullish momentum.
- These conditions combined suggest an ideal environment for entering a long position.
5. Short Entry (Sell Signal) :
- A short entry signal is triggered when the following conditions are met:
- The price is below EMA 20 (indicating an overall bearish market).
- The price is within the green EMA band (EMA 20 and EMA 30), suggesting short-term resistance.
- The RSI is above 30 (indicating the market is not oversold).
- The MACD line is below the signal line , showing bearish momentum.
- These conditions combined suggest an ideal environment for entering a short position.
6. Signal Alerts :
- Long Alerts : Users can set alerts to notify them when a long condition is met. These alerts are triggered when all the criteria for a long entry are satisfied.
- Short Alerts : Similarly, users can set alerts for short signals, notifying them when all the conditions for a short entry are satisfied.
7. EMA Bands :
- The EMA bands are visually represented with colored fills between the EMAs, providing a visual aid to recognize potential trading zones. These zones can serve as a reference for traders to make quick decisions regarding entries and exits.
8. Volume Filter :
- The indicator also includes a volume filter , which compares the current volume to its 20-period simple moving average. Higher volumes provide confirmation of price movement, which can indicate stronger potential for the trade.
---
How It Works :
- Long Trades : The indicator suggests a long position when the price is above the EMA 20, within the green EMA band, the RSI is not overbought, and MACD confirms bullish momentum (MACD line above the signal line).
- Short Trades : The indicator suggests a short position when the price is below the EMA 20, within the green EMA band, the RSI is not oversold, and MACD confirms bearish momentum (MACD line below the signal line).
- Volume Confirmation : The indicator uses a volume-based filter to ensure the trade is backed by sufficient market participation.
---
Usage :
- Best for Scalping : This strategy is designed for short-term trades ( scalping ) and can be applied to any time frame, though it works best on intraday charts, such as 5-minute or 15-minute charts.
- Ideal for Trend-Following : With the use of EMAs and MACD, the strategy is best suited for markets that exhibit clear trends. It helps to avoid whipsaw trades and focuses on capturing medium-term trends.
- Risk Management : By using RSI, MACD, and volume analysis together, this strategy reduces the likelihood of entering a trade in an overextended market, which helps with risk management.
---
Alerts and Signals :
- Long Signals : When all conditions are met for a long trade, a green label appears below the price bar, indicating a potential buy opportunity. An alert is also generated, notifying the user.
- Short Signals : When all conditions are met for a short trade, a red label appears above the price bar, indicating a potential sell opportunity. An alert is also generated, notifying the user.
---
This combination of EMA , RSI , MACD , and volume-based filters creates a balanced approach to scalping, ensuring that traders receive clear, actionable entry signals with trend confirmation, while avoiding overbought and oversold conditions that may lead to false signals. The indicator is designed to help traders confidently identify high-probability trades while maintaining simplicity and clarity in its setup.

Adaptive 12/48 EMAThe Adaptive 12/48 EMA is a trend-following indicator that dynamically changes color based on price positioning relative to key exponential moving averages (EMAs).
EMA Calculation:
The script calculates three EMAs—9 EMA (white), 12 EMA (adaptive color), and 48 EMA (adaptive color).
Trend Confirmation:
The 12 EMA turns green when the price (open, close, and low) is fully above it, indicating bullish momentum. The 12 EMA turns red when the price is fully below it, signaling bearish conditions.
Long-Term Trend (48 EMA):
The 48 EMA turns purple when the 12 EMA is above it, confirming an uptrend. The 48 EMA turns pink when the 12 EMA is below it, confirming a downtrend. Both EMAs turn gray when there's no clear trend.
How to Benefit from It:
Trend Trading: Use green/red shifts in the 12 EMA to time entries in the direction of momentum.
Trend Strength Confirmation: The 48 EMA color change helps determine the longer-term trend direction.
Confluence with Other Indicators: Works well with volume indicators or RSI for confirmation before entering trades.
This indicator provides a clear visual representation of trend strength and direction, helping traders make informed decisions based on price structure.

Moneyball EMA-MACD indicator [VinnieTheFish]Summary of the Moneyball EMA-MACD Indicator Script
Author: VinnieTheFish
Purpose:
This indicator helps traders identify trend direction, momentum shifts, and potential trade signals based on EMA and MACD crossovers.
This Pine Script is a custom indicator that combines Exponential Moving Averages (EMAs) and MACD (Moving Average Convergence Divergence) to analyze price trends and momentum. The script uses a custom 9/50 MACD with a 16 smoothing period. The script is written in a way that you can create your own custom MACD settings and create alerts based on those parameters. The chart bars are color coded based on the relative position of the MACD and Signal line primarily for bullish long trade setups.
Bar color coding helps the trader spot potential reversals based on where the price currently resides in relation to the custom 9/50 EMA based MACD and the 16 period smoothing period for the signal line. Indicator also has custom alerts to notify the trader when a potential trade setup exists that correspond with the bar color change.
Question: So why is this called the Moneywell EMA-MACD Indicator?
Answer: In the movie Moneyball the Oakland A's broke down how to win a championship based on data. To make the playoffs you needed so many wins, then broken down by runs and then broken down to base hits. A base hit was good as a walk. With trading often times we look too often for home runs and ignore the importance of getting on base with small wins. This indicator was designed on shorter timeframes to identify those base hits, but can also be adapted to higher timeframes for swing trading.
Key Features:
User Inputs:
Configurable fast and slow lengths for MACD calculation.
Choice between SMA and EMA for oscillator and signal line smoothing.
Customizable signal smoothing length.
EMA Calculation:
Computes 3 EMA, 9 EMA, 20 EMA, and 50 EMA to track short-term and long-term trends.
MACD Calculation:
Computes MACD using either SMA or EMA based on user selection.
Generates the MACD signal line for comparison.
Crossover Conditions:
Detects MACD and Signal line crossovers above and below the zero line.
Identifies price momentum shifts.
Bar Coloring Logic:
Green: MACD is above 0 and above the signal line.
White: MACD is below the signal line.
Orange: MACD is below 0 but above the signal line.
Fuchsia: Bullish EMA 3/9 cross but price is still below the 20/50 EMA.
Alerts for Key Trading Signals:
MACD crossing above/below the zero line.
Signal line crossing above/below the zero line.
MACD reaching new highs/lows.
Alerts for colored bar conditions.

EMA/SMA Ribbon Pro (AUTO HTF + Labels)This indicator is a multi-timeframe (MTF) moving average ribbon that dynamically adjusts to the next highest timeframe. It provides a visual representation of market trends by stacking multiple EMAs and SMAs with customizable color fills and labels.
Features
✅ Multi-Timeframe (MTF) Support: Automatically detects the next highest time frame or allows for manual selection
✅ Customizable Moving Averages: Supports EMA and SMA with different lengths for flexible configuration
✅ Ribbon Visualization: Smooth color transitions between different moving averages for better trend identification
✅ Crossover Labels: Detects bullish and bearish EMA/SMA crossovers and marks them on the chart
✅ Price Labels & Timeframe Display: Displays moving average values to the right of the price axis with customizable label padding and colors
How It Works
Select the HTF mode: Manual or automatic
Choose EMA/SMA lengths to create different ribbons
Enable/disable price labels for each moving average
Customize colors and transparency for ribbons and labels
Crossover labels appear when faster moving averages cross slower ones and vice versa
Use Cases
📌 Trend Identification: Identify bullish and bearish trends using multiple EMAs and SMAs
📌 Support & Resistance Zones: MAs can act as dynamic support and resistance levels
📌 Reversal & Confirmation Signals: Watch for MTF crossovers to confirm trend changes
Customization
🔹 Standard EMA Lengths: 6, 8, 13, 21, 34, 48, 100, 200, 300, 400
🔹 SMA Lengths: 48, 100, 200
🔹 Color Adjustments: Set custom colors for bullish/bearish ribbons
🔹 Crossovers: Enable/disable custom crossover pairs (e.g., 100/200 EMA, 200 EMA/SMA).
This indicator is perfect for traders who rely on multi-timeframe confluence while seeking to enhance their market analysis and decision-making process.
As always, by combining EMA/SMA Ribbon with other tools, traders ensure that they are not relying on a single indicator. This layered approach can reduce the likelihood of false signals and improve overall trading accuracy.
As always, be sure to use any indicator with price action and volume indicators for better trade confirmation!

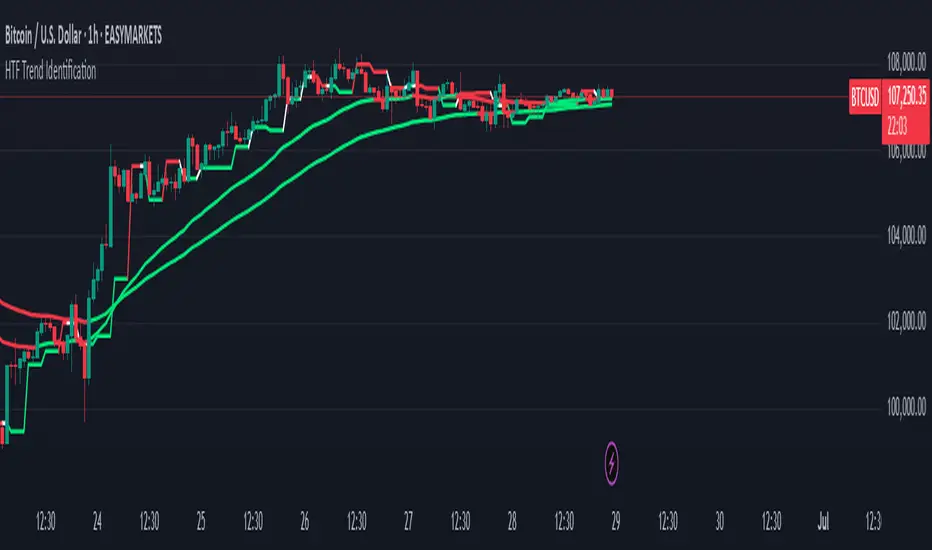
HTF Trend IdentificationThis indicator identifies higher timeframe (HTF) trends and plots them on the chart. It uses a fixed higher timeframe input and a selectable source to calculate the HTF value. The indicator also plots an EMA and colors the candles based on the HTF trend and EMA crossover.
**Features:**
* **HTF Trend Identification:** Calculates and plots a higher timeframe trend based on a user-defined source and fixed timeframe. This allows you to visualize the larger trend context on your current chart.
* **Repainting Option:** Provides a toggle to control whether the HTF calculation repaints. Disabling repainting ensures that past HTF signals remain fixed, but may introduce a slight lag. Enabling repainting provides more up-to-date signals, but can cause past signals to change.
* **Customizable Colors:** Allows users to set custom colors for uptrends and downtrends.
* **EMA Plot:** Includes an Exponential Moving Average (EMA) plot with a customizable length and offset. The EMA color changes based on the HTF trend.
* **Candle Coloring:** Colors the candles based on the HTF trend, providing a clear visual representation of the overall trend direction.
* **Alerts:** (This would require adding alert conditions to the code, which I can do if you'd like) Could be extended to include alerts for HTF trend changes or EMA crossovers.
**Inputs:**
* **Repainting:** On/Off toggle to control repainting of the HTF calculation.
* **Source:** Select the source for HTF calculations (e.g., close, open, high, low, etc.).
* **Fixed Higher Timeframe:** Set the higher timeframe for trend calculation (e.g., 1D, 4H, 1W). *Note: Timeframes smaller than the current chart's timeframe are not allowed.*
* **Up Color:** Color for uptrends.
* **Down Color:** Color for downtrends.
* **EMA Length 1:** Length of the EMA.
* **Offset:** Offset for the EMA plot.
**How to Use:**
1. Add the indicator to your chart.
2. Configure the inputs to your desired settings.
3. Observe the plotted HTF trend line, EMA, and candle colors to identify potential trading opportunities.
**Limitations:**
* **Repainting:** Enabling repainting can cause past HTF signals to change. Use with caution.
* **No Alerts (by default):** This version does not include alerts. However, this can be added if requested.
**Author:** atulgalande75
**Disclaimer:** This script is for educational purposes only and should not be considered financial advice. Use at your own risk.
Custom Length Moving AverageThe Custom Length Moving Average is a dynamic indicator that allows traders to plot a moving average with an adjustable length based on their preferred number of days. Users can choose between Simple Moving Average (SMA), Exponential Moving Average (EMA), or Weighted Moving Average (WMA) to match their trading strategy. The script automatically calculates the moving average length by factoring in the chart’s timeframe and trading session duration, ensuring precision and adaptability. This makes it an ideal tool for traders looking for a flexible moving average that adjusts to different market conditions and timeframes.

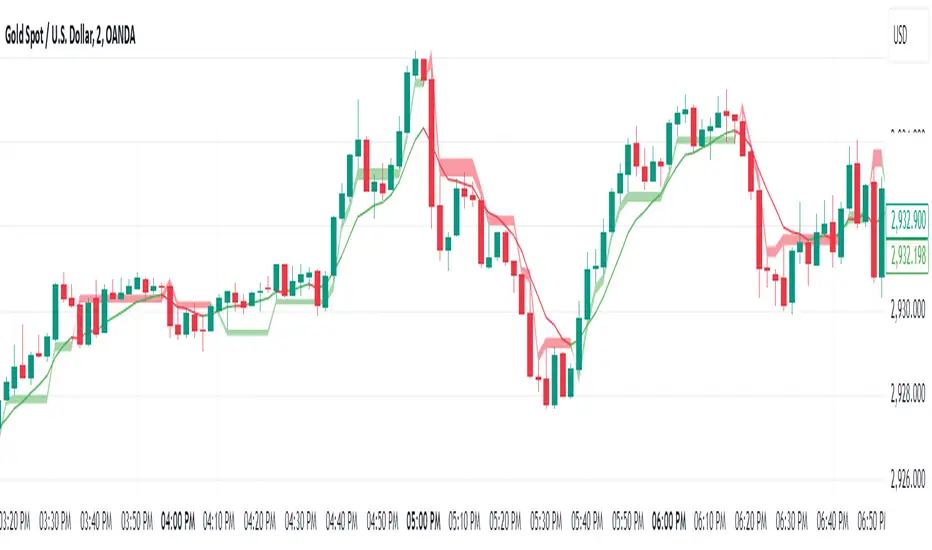
Heikin-Ashi Trend ScalpHeikin-Ashi Trend Scalp is an indicator for TradingView, designed to identify short-term trends and entry points based on Heikin-Ashi candles and EMA crossovers.
Key Features:
Attention Signals: Early warning of potential entry points.
Buy/Sell Signals: Filtered signals based on the prevailing trend.
Filters (Slow Mode, Shadow Filter): Help reduce the number of false signals.
Shadow Filter: Eliminates false signals caused by shadows against the trend.
The warning bar should not have any shadow against the trend.
If the bar with the buy/sell signal has a shadow that crosses the opening level of the warning bar, the signal disappears.
Since the signal may disappear as the candle forms, entries should only be made after the signal has been confirmed.
It is not recommended to disable the Shadow Filter, as doing so may lead to an increase in false signals.
Slow Mode: Reduces false signals by using longer-term EMA crossovers. For timeframes of 1–5 minutes, it is recommended to use Slow Mode to reduce false signals.
EMA Lines (7, 21, 50): Displayed for trend determination. Depending on the selected mode: in standard mode, EMA 21 (fast) is shown, in Slow Mode, the longer-term EMA 50 (slow) is displayed.
Stop-Loss Price: Automatically set at the opening level of the candle two bars ago and displayed on the chart.
RSI: Displays the current value of the RSI indicator and visualizes it with color:
Red — for overbought conditions (above 70).
Green — for oversold conditions (below 30).
Yellow — for values in the neutral zone (between 30 and 70).
Alerts: Notifications for new signals in real-time.
The indicator is ideal for scalping and short-term trading, especially when used in conjunction with other technical analysis tools.

EMA Crossover Backtest [BarScripts]This indicator lets you backtest an EMA crossover strategy with built-in risk management and trade tracking. It simulates long and short trades based on EMA crossovers, allowing you to fine-tune entry conditions, stop-loss placement, and reward/risk settings.
🔹 How It Works:
Long Entry: Fast EMA crosses above Slow EMA, and price closes above Fast EMA.
Short Entry: Fast EMA crosses below Slow EMA, and price closes below Fast EMA.
Stop Loss: Set based on previous bars or a fixed amount.
Take Profit: Adjustable reward/risk ratio.
Higher Timeframe Confluence: Confirms trades based on a larger timeframe.
Trade Hours Filter: Limits trades to specific time windows.
🔹 Key Features:
✅ Shows Entry & Exit Points with visual trade lines.
✅ Customizable EMA Lengths to fit any strategy.
✅ P&L Tracking & Statistics to measure performance.
✅ Position Sizing Options: Fixed position, fixed risk, or percentage of balance.
✅ Commissions Tracking (based on total trades, not contracts).
Use this tool to fine-tune your EMA crossover strategy and see how it performs over time! 🚀
💬 Let me know your feedback—suggest improvements, report issues, or request new features!

BullDozz MA-CandlesticksBullDozz MA-Candlesticks 🏗️📊
The BullDozz MA-Candlesticks indicator transforms traditional candlesticks by replacing their Open, High, Low, and Close values with various types of Moving Averages (MAs). This helps traders visualize market trends with smoother price action, reducing noise and enhancing decision-making.
🔹 Features:
✅ Choose from multiple MA types: SMA, EMA, WMA, DEMA, TEMA, LSMA
✅ Customizable MA period for flexibility
✅ Candlestick colors based on trend: Green for bullish, Red for bearish
✅ Works on any market and timeframe
This indicator is perfect for traders who want a clearer perspective on price movement using moving average-based candlesticks. 🚀 Try it now and refine your market analysis! 📈🔥

MTF Sqz by The CrazyChrisCC – MTF Sqz/EMA
I create this script to easily be able to see the EMA and the Squeeze on multiple time frame at the same time and to easily create alert without going to each time frame to activate them.
Here how it work :
TF/EMA :
This section show all 13 different time frame with a variable background color. The background color refer to the EMA 8 , 21 and 50. If all EMA are stack up ( ema 8 above ema 21 and ema 21 above ema 50) the background will be Green. If the EMA are stack down ( ema 8 below ema 21 and ema 21 below ema 50) the background will be Red. If the EMA are mix (no direction) the background will be Yellow.
Sqz :
1. This section show the squeeze for each time frame
- Green background = no squeeze
- Gray background = low squeeze
- Red background = medium squeeze
- Orange background = high squeeze
2. This section also show A+Up or A+Down :
- A+Up = EMA stack UP + medium or high squeeze + momentum increase
- A+Down = EMA stack Down + medium or high squeeze + momentum decrease
Buy Zone :
- Bz (green background) = Price between EMA 8 and EMA 21 + EMA stack Up + Medium or High squeeze
- Sz (red background) = Pirce between EMA 21 and EMA 8 + EMA stack Down + Medium or High squeeze
Best part of this indicator are the Alert !!! : They will advert when the price action is in the good spot for long or short depending of what kind of alert you set. (These alert are for information only, you choose by yourself if you want to go long or short or do nothing!)
I personally only used this indicator on the Bullish side ( I’m more of a bullish trader than a bearish trader) but I put different type of alert for all kind of trader.
First you need to go on the setting of this indicator to set the king of alert you want. By default it will activate alert for the Bullish ‘A+ Up + Bz’ condition ( I remove the 1 min , 3 min, daily, weekly and monthly alert to not receive too much alert)
Also before I set the alert I habitually choose a chart time frame of 30 min or around. The reason is if I choose a time frame to short I will received too much alert and if I choose a time frame too long I will not received enough alert but everyone each preference, you have the choose the best time frame that fit your kind of trading
To activate alert, go to the 3 dots (… , more) on the indicator title than chose the first option ( add alert on cc – MTF sqz) than click ‘Create’. From now every time frame that was already select in the setting of this indicator will be monitor and give you an alert when the conditions are met.
I also add some information the TICK indicator, the daily ATR and the Market cap for information purpose only.
Good trading to all
Feel free to comment or add request to this indicator, I try my best to respond to everyone
