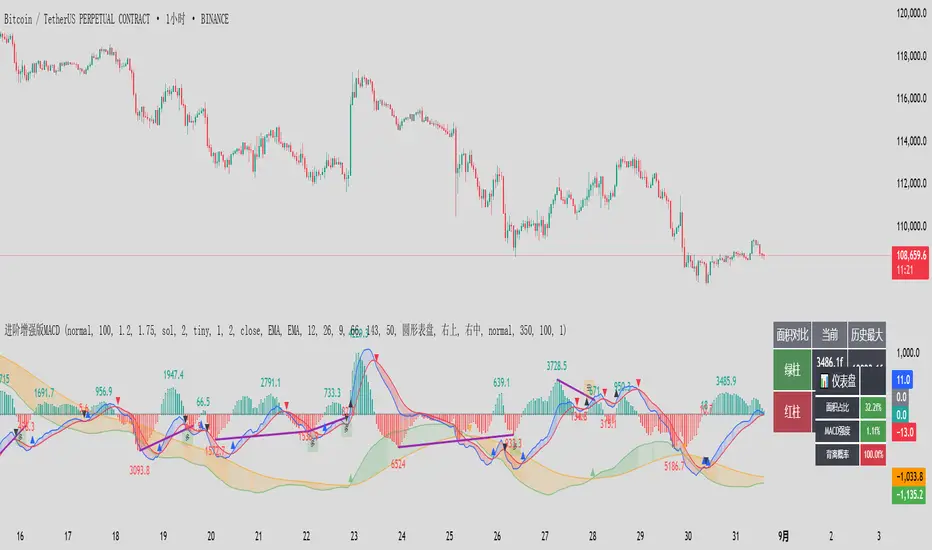
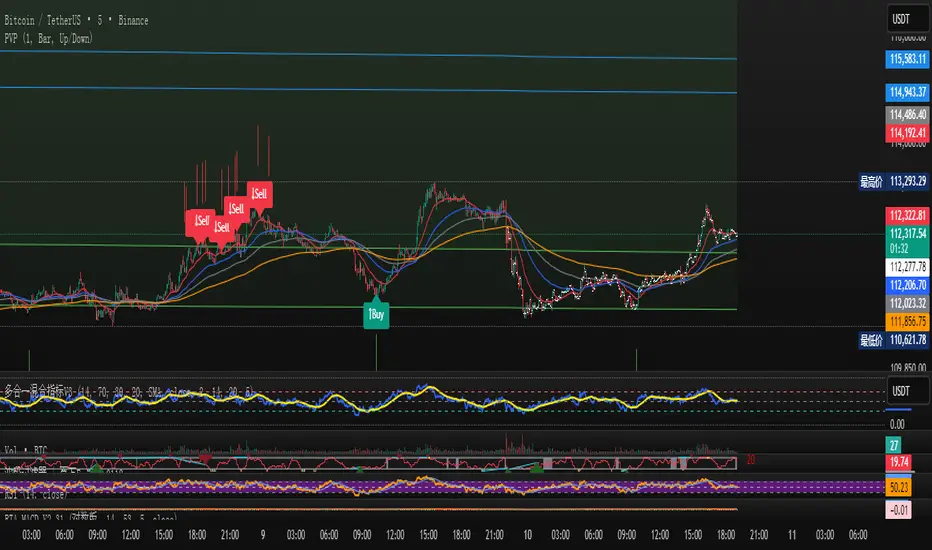
进阶增强版MACD 这是一个增强版 MACD(移动平均线收敛-发散)指标,集成了多时间框架分析、面积统计、背离检测、仪表盘显示和警报功能。
该指标在传统 MACD 指标的基础上进行了大幅扩展,增加了多时间框架(本级别和高级别)、面积分析、背离概率计算、交互式仪表盘和表格显示等功能,旨在为交易者提供更全面的市场动态信息。核心功能包括:双级别 MACD:同时计算本级别(默认快线12、慢线26、信号线9)和高级别(默认快线66、慢线143、信号线50)的 MACD 和信号线。
面积分析:统计 MACD 直方图的面积(红绿柱),并与历史最大面积对比。
背离检测:识别价格与 MACD 的顶背离和底背离,并计算背离概率。
可视化:提供丰富的图形输出,包括直方图、MACD 线、信号线、金叉/死叉标记、背离线、面积标签、表格和仪表盘。
警报系统:为金叉/死叉、面积变化、背离信号等设置多种警报条件。
指标适用于趋势跟踪、背离交易和强度分析,适合日内交易、波段交易等场景。
This is an enhanced MACD (Moving Average Convergence Divergence) indicator that integrates multi time frame analysis, area statistics, divergence detection, dashboard display, and alert functions.
This indicator has been greatly expanded on the basis of the traditional MACD indicator, adding functions such as multi time frame (local and high-level), area analysis, deviation probability calculation, interactive dashboard and table display, aiming to provide traders with more comprehensive market dynamic information. The core functions include: dual level MACD: simultaneously calculating the MACD and signal lines of this level (default fast line 12, slow line 26, signal line 9) and high-level (default fast line 66, slow line 143, signal line 50).
Area analysis: Calculate the area of the MACD histogram (red and green bars) and compare it with the historical maximum area.
Deviation detection: Identify the top and bottom deviations between prices and MACD, and calculate the probability of deviation.
Visualization: Provides rich graphical output, including histograms, MACD lines, signal lines, golden/dead cross markers, backlit lines, area labels, tables, and dashboards.
Alarm system: Set multiple alarm conditions for golden/dead forks, area changes, deviation signals, etc.
The indicator is suitable for trend tracking, divergence trading, and intensity analysis, and is suitable for intraday trading, band trading, and other scenarios.
Forecasting
ORB with Golden Zone FIB targets, Any Timeframe by TenAMTraderDescription:
This indicator is designed to help traders identify key price levels using Fibonacci extensions and retracements based on the Opening Range Breakout (ORB). The levels are visualized as “Golden Zones”, which can serve as potential targets for trades.
Features:
Customizable ORB Timeframe: By default, the ORB is set from 9:30 AM to 9:45 AM EST, but any timeframe can be configured in the settings to fit your trading style.
Golden Zones as Targets: Fibonacci levels are intended to be used as potential profit-taking zones or areas to monitor for reversals, providing a structured framework for intraday and swing trading.
Adjustable Chart Settings: Color-coded levels make it easy to interpret at a glance, and all lines can be customized for personal preference.
Versatile Application: The indicator works across any timeframe, enabling traders to analyze both intraday and multi-day price action.
How to Use:
Ensure Regular Trading Hours (RTH) is enabled on your chart for accurate level calculation.
Observe price action near Golden Zones: a confirmed breakout may indicate continuation, while a pullback could signal a reversal opportunity.
Use the Golden Zones as reference targets for managing risk and planning exits.
Adjust the ORB timeframe and display settings to match your preferred trading style.
Legal Disclosure:
This indicator is provided for educational purposes only and is not financial advice. Trading carries a substantial risk of loss. Users should always perform their own analysis and consult a licensed financial professional before making any trading decisions. Past performance is not indicative of future results.

Session Time Milestones Highlight & AlertSession Time Milestones Highlight & Alert
This script allows you to track and highlight specific trading session milestones on your chart with customizable times, all set in GMT+7. It provides visual cues and alerts for key market events like Tokyo Open, Shanghai Open, Asia Lunch Time, London Open, London Lunch Time, and New York Open.
Features:
Customizable Time Milestones: Adjust the times for each session directly from the settings.
Candle Highlights: The script highlights the candles at your chosen session times for quick visual identification.
Alerts: Set alerts to be notified when each session starts.
Labels: Optionally display simple labels on the chart above the candles for each milestone, with easy toggles to turn them on or off.
Note: All times are in GMT+7.

Future Value ProjectionFuture Value Projection with Actual CAGR
This indicator calculates the future value (FV) of the current ticker’s price using its historical Compound Annual Growth Rate (CAGR). It measures how much the price has grown over a chosen lookback period, derives the average annual growth rate, and then projects the current price forward into the future.
Formulae:
CAGR:
CAGR = ( PV_now / PV_past )^(1 / t) - 1
Future Value:
FV = PV_now × ( 1 + CAGR / n )^( n × T )
Where:
PV_now = Current price
PV_past = Price t years ago
t = Lookback period (years)
CAGR = Compound Annual Growth Rate
n = Compounding periods per year (1=annual, 12=monthly, 252=daily, etc.)
T = Projection horizon (years forward)
How it works:
Select a lookback period (e.g., 3 years).
The script finds the price from that time and computes the CAGR.
It then projects the current price forward by T years using the CAGR.
The chart shows:
Current price (blue)
Projected FV target (green)
A table with CAGR and projection details
Use case:
Helps investors and traders visualize long-term growth projections if the ticker continues growing at its historical pace.

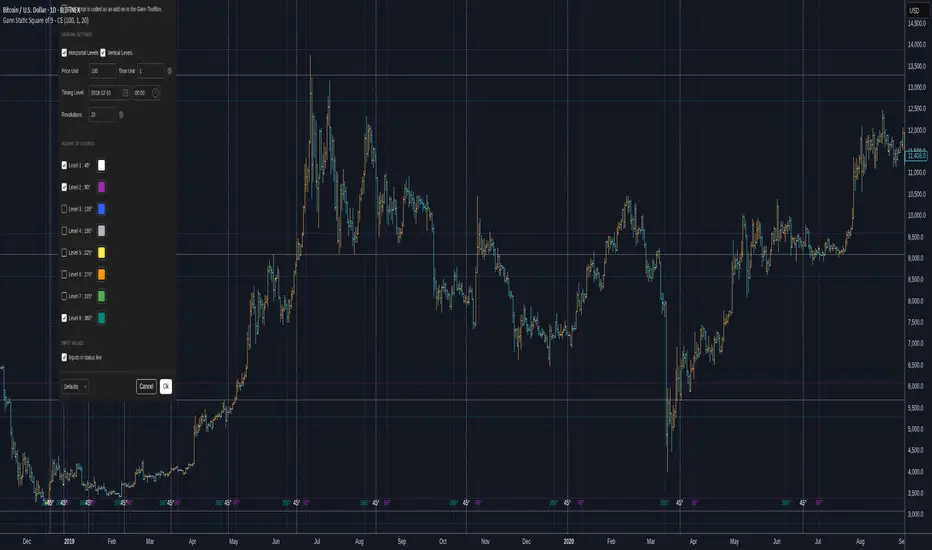
Gann Static Square of 9 - CEGann Static Square of 9 - Community Edition
Welcome to the Gann Static Square of 9 - Community Edition, a meticulously crafted tool designed to empower traders with the timeless principles of W.D. Gann’s Square of 9 methodology. This indicator is tailored for the TradingView community and Gann Traders, providing a robust solution for analyzing price and time dynamics across various markets.
Overview
The Gann Static Square of 9 harnesses the mathematical precision of Gann’s Square of 9 chart, plotting key price and time levels based on a fixed starting point of 1. Unlike its dynamic counterpart , this static version uses a consistent origin, making it ideal for traders seeking to map Gann’s geometric angles (45°, 90°, 135°, 180°, 225°, 270°, 315°, and 360°) with a standardized framework. By adjusting the price and time units, users can tailor the indicator to suit any asset, from equities and forex to commodities and cryptocurrencies.
Key Features
Fixed Starting Point: Begins calculations at a base value of 1, providing a standardized approach to plotting Gann’s Square of 9 levels.
Comprehensive Angle Projections: Plots eight critical Gann angles (45°, 90°, 135°, 180°, 225°, 270°, 315°, and 360°), enabling precise identification of support, resistance, and time-based targets.
Customizable Price and Time Units: Adjust the price unit (Y-axis) and time unit (X-axis) to align with the specific characteristics of your chosen market, ensuring optimal fit for price action and volatility.
Horizontal and Vertical Levels: Enable horizontal price levels to identify key support and resistance zones, and vertical time levels to pinpoint potential market turning points.
Revolution Control: Extend projections across multiple 360° cycles to uncover long-term price and time objectives, with user-defined revolution counts.
Customizable Aesthetics: Assign distinct colors to each angle for enhanced chart clarity and visual differentiation.
and more!
How It Works
Configure Settings: Set the price and time units to match your asset’s characteristics, and select the desired number of revolutions to project future levels.
Enable Levels: Choose which Gann angles (45° to 360°) to display, tailoring the indicator to your analysis needs.
Visualize Key Levels: The indicator plots horizontal price levels and optional vertical time levels, each labeled with its corresponding angle and price/time value.
Analyze and Trade: Leverage the plotted levels to identify critical support, resistance, and time-based turning points, enhancing your trading strategy with Gann’s proven methodology.
Get Started
As a token of appreciation for the TradingView community, and Gann traders, this Community Edition is provided free of charge. Trade safe and enjoy!
Gann Dynamic Square of 9 - CEWelcome to the Gann Dynamic Square of 9 - Community Edition
a powerful and versatile tool designed for traders utilizing W.D. Gann's renowned Square of 9 methodology. Crafted with gratitude for the TradingView community and Gann trading enthusiasts worldwide.
Overview
The Gann Dynamic Square of 9 leverages the mathematical precision of Gann’s Square of 9 chart, plotting key price and time levels based on a user-defined high or low pivot point. Unlike static Square of 9 models, this dynamic version adapts to your chosen anchor point, starting calculations from your selected price level rather than a fixed value. The indicator projects critical angles (45°, 90°, 135°, 180°, 225°, 270°, 315°, and 360°) with a customizable price unit, enabling precise alignment with market dynamics.
Key Features
Customizable Pivot Points : Anchor the Square of 9 to a user-defined high or low price level, allowing for tailored projections of support, resistance, and time-based targets.
Dynamic Angle Projections : Automatically calculates and plots the eight key Gann angles (45°, 90°, 135°, 180°, 225°, 270°, 315°, and 360°) based on your input, with support for multiple revolutions to identify future price and time targets.
Flexible Price Unit : Adjust the price unit to suit any asset, ensuring compatibility across various markets and price scales. Experimentation is encouraged to find the optimal setting for your trading instrument.
Horizontal and Vertical Levels : Enable horizontal price levels and vertical time levels to visualize critical support/resistance zones and time-based turning points.
User-Friendly Interface : Intuitive input options make it easy to configure price units, pivot placement, revolution counts, and more, streamlining your analysis process.
and more!
How It Works
Select Your Pivot: Choose a significant high or low price level to anchor the Square of 9, setting the foundation for all calculations.
Adjust Settings: Customize the price unit, enable/disable specific angles, and select the number of revolutions to match your trading strategy.
Visualize Key Levels: The indicator plots horizontal price levels and optional vertical time levels, each labeled with its corresponding Gann angle and price/time value.
Analyze and Trade: Use the plotted levels to identify potential support, resistance, and time-based turning points, enhancing your market analysis with Gann’s time-tested principles.
Get Started, enjoy, trade wisely, and unlock the power of Gann’s timeless methodology!

Third Eye ORB Pro (0915-0930 IST, no-plot)Third Eye ORB Pro (Opening Range Breakout + Range Mode)
This indicator is designed specifically for Indian stocks and indices (NIFTY, BANKNIFTY, FINNIFTY, MIDCAP, etc.) to track the Opening Range (09:15–09:30 IST) and generate actionable intraday trade signals. It combines two key modes — Range Mode (mean reversion inside the opening range) and Breakout Mode (momentum trading beyond the range).
1. Opening Range Framework (09:15–09:30 IST)
The indicator automatically plots the Opening Range High (ORH) and Opening Range Low (ORL) after the first 15 minutes of market open.
The area between ORH and ORL acts as the intraday battlefield where most price action occurs (historically ~70–80% of the day is spent inside this zone).
A shaded box and horizontal lines mark this range, serving as a visual reference for support and resistance throughout the day.
2. Range Mode (Mean Reversion Inside OR)
When price trades inside the Opening Range, the indicator looks for edge rejections to capture range-bound trades.
Range BUY (RB): Triggered near ORL when a bullish rejection candle forms (strong body + long lower wick).
Range SELL (RS): Triggered near ORH when a bearish rejection candle forms (strong body + long upper wick).
Optional filters (toggleable in settings):
RSI Filter: Only allow range buys if RSI is oversold (≤45) and range sells if RSI is overbought (≥55).
VWAP Filter: Only allow range trades if price is not too far from VWAP (distance ≤ X% of OR size).
Labels show suggested Stop Loss (just outside the OR band) and Target (midline/VWAP).
Cooldown logic prevents consecutive whipsaw signals.
3. Breakout Mode (Directional Moves Beyond OR)
When price closes strongly outside the ORH/ORL with momentum, the indicator confirms a breakout/breakdown trade.
Buffers are applied to avoid false breakouts:
ATR Buffer: Price must extend at least ATR × multiplier beyond the range edge.
% Buffer: Price must extend at least a percentage of OR size (default 10%).
Confirmation Filters:
Candle must have a strong body (≥60% of total bar range).
Optional “two closes” rule: price must close outside the range for 2 consecutive candles.
BUY BO: Trigger when price closes above ORH + buffer with momentum.
SELL BD: Trigger when price closes below ORL – buffer with momentum.
Labels and alerts are plotted for quick action.
4. Practical Usage
Works best on 5-minute charts for intraday trading.
Designed to help traders capture both:
Range-bound moves during the day (mean reversion plays).
Strong directional breakouts when institutions push price beyond the opening range.
Particularly effective on expiry days, trending sessions, and major news days when breakouts are more likely.
On sideways days, Range Mode provides reliable scalp opportunities at the OR edges.
5. Features
Auto-plots Opening Range High, Low, Midline.
Box + line visuals (no repainting).
Buy/Sell labels for both Range Mode and Breakout Mode.
Customizable buffers (ATR, % of range) to suit volatility.
Alerts for all signals (breakouts and range plays).
Built with risk management in mind (suggested SL and TP shown on chart).

Auto S/R 1H - Stable Simplethat is a script to find out the support and resistance as trendlines for stocks in one hour timeframe for swing trading.

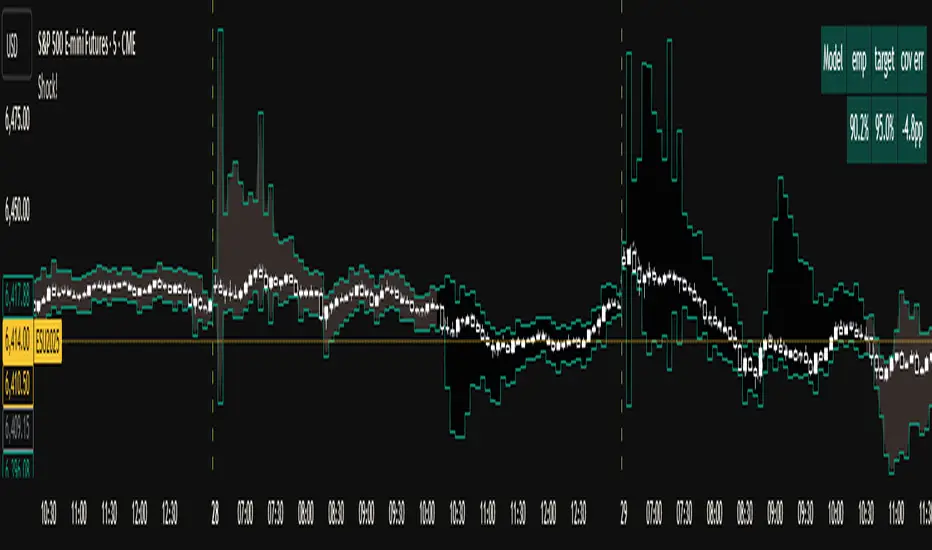
Shock!The Shock Indicator is a volatility-banding model that forecasts price ranges with a dynamically widening/shrinking system. Fundamentally, it uses an exponentially weighted moving average of returns, adjusting for time-of-day patterns, to estimate a baseline volatility (i.e. The ‘prior’ in Bayesian theory). It detects jumps by comparing realized variance with “bipower variation”, temporarily widening the bands when shocks occur, and decaying the width of the bands as the shock subsides. In order to keep the coverage as calibrated and honest as possible, it continuously checks how often each bar’s closing prices stay inside the predicted bands, and adapts tail multipliers using a “scoring” system, avoiding the “cheat” of inflating bands everywhere to include as many candles as possible. It also uses a simple decaying mechanism to shrink bands exponentially faster when realized ranges are calm, preventing long periods of unjustified overshooting. In practice, this design keeps the empirical coverage probability close to a user-selected target. By default, the target is set to 95%. Across various 5 minute, 10 minute, 15 minute, and 30 minute timeframes on assets such as USDJPY, ES and NQ Futures, QQQ, NVDA, TSLA, BTCUSD, the empirical coverage consistently stays within -10%/+4% of the default 95% target coverage, while staying extremely responsive to shocks.
At the open of each candle, the range is drawn. The range is “frozen” the moment it is drawn, meaning it cannot utilize “cheating” methods such as repainting or future-looking to artificially inflate the accuracy and calibration. The indicator then tracks how accurate and well-calibrated it was for that given candle, optimizing the bands for future bars.

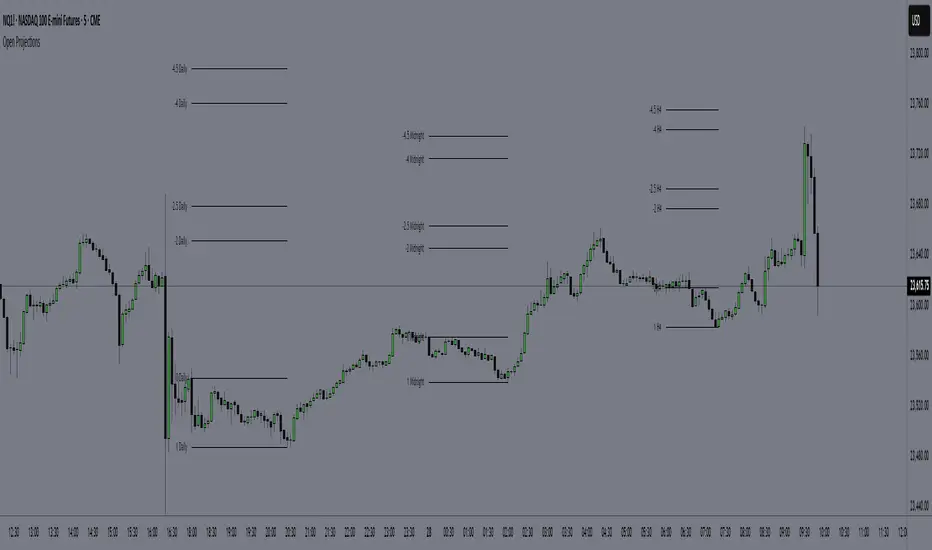
Time-Based Manipulation ProjectionsThis indicator automatically plots custom projection levels based on session and timeframe opening prices, utilizing the AMD/PO3 concept (Accumulation, Manipulation, Distribution / Power of Three). The theory suggests that price typically opens, creates an initial manipulation move to hunt liquidity, then reverses for distribution.
By measuring the distance from the open to the initial high/low manipulation, the indicator projects potential targets and reversal zones at customizable ratios, with the 2-2.5x and 4-4.5x extensions often serving as key areas.
Features:
Session-Based Projections: 4 custom session-based projections with full control over the opening time and the time when the projections stop updating with new manipulation highs/lows (Midnight, Daily, NY Open, etc)
Timeframe-Based Projections: 4 custom timeframe-based projections (H1, H4, Daily, Weekly, etc.)
Dynamic Anchoring: In line with AMD/PO3 logic, the indicator automatically locks to the correct manipulation leg (high or low) based on price position relative to the open
Custom Projections: Define your own projection levels
Custom Labels: Assign your own names to each projection, making it easy to identify and organize levels on the chart
Historical Levels: Option to display past projections
Styling Options: Choose line style, thickness, colors, label size, font, and positioning
Extend Lines: Option to extend projections forward to current price
Delayed Plotting: Set a delay (in minutes) after open before projections appear, useful to avoid false early swings
Note: These projections are most effective when the manipulation leg is clean and well-defined. If the manipulation is shallow, standard projections like 2–2.5x or 4–4.5x may not provide useful levels. In such cases, try experimenting with larger custom projections.
Position Size Calculator MKThis indicator uses for automating your trading very good for taking position with tension free
also have touch entry of price or closing basis entry and stop loss and also show live position

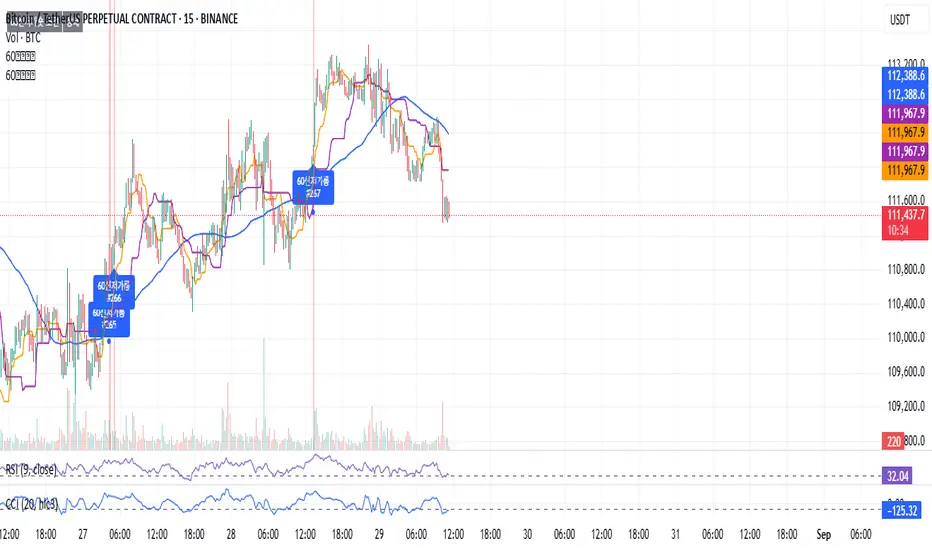
60 신저가 숏“60-Day New Low Short” is a momentum breakdown setup that sells short when price prints a fresh 60-day low, betting that failed support will extend the downtrend.
Entries are usually taken on the breakdown close (or next open) with confirmation like rising volume, relative weakness, and price below the 50/200-day MAs.
Manage risk with a stop above the recent swing high or 20-day high; take profits via ATR-based targets or a trailing stop, and avoid trades near major catalysts (earnings/news).
Futures Rotation Strategy - Overlay (Tables & Signals)This strategy focuses on the laggards and leaders of the market indices and does some weird stuff and determines which to long or short.

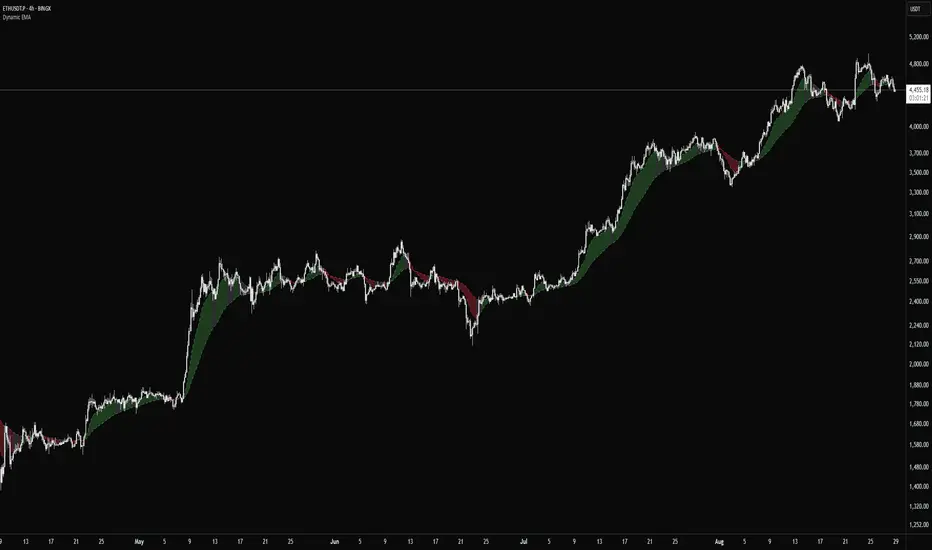
Dynamic EMADynamic EMA — Flexible Trend Indicator
Dynamic EMA is a clean and universal indicator that uses two Exponential Moving Averages to highlight market direction. By default, it applies the popular EMA 14/50 setup, but both EMA lengths can be freely customized.
Why EMA 14 and EMA 50?
The 14-period EMA is commonly used to capture short-term price momentum, making it sensitive to quick market moves.
The 50-period EMA reflects the medium-term trend and is widely recognized by traders and institutions.
Together, EMA 14/50 provide a balanced view: fast enough to react to price changes, yet smooth enough to filter out noise.
Key Features
Two EMAs (fast and slow) with fully adjustable lengths
Automatic dynamic coloring for bullish, bearish, and neutral conditions
Optional fill between EMAs for improved visualization
Adjustable opacity to control chart clarity
Why use it?
Dynamic EMA offers a reliable way to read market trends, spot momentum shifts, and confirm entries or exits. It works across all asset classes and timeframes, while allowing traders to adjust EMA settings to their own strategy.
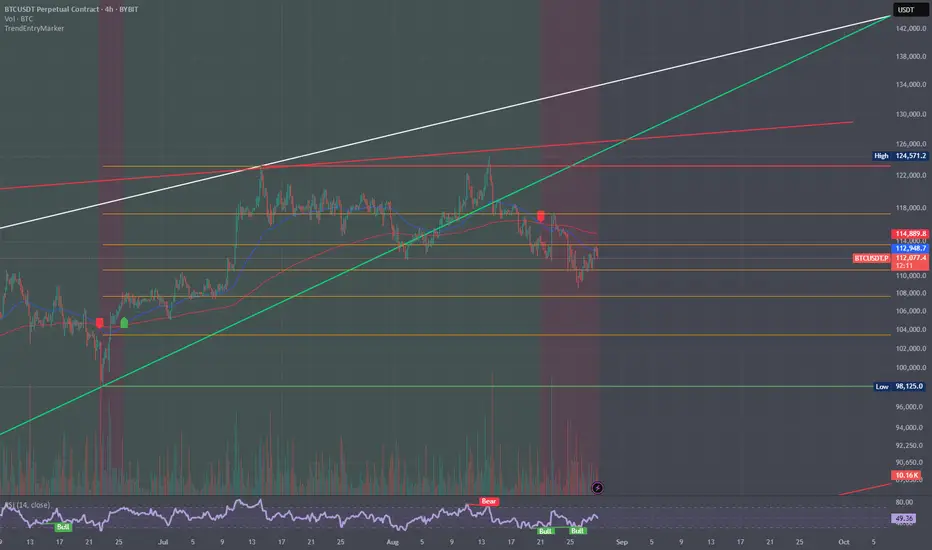
Trend and Entry Marker with MA, Supports, Fib, and Trend LinesJust a little indicator I made when I was bored ...
Helps you find entries for trades!
Secret bubbleSecret bubble
Why Might It Be Called "Bubbles"?
Although not officially named so, some traders or platforms might refer to Bollinger Bands as "bubbles" because:
The bands visually surround the price like a bubble.
During low volatility, the bands form a tight "bubble" around price.
Breakouts look like the price "popping out" of a bubble.
Hence, the nickname "пузырьки" (bubbles) could be a colloquial or visual metaphor for Bollinger Bands in Russian-speaking trading communities.
Conclusion
While there is no official technical indicator called "Bubbles", the term likely refers to Bollinger Bands due to their visual appearance and function. This powerful tool helps traders assess volatility, spot potential reversals, and time entries and exits. When combined with other analysis methods, Bollinger Bands remain a cornerstone of modern technical trading.
🔧 Tip: You can find Bollinger Bands on almost every trading platform (TradingView, MetaTrader, ThinkorSwim) by searching "Bollinger Bands" in the indicators list.

Cryptocurrency Short-Term Trading SignalsThis script integrates years of trading experience and is based on the 5-minute K-line. It comprehensively analyzes multiple classic trading signals (such as trend and reversal signals) and generates short-term trading entry and exit points through multi-condition judgment.
The script will generate simple and intuitive buy/sell prompt labels on the main chart, which can be used as a reference. Please note that all prompt indicators are for reference only, and you should make trading decisions after careful consideration.
Statistical FootprintStatistical Footprint - Behavioral Support & Resistance
This indicator identifies key price levels based on actual market behavior rather than traditional pivot calculations. It analyzes how bulls and bears have historically moved price from session opens, creating statistical zones where future reactions are most likely.
The concept is simple: track how far bullish candles typically push above the open versus how far bearish candles drop below it. These patterns reveal the market's behavioral "footprint" - showing where momentum typically stalls and reverses.
Key Features:
- Separate analysis for daily and weekly timeframes
- Smart zone merging when levels cluster together (within 5 points)
- Uses both mean and median calculations for more robust levels
- XGBoost-optimized lookback periods for maximum statistical significance
- Clean zone-only display focused on actionable price areas
How it Works:
The code separates bullish and bearish sessions, measuring their typical range extensions from the open. It then projects these statistical ranges forward from current session opens, creating "behavioral zones" where the market has historically shown consistent reactions.
When daily and weekly levels align closely, they merge into combined zones with enhanced significance. Labels show both the mean and median values when they differ meaningfully.
Best Used For:
- Identifying high-probability reversal zones
- Setting profit targets based on historical behavior
- Understanding market sentiment shifts at key levels
- Confluence analysis between different timeframes
The lookback periods have been optimized using machine learning to find the most predictive historical sample sizes for current market conditions.
Prev RTH FibsThis study captures the previous day’s Regular Trading Hours (RTH) range (default 09:30–16:00 America/New_York), then projects it onto the current session. It draws HIGH, LOW, and an optional 50% midpoint, plus a configurable set of inside fib-style percentages measured from the HIGH downward. Every level extends a short distance to the right of the current price and shows a clean numeric label (no box) on the right edge.
Key features
Prev-day RTH range tracked automatically; plotted each new session.
Inside levels (from HIGH ↓): 11%, 25%, 29.5%, 38.2%, 45%, 55%, 62% (OTE), 70.5%, 75%, 78.6%, 85% (toggle any on/off).
Clean right-side labels: numbers only, resizable (Tiny → Huge) with transparent background.
Line styling: HIGH/LOW and 50% are solid; inside levels can be Solid/Dashed/Dotted with independent color/width.
Smart right padding: lines/labels extend a few bars past the latest candle, so annotations stay beside price without violating TradingView’s “>500 bars in future” rule.
Works on any symbol/timeframe; RTH window and timezone are adjustable.
Inputs you control
Session: RTH session string and timezone.
Right-side padding (bars) and number size.
Visibility & style for HIGH, LOW, and 50%.
Which inside levels to show, plus their style/color/width.

Signal Hunter Pro - GKDXLSignal Hunter Pro - GKDXL combines four powerful technical indicators with trend strength filtering and volume confirmation to generate reliable BUY/SELL signals. This indicator is perfect for traders who want a systematic approach to market analysis without the noise of conflicting signals.
🔧 Core Features
📈 Multi-Indicator Signal System
Moving Averages: EMA 20, EMA 50, and SMA 200 for trend analysis
Bollinger Bands: Dynamic support/resistance with price momentum detection
RSI: Enhanced RSI logic with smoothing and multi-zone analysis
MACD: Traditional MACD with signal line crossovers and zero-line analysis
🎛️ Advanced Filtering System
ADX Trend Strength Filter: Only signals when trend strength exceeds threshold
Volume Confirmation: Ensures signals occur with adequate volume participation
Multi-Timeframe Logic: Works on any timeframe from 1m to 1D and beyond
🚨 Intelligent Signal Generation
Requires 3 out of 4 indicators to align for signal confirmation
Separate bullish and bearish signal conditions
Real-time signal strength scoring (1/4 to 4/4)
Built-in alert system for automated notifications
⚙️ Customizable Parameters
📊 Technical Settings
Moving Averages: Adjustable EMA and SMA periods
Bollinger Bands: Configurable length and multiplier
RSI: Customizable length, smoothing, and overbought/oversold levels
MACD: Flexible fast, slow, and signal line settings
🎯 Risk Management
Risk Percentage: Set your risk per trade (0.1% to 10%)
Reward Ratio: Configure risk-to-reward ratios (1:1 to 1:5)
ADX Threshold: Control minimum trend strength requirements
🖥️ Display Options
Indicator Visibility: Toggle individual indicators on/off
Information Table: Optional detailed status table (off by default)
Volume Analysis: Real-time volume vs. average comparison
🎨 Visual Elements
📈 Chart Indicators
EMA Lines: Blue (20) and Orange (50) exponential moving averages
SMA 200: Gray long-term trend line
Bollinger Bands: Upper/lower bands with semi-transparent fill
Clean Interface: Minimal visual clutter for clear analysis
📋 Information Table (Optional)
Real-time indicator status with ✓/✗/— symbols
Current signal strength and direction
ADX trend strength measurement
Volume confirmation status
No-signal reasons when conditions aren't met
🔔 Alert System
📢 Three Alert Types
BUY Signal: Triggered when 3+ indicators align bullishly
SELL Signal: Triggered when 3+ indicators align bearishly
General Alert: Any signal detection for broader monitoring
📱 Alert Messages
Clear, actionable alert text
Includes indicator name for easy identification
Compatible with webhook integrations
🎯 How It Works
📊 Signal Logic
Indicator Assessment: Each of the 4 indicators is evaluated as Bullish/Bearish/Neutral
Consensus Building: Counts aligned indicators (minimum 3 required)
Filter Application: Applies trend strength and volume filters
Signal Generation: Generates BUY/SELL when all conditions are met
🔍 Indicator States
Moving Averages: Price position, EMA alignment, and crossovers
Bollinger Bands: Price relative to bands and momentum shifts
RSI: Multi-zone analysis with momentum and crossover detection
MACD: Signal line crossovers and zero-line positioning
🎉 Why Choose Signal Hunter Pro?
✅ Multi-Indicator Confirmation reduces false signals
✅ Trend Strength Filtering improves win rate
✅ Volume Confirmation ensures market participation
✅ Customizable Parameters adapt to any trading style
✅ Clean Visual Design doesn't clutter your charts
✅ Professional Alert System for automated trading
✅ No Repainting - reliable historical signals
✅ Works on All Timeframes from scalping to investing

HTF Dealing Range & FibsKey Features:
Premium & Discount Zone Visualization: Clear, color-coded boxes are drawn to represent the Premium (sell zone), Discount (buy zone), and the crucial Equilibrium (50%) level. These boxes extend into the future so you can anticipate future price action.
Customizable Fibonacci Levels: Plot key Fibonacci retracement levels within the defined range. You can customize which levels you want to see (e.g., 0.62, 0.79, etc.) to pinpoint specific points of interest.
Multi-Timeframe Confluence Table: A powerful, on-screen dashboard that shows you the status of the current price relative to the P&D zones on up to 5 different timeframes simultaneously. Instantly see if the price is in a Premium or Discount zone on the 15m, 1H, 4H, and Daily charts at a single glance.
Built-in Alerts: Never miss an opportunity. Set up alerts to be notified the moment the price enters the Premium or Discount zone on your chosen HTF, allowing you to prepare for potential trade setups.
Fully Customizable: Take full control over the indicator's appearance. Adjust pivot lookback periods, colors of the zones and Fibs, and select which timeframes appear in your dashboard to match your personal trading plan.
Disclaimer:
This indicator is provided for educational and informational purposes only and should not be considered as financial or investment advice. Trading and investing in financial markets, including but not limited to stocks, forex, and cryptocurrencies, involves a substantial risk of loss and is not suitable for every investor.
