FVG Heatmap [Hash Capital Research]FVG Map
FVG Map is a visual Fair Value Gap (FVG) mapping tool built to make displacement imbalances easy to see and manage in real time. It detects 3-candle FVG zones, plots them as clean heatmap boxes, tracks partial mitigation (how much of the zone has been filled), and summarizes recent “fill speed” behavior in a small regime dashboard.
This is an indicator (not a strategy). It does not place trades and it does not publish performance claims. It is a market-structure visualization tool intended to support discretionary or systematic workflows.
What this script detects
Bullish FVG (gap below price)
A bullish FVG is detected when the candle from two bars ago has a high below the current candle’s low.
The zone spans from that prior high up to the current low.
Bearish FVG (gap above price)
A bearish FVG is detected when the candle from two bars ago has a low above the current candle’s high.
The zone spans from the current high up to that prior low.
What makes it useful
Heatmap zones (clean, readable FVG boxes)
Bullish zones plot below price. Bearish zones plot above price.
Partial fill tracking (mitigation progress)
As price trades back into a zone, the script visually shows how much of the zone has been filled.
Mitigation modes (your definition of “filled”)
• Full Fill: price fully trades through the zone
• 50% Fill: price reaches the midpoint of the zone
• First Touch: price touches the zone one time
Optional auto-cleanup
Optionally remove zones once they’re mitigated to keep the chart clean.
Fill-Speed Regime Dashboard
When zones get mitigated, the script records how many bars it took to fill and summarizes the recent environment:
• Average fill time
• Median fill time
• % fast fills vs % slow fills
• Regime label: choppy/mean-revert, trending/displacement, or mixed
How to use
Use FVG zones as structure, not guaranteed signals.
• Bullish zones are often watched as potential support on pullbacks.
• Bearish zones are often watched as potential resistance on rallies.
The fill-speed dashboard helps provide context: fast fills tend to appear in more rotational conditions, while slow fills tend to appear in stronger trend/displacement conditions.
Alerts
Bullish FVG Created
Bearish FVG Created
Notes
FVGs are not guaranteed reversal points. Fill-speed/regime is descriptive of recent behavior and should be treated as context, not prediction. On realtime candles, visuals may update as the bar forms.
Fvg

ICT Unicorn Model [Kodexius]ICT Unicorn Model is a market structure and imbalance confluence tool that automatically detects high probability “Unicorn” setups by combining three key elements into a single, clean script:
-A first, clean break of that swing level (displacement style break)
-A Fair Value Gap that overlaps a breaker candle body range
Instead of plotting every pivot or every imbalance independently, the script waits for a specific sequence: price establishes a valid swing, breaks that swing for the first time, and prints a setup only when the resulting context aligns with a valid, volatility filtered FVG and a clearly defined breaker range.
Each detected setup is drawn directly on the chart with labeled zones (Breaker and FVG) and is then actively monitored. If price violates the breaker boundary based on your chosen invalidation basis (Close or Wick), the setup is marked inactive and can optionally be removed to keep the chart clean.
This indicator is designed for traders who work with ICT style concepts such as liquidity runs, displacement, breaker blocks, and imbalance reversion, and who want a structured, rules based visualization rather than discretionary drawing.
🔹 Features
🔸 Fair Value Gap Detection With Volatility Filtering
Bullish and bearish FVGs are detected using classic three candle imbalance logic. To avoid low quality gaps during compression, the script applies an ATR based minimum size filter using the “FVG Min Size (ATR Multiplier)” input. Only gaps larger than ATR * threshold are considered valid.
🔸 First Break Validation (Clean Break Logic)
A key part of the model is identifying a “first break” of a swing level. The script checks whether the swing price has already been invalidated between the swing bar and the current bar. If it has, the swing is ignored. This helps reduce repeated signals and focuses on fresh structural breaks.
🔸 Breaker and FVG Confluence With Overlap Requirement
After a valid break occurs, the script defines a breaker range using the body of the swing candle (open and close). A setup is only created if this breaker body range overlaps the detected FVG price range. This overlap requirement is what filters many “almost” conditions and keeps signals more selective.
Bullish Unicorn:
Bearish Unicorn:
🔸 Configurable Invalidation Basis (Close or Wick)
You can choose how a setup fails:
-Close: invalidation requires a candle close beyond the breaker boundary
-Wick: invalidation occurs as soon as any wick crosses beyond the breaker boundary
This allows the tool to adapt to different trading styles, from conservative confirmation to more sensitive risk control.
🔸 Automatic Cleanup of Failed Setups
If “Delete Invalidated Setups” is enabled, the script removes the breaker box, FVG box, and label as soon as the setup is invalidated. If disabled, the zones remain visible for review while the setup is marked inactive internally.
🔸 Clear Chart Visuals
Each setup plots:
-A labeled Breaker zone box
-A labeled FVG zone box
-A directional Unicorn label (Bull or Bear) that updates position as the chart advances
Colors for bullish and bearish structures are fully configurable.
🔸 Alert Conditions
Two alert conditions are provided:
-Bullish Unicorn Setup Detected
-Bearish Unicorn Setup Detected
Alerts trigger only on the bar a new setup is created.
🔹 Calculations
This section summarizes the main computations used internally. The goal here is to explain the model mechanics rather than reproduce every implementation detail.
1. Swing Detection (Pivot High / Pivot Low)
Swing levels are detected using a symmetric pivot definition with “Swing Length” bars on both sides:
float ph = ta.pivothigh(high, swingLength, swingLength)
float pl = ta.pivotlow(low, swingLength, swingLength)
When a pivot is confirmed, its price and originating bar index are stored:
-Swing High: price = pivot high, isHigh = true
-Swing Low: price = pivot low, isHigh = false
The script keeps a limited history (most recent swings) to stay efficient.
2. Fair Value Gap Detection
FVGs use the classic three candle displacement imbalance:
Bullish FVG condition
bool isBullFVG = high < low
Bullish gap range is defined as:
-Top = low
-Bottom = high
Bearish FVG condition
bool isBearFVG = low > high
Bearish gap range is defined as:
-Top = low
-Bottom = high
3. ATR Based Minimum Gap Filter
ATR is computed (length 14), then the gap size is compared against a user threshold:
float atr = ta.atr(14)
bool validBullFVG = isBullFVG and (bullFvgTop - bullFvgBot) > (atr * fvgThreshold)
bool validBearFVG = isBearFVG and (bearFvgTop - bearFvgBot) > (atr * fvgThreshold)
This prevents very small imbalances from generating setups in low volatility conditions.
4. “First Break” Check Using Level Invalidation Scan
Before accepting a swing break, the script scans forward from the swing bar to the current bar to confirm the level has not already been breached. The scan can be based on wick or close:
-Wick mode: uses high or low
-Close mode: uses close
Conceptually:
priceToCheck = mode == "Wick" ? (checkBelow ? low : high) : close
If a prior breach is found, the swing is treated as already invalidated and is ignored for setup creation.
5. Break Of Structure Condition
Bullish break requirement
A bullish setup requires breaking a stored swing high with bullish body intent:
-close > swingHighPrice
-open < close
Bearish break requirement
A bearish setup requires breaking a stored swing low with bearish body intent:
-close < swingLowPrice
-open > close
An additional proximity filter is applied in the bearish branch to reduce weak or overly extended breaks by requiring the prior close to be reasonably near the swing level.
6. Breaker Range Construction
Once a qualifying swing is found, the breaker range is derived from the body of the swing candle (the candle at the swing bar index). The body boundaries are:
float breakerTop = math.max(bOpen, bClose)
float breakerBot = math.min(bOpen, bClose)
This models the breaker as the candle body range rather than full wick range, which typically produces more practical invalidation boundaries.
7. Overlap Test Between Breaker and FVG
A setup is only created if the breaker body overlaps the FVG zone. Conceptually the script rejects cases where one range is fully above or fully below the other:
-If there is no overlap, no setup is created
-If overlap exists, the Unicorn setup is valid
8. Active Monitoring and Invalidation
Each setup remains active until invalidated. Invalidation is evaluated every bar using your selected basis:
-Close basis: compares close to breaker boundary
-Wick basis: compares high or low to breaker boundary
Bullish invalidation
Setup fails if price crosses below breaker bottom.
Bearish invalidation
Setup fails if price crosses above breaker top.
If deletion is enabled, all drawings related to that setup are removed immediately on invalidation.
9. Drawing Updates and Object Lifecycle
Breaker and FVG boxes are extended to the right while the setup is active to keep zones visible into the near future. The Unicorn label is also repositioned as new bars print so the most recent context stays readable.

Market Structure HighLow + Liquidity [MaB]📊 Market Structure HighLow + Liquidity A comprehensive indicator combining precision market structure analysis with real-time liquidity zone detection, built on a custom finite-state machine architecture.
━━━━━━━━━━━━━━━━━━━━━━━━━━━━━━━━━━━━━━━━
🎯 KEY FEATURES
• Automatic Swing Detection Identifies structural High/Low points using a dual-confirmation system (minimum candles + pullback percentage)
• Smart Trend Tracking Automatically switches between Uptrend (Higher Highs & Higher Lows) and Downtrend (Lower Highs & Lower Lows)
• Breakout Alerts Visual markers for confirmed breakouts (Br↑ / Br↓) with configurable threshold
• Sequential Labeling Clear numbered labels (L1, H2, L3, H4...) showing the exact market structure progression
• Color-Coded Structure Lines
• Green: Uptrend continuation legs
• Red: Downtrend continuation legs
• Gray: Trend inversion points
• Imbalance Zones (FVG) Automatically detects Fair Value Gaps that form during impulsive moves between validated swing points
• Inducement Zones Identifies potential liquidity traps - FVGs that form before breakout confirmation, often used as stop-hunt areas
• Dynamic Zone Management Zones automatically close when price touches them, with configurable retracement sensitivity
━━━━━━━━━━━━━━━━━━━━━━━━━━━━━━━━━━━━━━━━
🔬 TECHNICAL ARCHITECTURE
This indicator does NOT rely on TradingView's built-in ta.pivothigh() / ta.pivotlow() functions.
Instead, it implements a custom finite-state machine (FSM) that manages multiple monitoring states, alternating dynamically between Uptrend and Downtrend modes based on confirmed breakouts.
Core Components:
• State Machine Engine Multiple internal states handle candidate detection, validation, and confirmation phases. The system transitions between states based on price action triggers and confirmation criteria.
• Dual-Confirmation System Each swing point must satisfy two independent filters before validation:
o Time-based filter (minimum candles)
o Price-based filter (minimum retracement %)
• Directional Breakout Logic Separate breakout detection routines for uptrend continuation, downtrend continuation, and trend inversion scenarios. Each triggers specific state transitions.
• FVG Classification Engine Automatically distinguishes between Imbalance zones (post-confirmation FVGs) and Inducement zones (pre-confirmation FVGs) based on breakout timing context.
• Dynamic Zone Lifecycle Zones are created, monitored, and closed through a managed lifecycle with configurable touch sensitivity.
━━━━━━━━━━━━━━━━━━━━━━━━━━━━━━━━━━━━━━━━
⚙️ CONFIGURABLE PARAMETERS
Market Structure
• Analysis Start Date: Define when to begin structure analysis
• Min Confirmation Candles: Required candles for validation (default: 3)
• Pullback Percentage: Minimum retracement for confirmation (default: 10%)
• Breakout Threshold: Percentage beyond structure for breakout (default: 1%)
Liquidity
• Show Zones: Toggle visibility of imbalance and inducement zones
• Zone Colors: Customize colors for Supply/Demand imbalances and inducements
• Zone Retracement %: How deep price must enter zone to consider it touched (0-100%)
• Inactive Zones Transparency: Visual distinction for closed zones
Display
• Show Market Structure Table: Toggle info panel
• Replay Mode: Optimize for TradingView Replay feature
━━━━━━━━━━━━━━━━━━━━━━━━━━━━━━━━━━━━━━━━
🎨 ZONE COLOR CODING
• 🔴 Imbalance Supply (Red): Bearish FVG - potential resistance/short entry
• 🟢 Imbalance Demand (Green): Bullish FVG - potential support/long entry
• 🟠 Inducement Supply (Orange): Pre-breakout bearish FVG - possible stop-hunt zone
• 🔵 Inducement Demand (Blue): Pre-breakout bullish FVG - possible stop-hunt zone
━━━━━━━━━━━━━━━━━━━━━━━━━━━━━━━━━━━━━━━━
💡 HOW IT WORKS
1. Initializes state machine in UPTREND mode, searching for first swing Low
2. Tracks price movement and triggers candidate states upon potential reversals
3. Validates candidates through dual-confirmation (time + price filters)
4. Upon confirmation, scans price range for FVG patterns (3-candle gaps)
5. Classifies detected FVGs based on breakout timing (Inducement vs Imbalance)
6. Monitors breakout levels - triggers state transitions on confirmed breaks
7. Alternates between Uptrend/Downtrend modes based on breakout direction
8. Manages zone lifecycle - closes zones when price retraces into them
━━━━━━━━━━━━━━━━━━━━━━━━━━━━━━━━━━━━━━━━
🔧 BEST USED FOR
• Identifying key support/resistance levels with liquidity context
• Spotting potential reversal zones (imbalances)
• Avoiding stop-hunt traps (inducement awareness)
• Trend direction confirmation
• Breakout trading setups with confluence
• Multi-timeframe structure and liquidity analysis
• Understanding where institutional orders may be resting
━━━━━━━━━━━━━━━━━━━━━━━━━━━━━━━━━━━━━━━━
⚠️ NOTES
• Works best on higher timeframes (1H+) for cleaner structure
• Inducement zones often convert to Imbalance zones after breakout confirmation
• Zone Retracement % allows fine-tuning: 0% = first touch, 25% = quarter penetration, 100% = full traversal
• Inactive zones remain visible (faded) to show historical liquidity levels
• Use Replay Mode when backtesting to prevent buffer overflow errors

ICT MTF FVG BPR Toolkit [D4A}The ICT MTF FVG BPR Toolkit encompasses the following 5 components:
- Fair Value Gaps - current timeframe
- Fair Value Gaps - higher timeframe
- BPR - Balanced Price Range
- Long Wicks - which are considered to be gaps by ICT
- Immediate Rebalance - it leaves no gaps, but is as important in assessing current workflow
This is advanced Fair Value Gaps script that uses trading methodology taught by ICT trader. To use it effectively it requires at least some basic knowledge of Smart Money Concepts (SMC) as outlined in ICT's lectures found on YT. I may publish another SMC related scripts in future if this kind of tool is useful to anybody.
The idea behind this work, is to have all the necessary tools related to Fair Value Gaps in one script that is easy to use (requires SMC knowledge), fully customizable and will keep the chart as clutter free as possible. Since, I could not find a ready-made script which would tick all my requirements, I created this new script, partially by borrowing some ideas and code from existing open source projects that I liked. Rather than re-inventing the wheel, I focused on adopting and improving existing solutions and have them work together in one tool that could present the information accurately and in a polished way, where the trader can customize almost everything. Full credit goes to other coders, who tackled this subject before me, but particularly to:
QuantVue
LuxAlgo
pmk07
The script have these unique features:
- Can present FVGs from up to 3 different timeframes at any given interval
- The amount and interval of higher timeframe FVGs is fully customizable
- FVGs can be displayed based on size
- Volume Imbalance can be included as part of FVG (as recommended by ICT)
- Higher timeframe FVGs can have quadrants displayed along with C.E. (based on ATR filter)
- Both current and higher timeframe FVGs can be displayed in different ways depending on price interactions
- BPR which works on current timeframe only
- Long Wick detection logic has been slightly changed from the original LuxAlgo code
- Immediate Rebalance code has been simplified and re-focused on clarity
-----------------
Disclaimer
The information contained in my Scripts/Indicators/Ideas/Algos/Systems does not constitute financial advice or a solicitation to buy or sell any securities of any type. I will not accept liability for any loss or damage, including without limitation any loss of profit, which may arise directly or indirectly from the use of or reliance on such information.
All investments involve risk, and the past performance of a security, industry, sector, market, financial product, trading strategy, backtest, or individual's trading does not guarantee future results or returns. Investors are fully responsible for any investment decisions they make. Such decisions should be based solely on an evaluation of their financial circumstances, investment objectives, risk tolerance, and liquidity needs.
My Scripts/Indicators/Ideas/Algos/Systems are only for educational purposes!

FVG BOS SMC Liquidity Analyzer - Ambrosia-Prime - Basic v1.0# 📘 USER GUIDE
# FVG BOS Volume Volatility Entry/TP/SL Liquidity Analyzer
## 🆓 FREE Basic v1.0 | by Ambrosia-Prime
---
## 📋 TABLE OF CONTENTS
1. (#what-is-this-indicator)
2. (#settings-explained)
3. (#understanding-the-tables)
4. (#your-first-trade)
5. (#free-vs-premium)
6. (#faq)
---
## 🎯 WHAT IS THIS INDICATOR?
The **FVG Analyzer** is a professional trading tool based on **Smart Money Concepts (SMC)** and **ICT strategies**. It automatically detects:
✅ **Fair Value Gaps (FVG)** - Market imbalances
✅ **Break of Structure (BOS)** - Trend confirmations
✅ **Multi-Timeframe Analysis** - 4H, 1H, 15m, 5m, 1m
✅ **Entry, Stop-Loss & Take-Profit** - Automatic level calculation
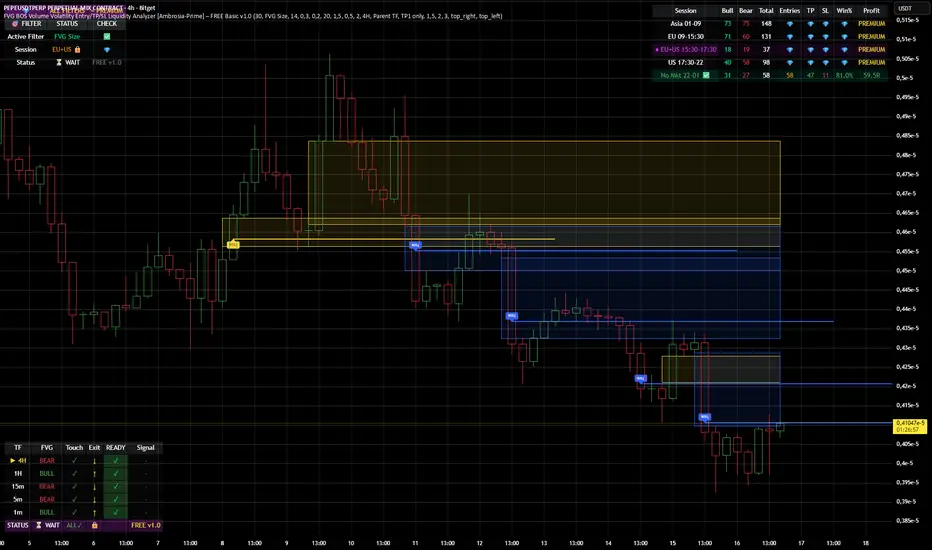
### The Debug Table shows you everything:
| TF | FVG | Touch | Exit | READY | Signal |
|-----|------|-------|------|-------|--------|
| ► 4H| BULL | ✓ | ↑ | ✓ | LONG |
| 1H | BULL | ✓ | ↑ | ✓ | LONG |
| 15m | BULL | ✓ | ↑ | ✓ | LONG |
When all timeframes show **READY** → **ENTRY SIGNAL!**
---
## ⚙️ SETTINGS EXPLAINED
### 👁 DISPLAY SETTINGS
| Setting | Description |
|---------|-------------|
| Show Bullish FVG | Display yellow FVG boxes |
| Show Bearish FVG | Display blue FVG boxes |
| Show BOS lines | Break of Structure lines |
| Show Session Stats | Statistics table (top right) |
| Show Debug Table | Cascade status (bottom left) |
| Show Entry/SL/TP | Entry lines on signals |
### 🎯 BASIC FILTER (Choose ONE)
In the **FREE Version** you can only activate **1 filter** at a time:
| Filter | What it does |
|--------|--------------|
| **None** | No filter active |
| **FVG Size** | Only FVGs larger than X × ATR |
| **Volume** | Only on above-average volume |
| **Volatility** | Only on normal volatility (not too wild) |
| **BOS only with FVG** | BOS only when open FVG exists |
| **Fill Delete** | FVG disappears when completely filled |
> 💎 **PREMIUM:** Use all 15+ filters simultaneously!
### 🔄 TOUCH + EXIT CASCADE
| Setting | Options | Recommendation |
|---------|---------|----------------|
| Cascade Parent TF | 4H, 1H, 15m | **4H** for Swing |
| Confirm EXIT by WICK | ON/OFF | **ON** for more signals |
| Entry Trigger Level | Lowest/Middle/Parent | **Parent TF** |
| Require ALL TFs | ON/OFF | **ON** for quality |
### 📊 TP SETTINGS
| Setting | Description |
|---------|-------------|
| TP Mode | TP1 only / TP1+TP2 / TP1+TP2+TP3 |
| TP1 Risk:Reward | e.g. 1.5 = 1.5× your risk |
| TP2 Multiplier | e.g. 2.0 = 2× TP1 |
| TP3 Multiplier | e.g. 3.0 = 3× TP1 |
---
## 📈 UNDERSTANDING THE TABLES
### 📍 Filter Status (Top Left)
```
┌─────────────────────────────────────┐
│ 💎 │ ALL FILTERS │ = PREMIUM │
├─────────────────────────────────────┤
│ Active Filter │ FVG Size │ ✅ │
│ Session │ EU 🔒 │ 💎 │
│ Status │ ⏳ WAIT │FREE v1.0│
└─────────────────────────────────────┘
```
- **Active Filter:** Your selected filter
- **Session:** Current trading session
- 🔒 = Locked (PREMIUM only)
- ✅ = Unlocked (No Market 22-01 CET)
- **Status:** WAIT / 🟢 LONG / 🔴 SHORT
### 📊 Session Stats (Top Right)
```
┌──────────────────────────────────────────────────────────┐
│ Session │Bull│Bear│Total│Entries│TP│SL│Win%│Profit│
├──────────────────────────────────────────────────────────┤
│ Asia 01-09 │173 │161 │ 334 │ 💎 │💎│💎│ 💎 │PREMIUM│
│ EU 09-15:30 │131 │146 │ 277 │ 💎 │💎│💎│ 💎 │PREMIUM│
│ EU+US 15:30-17:30│ 37 │ 42 │ 79 │ 💎 │💎│💎│ 💎 │PREMIUM│
│ US 17:30-22 │ 95 │106 │ 201 │ 💎 │💎│💎│ 💎 │PREMIUM│
│ No Mkt 22-01 ✅ │ 42 │ 52 │ 94 │ 14 │14│ 0│100%│ 9.8R │
└──────────────────────────────────────────────────────────┘
```
**In FREE you see:**
- ✅ Bull/Bear/Total FVGs for **ALL** sessions
- ✅ Complete stats only for **No Market (22-01 CET)**
- 💎 Other sessions = **PREMIUM**
### 🔍 Debug Table (Bottom Left)
Shows the **live status** of the cascade:
| Symbol | Meaning |
|--------|---------|
| ► | Parent timeframe (selected) |
| BULL/BEAR | FVG direction |
| ✓ (Touch) | Price touched the zone |
| ↑/↓ (Exit) | Price exited the zone |
| ✓ (READY) | Timeframe is ready |
| LONG/SHORT | Signal direction |
---
## 🚀 YOUR FIRST TRADE
### Preface - Why this Indicator is Different
This indicator can filter so **aggressively** that you receive few or almost no signals. **That was exactly my goal!**
I don't need 500 entries per day staring at a chart all day long.
**I only need 1-3 signals per day - and they should work.**
That was the goal. Quality over quantity.
---
### Step-by-Step Guide:
**1. Create a Watchlist**
- Create a watchlist in TradingView
- Add as many charts as your account allows
- Add the indicator to all charts
**2. Set up Alerts**
- Go to the **4H chart**
- Set up the alert:
- **FREE:** Only "No Market" session (22-01 CET)
- **PREMIUM:** All sessions available
- Select "Any Entry Signal"
**3. React to Alert Signal**
- When an alert comes → Switch to the chart
- Check the **Session Stats Table** (top right)
- There you see: Entry, TP, SL, Win%, Profit
**4. Optimize Entry**
- Open the **Settings** (gear icon)
- Adjust the **TP** until you win all trades
- *(Sometimes profit is higher when you lose one trade but have a higher TP)*
- When you've found the best profit result:
- **Take the set TP minus 10-20%**
- *(We don't want to be greedy, but we want to win!)*
**5. Manage Trade**
- The **SL price** is already provided
- The **TP price** adjusts to your settings
- Set your trade accordingly
**6. Done!**
- Start the trade
- Wait for the next signal on another chart
- Repeat!
---
### ⚠️ Important Note
> Remember: A trade can always hit SL!
> Only trade with money you can afford to lose.
>
> I wish you great success and let me know how successful you were.
> **I will read every comment and answer to the best of my ability.**
---
## 💎 FREE vs PREMIUM
### *Coming soon - Currently in Release Testing*
### What you get with FREE:
| Feature | FREE 🆓 |
|---------|---------|
| FVG Detection (all TFs) | ✅ |
| BOS Detection | ✅ |
| Cascade Logic | ✅ |
| Debug Table | ✅ |
| Session Stats Table | ✅ |
| Entry/SL/TP Lines | ✅ |
| Filters | **1 at a time** |
| Trading Sessions | **Only No Market (22-01)** |
| Alerts | **Only No Market** |
### What you get with PREMIUM:
| Feature | PREMIUM 💎 |
|---------|------------|
| Everything from FREE | ✅ |
| **15+ filters simultaneously** | ✅ |
| **All sessions unlocked** | ✅ |
| → Asia (01-09) | ✅ |
| → EU (09-15:30) | ✅ |
| → EU+US Overlap (15:30-17:30) | ✅ |
| → US (17:30-22) | ✅ |
| **Alerts for all sessions** | ✅ |
| **Session-based TP optimization** | ✅ |
| **HTF Zone Confluence Filter** | ✅ |
| **Structure Filter (HH/HL/LH/LL)** | ✅ |
| **RR Filter** | ✅ |
| **Trend EMA Filter** | ✅ |
| **Candle Quality Filter** | ✅ |
| **Cooldown Filter** | ✅ |
| **FVG Age Filter** | ✅ |
### 🚀 PREMIUM EDITION (Exclusive!)
The Premium version has **two different entry logics** - that's why the testing phase is still ongoing.
Finds setups with **10-100% potential!**
---
## ❓ FAQ
### "Why don't I see any entries?"
**Possible reasons:**
1. **Wrong session:** FREE only works 22:00 - 01:00 CET
2. **Cascade not READY:** All TFs must show ✓
3. **Filter blocking:** Check your active filter
4. **Already in trade:** "Single Trade" allows only 1 trade
### "What do the colors mean?"
| Color | Meaning |
|-------|---------|
| 🟡 Yellow | Bullish FVG / Entry line |
| 🔵 Blue | Bearish FVG |
| 🟢 Green | TP line / Positive |
| 🔴 Red | SL line / Negative |
| 🟣 Purple | EU+US Overlap Session |
### "Which timeframe should I use?"
| Your Style | Chart TF | Cascade Parent |
|------------|----------|----------------|
| Scalping | 1m - 5m | 15m |
| Daytrading | 5m - 15m | 1H |
| Swing | 15m - 1H | 4H |
### "Can I change the sessions?"
- **FREE:** No, only No Market (22-01) is available.
- **PREMIUM:** Yes, all sessions + session-based TP values!
---
## 📞 WANT MORE?
### Unlock PREMIUM:
- ✅ All Sessions
- ✅ All Filters
- ✅ 2 Entry Logics
- ✅ Priority Support
### Contact & Support:
📊 **TradingView:** (www.tradingview.com)
---
## 📜 CHANGELOG
### v1.0 FREE (December 2024)
- Initial Release
- Multi-TF FVG Detection
- BOS Detection
- Cascade Logic
- 1 Filter (Dropdown)
- No Market Session (22-01)
- Session Statistics
- Debug Table
---
## ⚠️ DISCLAIMER
This indicator is an **analysis tool** and not financial advice.
Trading involves risks. Past results do not guarantee future profits.
Only trade with capital you can afford to lose.
---
**Good luck with your trading! 🚀**
*Your Ambrosia-Prime*
---
*© 2024 Ambrosia-Prime. All rights reserved.*
RMI Valid FVG & IFVGRMI • Valid FVG & iFVG (Smart Money Concept)
RMI • Valid FVG & iFVG is a precision-focused Fair Value Gap indicator designed for traders who follow Smart Money Concepts (SMC) / ICT logic and want to filter out low-quality, random gaps.
This indicator does not plot every FVG.
It highlights only structurally relevant FVGs that form in the direction of the trend and have a high probability of being filled.
Core Features
Bullish & Bearish Fair Value Gaps
Inverse Fair Value Gaps (iFVG)
Trend-aligned FVG filtering
Automatic invalidation after mitigation
Clean background zones for clear visibility
Optimized for intraday trading
Adjustable settings for scalping, intraday & swing trading
Smart Filtering Logic
FVGs are validated using market structure context
Only FVGs that form within the active trend are displayed
Weak or low-probability gaps are ignored
Inverse FVGs appear after strong displacement and rejection
Zones are visually faded once mitigated
This helps reduce chart noise and keeps the focus on high-probability reaction zones.
Best Use Cases
Entry refinement after BOS / CHoCH
Confluence with liquidity grabs
Premium / discount zone trading
Intraday & session-based trading
Works well with ICT, SMC, price action & structure-based strategies
Recommended Timeframes
Scalping: M1 – M5
Intraday (default): M5 – M15
Swing Trading: M15 – H1
(Default settings are optimized for intraday trading.)
Important Notes
This is not a signal indicator
No repainting
No buy/sell arrows
Designed as a decision-support tool, not an automated system
Always combine with proper risk management and confirmation.
RMI • Precision over noise.
Trade structure, not randomness.

ADAPTIVE ICT MULTI-ZONEAdaptive ICT Multi-Zone
Why Another ICT Script?
Most public ICT zone scripts flood your chart with dozens of noisy, overlapping boxes that never get cleaned up, use fixed lookbacks that work on one asset and fail on another, and mark every tiny gap as “FVG” — turning the chart into a rainbow mess that’s impossible to trade.
ADAPTIVE ICT MULTI-ZONE is built differently:
Only the strongest, most recent zones pass the adaptive filter (default 3 bullish OB + 3 bearish OB + 3 FVG). No more chart clutter.
Fair Value Gaps are filtered by ATR (default ≥ 0.7 × ATR) and optional high-volume confirmation so you only see gaps that actually matter.
Order Blocks are true swing-based (pivot high/low).
Every zone automatically extends far to the right until price closes through it — you never miss a mitigation.
Zero repainting. Zero lag. Zero memory leaks. Runs perfectly on every time frame.
In short: while many ICT scripts are noisy toys, this one is a surgical tool that shows exactly what institutional desks are up to.
How to Trade It Best (Simple & Effective)
Wait for price to return to a freshly drawn zone (watch the newest ones — they have the highest probability).
Look for confluence:
Price inside a Bullish Order Block + bullish engulfing or strong volume → aggressive long.
Price inside a Bearish Order Block + bearish engulfing or strong volume → aggressive short.
Price sweeping into an FVG and instantly rejecting → high-probability reversal (especially if the FVG had high volume when created).
Use higher-timeframe bias: if the daily/4H zone aligns with your 15-min or 5-min zone → stack size.
Take partials at the opposite-side order block or next FVG. Let runners go to next liquidity zone.
That’s it.
This script doesn’t try to do everything. It does one thing — show you the exact institutional zones that actually get respected — and it does it cleaner and smarter.
Add it, delete every other OB/FVG script you own, and catch more accurate reversals.

KIMATIX Silver Bullet 2.0KIMATIX Silver Bullet 2.0 is a precision-based intraday trading tool built around the most reliable market behaviors during the ICT Silver Bullet windows.
The indicator automatically identifies high-probability price delivery zones by combining time-based session logic, displacement, fair value gaps, and liquidity dynamics — without clutter or subjective interpretation.
What the indicator does
Automatically marks the three core Silver Bullet windows (New York time)
Tracks session highs and lows to define contextual liquidity
Detects displacement moves using adaptive volatility logic
Highlights valid Silver Bullet Fair Value Gaps (FVGs) only when structural conditions are met
Filters weak setups by minimum size, age, and directional confirmation
Projects FVG zones forward to monitor clean retracements
Plots liquidity levels (highs & lows) with optional mitigation handling
All calculations are done fully automatically — no manual drawing, no guessing.
Designed for
Scalper and Intraday traders (especially 1–5 minute charts)
Futures, indices, forex, and crypto
Traders who want clear execution zones, not lagging signals
Anyone using liquidity-based or ICT-style frameworks
Key advantages
No signals, no repainting logic — context first
Strict filtering to reduce noise and over-marking
Clean visual layout focused on price delivery
Works seamlessly alongside higher-timeframe bias and volume tools
This indicator does not tell you when to trade —
it shows you where the market is most likely to react.
Important note
KIMATIX Silver Bullet 2.0 is a context and execution tool, not a standalone strategy.
Best results are achieved when combined with proper risk management and directional bias.
More Infos and Premium Indicators: kimatixtrading.com

KIMATIX FVG/IFVG/BPRProfessional Fair Value Gap & Imbalance Toolkit
The KIMATIX FVG/IFVG/BPR indicator is a precision tool designed to identify institutional inefficiencies in price:
Fair Value Gaps (FVG), Inverse Fair Value Gaps (IFVG) and Balanced Price Ranges (BPR) — clean, minimal and non-repainting.
This indicator is built for scalpers, intraday traders and smart-money traders who want to trade where price is most likely to react, not where indicators lag.
What this indicator shows
Fair Value Gaps (FVG)
Detects bullish and bearish FVGs using strict 3-candle imbalance logic
Highlights areas where price moved too fast, leaving inefficient structure
Ideal for:
Continuation trades
Pullback entries
Reaction zones after impulse moves
Color-coded
🟢 Bullish FVG
🔴 Bearish FVG
Inverse Fair Value Gaps (IFVG)
Automatically detects when an FVG is invalidated
Marks the same zone as an Inverse FVG
Extremely useful for:
Failed structure setups
Reversal trades
Stop-hunt & liquidity traps
Color-coded
🟡 IFVG (invalidation zone)
Balanced Price Range (BPR)
Detects overlapping bullish & bearish FVGs
Highlights price areas where buying and selling pressure are balanced
These zones often act as:
High-probability reaction areas
Compression zones before expansion
Premium intraday decision levels
Color-coded
🔵 BPR (balanced price range)
Smart, Clean & Non-Repainting
Non-repainting
Only the last 3 active zones are shown → no clutter
Boxes extend forward with a manual cap (user-controlled)
Designed for 1m – 15m execution, works on all markets
Futures, Crypto, FX, Indices, Stocks
How professionals use it
Combine FVGs with:
VWAP
Session highs/lows
Volume Profile (POC / VAH / VAL)
Market structure (BOS / displacement)
Use IFVGs to spot failed smart-money narratives
Use BPRs as decision zones, not blind entries
This indicator does not give buy/sell signals.
It shows you where trades make sense — execution is up to you.
Best use cases
Scalping (1m–3m)
Intraday trading (5m–15m)
Smart-money concepts
Liquidity-based trading
News reactions & stop runs
Learn how to trade it properly
This indicator is part of the KIMATIX Trading Framework.
More education, live examples & full system:
kimatixtrading.com

FVG vertical Created by Alphaomega18
🎯 What is an FVG (Fair Value Gap)?
A Fair Value Gap is a price imbalance created by a mismatch between buyers and sellers, formed by 3 consecutive candles where:
Bullish FVG: The low of the current candle is above the high of the candle 2 periods ago
Bearish FVG: The high of the current candle is below the low of the candle 2 periods ago
⚙️ Indicator Settings
Display Group:
Show Bullish vertical FVG: Display bullish vertical FVGs (green) ✅
Show Bearish vertical FVG: Display bearish vertical FVGs (red) ✅
Box Extension (bars): Zone extension duration (1-50 bars, default: 10)
Show Labels: Display labels with gap size 🏷️
Remove When Filled: Automatically remove filled zones ✅
📊 Visual Elements
FVG Zones:
🟢 Green = Bullish vertical FVG (potential support zone)
🔴 Red = Bearish vertical FVG (potential resistance zone)
Labels:
Show gap size in points
Positioned at the beginning of each zone
Dashboard (top right corner):
Real-time count of active FVGs
🟢 = Number of bullish vertical FVGs
🔴 = Number of bearish vertical FVGs
Candle Coloring:
Light green background = Candle forming a bullish vertical FVG
Light red background = Candle forming a bearish vertical FVG
🎯 How to Use the Indicator
1. Installation:
Open TradingView
Click "Indicators" at the top of the chart
Search for "FVG Clean" or paste the code in the Pine Editor
2. Trading Strategies:
Support/Resistance:
Bullish vertical FVGs act as support zones
Bearish vertical FVGs act as resistance zones
Price tends to return to "fill" these gaps
Position Entries:
Long: Wait for a return to a bullish vertical FVG + confirmation
Short: Wait for a return to a bearish vertical FVG + confirmation
Position Management:
Place stops below/above FVGs
Use FVGs as price targets
A filled FVG loses its validity
🔔 Alerts
The indicator includes 2 configurable alert types:
Bullish vertical FVG: Triggers when a new bullish vertical FVG forms
Bearish vertical FVG: Triggers when a new bearish vertical FVG forms
To configure: Right-click on chart → "Add Alert" → Select desired alert
💡 Usage Tips
✅ Do:
Combine with other indicators (volume, momentum)
Wait for confirmation before entering
Use across multiple timeframes
Respect your risk management
❌ Don't:
Trade solely on FVGs without confirmation
Ignore the overall market trend
Overload your chart with too many zones
🔧 Parameter Optimization
Scalping (1-5min):
Box Extension: 5-10 bars
Remove When Filled: Enabled
Day Trading (15min-1H):
Box Extension: 10-20 bars
Remove When Filled: Enabled
Swing Trading (4H-Daily):
Box Extension: 20-50 bars
Remove When Filled: As preferred
📈 Performance
Maximum 100 FVGs of each type in memory
Automatic removal of oldest ones
Optimized to not slow down your chart
Compatible with all markets and timeframes

SMC-Math by Thomas v1📌 SMC-Math by Thomas v1 — Description
SMC-Math by Thomas v1 is a complete Smart Money Concepts toolkit designed for traders who want a clean, mathematical, and structured view of market mechanics.
Rather than relying on abstract concepts or subjective drawings, this indicator focuses on rules-based detection of:
✔ Order Blocks (OB)
✔ Fair Value Gaps (FVG)
✔ Market Structure shifts (BoS / CHoCH)
✔ HTF trend confirmation
✔ Premium / Discount arrays
✔ Equal High & Equal Low Liquidity Zones (no hinting — expiry only)
This version is engineered for stability, clarity, and performance — with fully optimized array management, timestamp-based cleanup, and a clean visual presentation suitable for both discretionary and systematic trading.
📌 Key Features
🔹 1. Order Blocks (Bullish & Bearish)
Auto-detected using fractal swing highs/lows
Optional displacement + high volume filters
Midline display option
HTF trend alignment filter
Smart expiry + broken OB cleanup
Custom opacity, buffer, and extension controls
🔹 2. Fair Value Gaps (FVG)
Bullish and bearish gap detection
HTF confirmation-based dimming
No border for a clean ICT-style visuals
Auto remove when filled
Fully rule-based
🔹 3. Market Structure (BoS / CHoCH)
Based on fractal highs/lows
Automatic labeling (small, unobtrusive)
Direction validated by HTF option
Each structure level plotted with a projected line
Smooth, clean BOS/CHOCH flow
🔹 4. Premium / Discount Zones
Auto-calculated from most recent swing high & swing low
Box shading dynamically updates each bar
Helps identify optimal trade areas (OB → FVG → PD array)
🔹 5. Liquidity Zones (Equal Highs & Equal Lows)
This tool highlights where liquidity is likely resting:
Detects Equal Highs and Equal Lows using your tolerance or max difference
Auto-creates borderless shaded boxes
Adjustable box height and extension
NO hinting logic — the box remains for exactly cleanupDelay bars, then expires
Clean and predictable behavior, ideal for rule-based setups
This is especially useful for:
identifying buy-side and sell-side liquidity pools
anticipating runs on liquidity
targeting sweeps
🔹 6. HTF Status Panel
Shows higher-timeframe trend status on the live bar:
Bullish
Bearish
Or “HTF Not Required”
Useful for aligning entries with larger market flow.
📌 How to Use SMC-Math by Thomas v1
1️⃣ Identifying Direction
Start by reading:
HTF Trend Label
BOS & CHOCH reactions
Bullish: look for HL → HH structure + bullish OBs + bullish FVGs
Bearish: look for LH → LL structure + bearish OBs + bearish FVGs
This creates your directional bias.
2️⃣ Using Order Blocks
An OB is valid when:
It appears in line with structure
HTF alignment supports it (optional toggle)
Price returns after a displacement
OB is not “broken” (indicator handles this visually)
Use OBs as:
Rebalance targets
Entry areas
Stop placement logic
3️⃣ Fair Value Gaps
FVGs appear when price dislocates and leaves inefficiency.
Use them to:
Refine entries inside OBs
Project premium/discount zones
Identify continuation zones
The indicator auto-removes FVGs when filled.
4️⃣ Liquidity Zones
Liquidity zones identify resting orders at equal highs/lows.
This version uses simple expiry logic:
Box is created when EQH/EQL forms
It remains visible for 20 bars (default)
It disappears automatically after expiry
No hint/confirmation triggers deletion
Usage tips:
Expect price to run toward these zones
Use them as targets or continuation markers
Combine with OB/FVG for confluence
5️⃣ Premium / Discount Zones
Use PD arrays to gauge:
Premium = optimal shorting zones
Discount = optimal long zones
Not trade “in the middle” unless a clear BOS or CHoCH happens
📌 Recommended Workflow
HTF Bias → Check the HTF panel
Market Structure → Identify trend continuation or reversal
Liquidity → Mark where price is likely to target
FVG → Identify imbalance zones
OB → Confirm institutional origin points
PD Arrays → Determine optimal trade location
Execute with confluence
📌 Who Is This Indicator For?
✔ Traders using ICT / SMC logic
✔ Traders wanting rule-based, non-subjective markups
✔ Traders who want automated detection without repainting
✔ Anyone who uses OB, FVG, liquidity sweeps, and structure shifts

Fair Value Gap Signals [Kodexius]Fair Value Gap Signals is an advanced market structure tool that automatically detects and tracks Fair Value Gaps (FVGs), evaluates the quality of each gap, and highlights high value reaction zones with visual metrics and signal markers.
The script is designed for traders who focus on liquidity concepts, order flow and mean reversion. It goes beyond basic FVG plotting by continuously monitoring how price interacts with each gap and by quantifying three key aspects of each zone:
-Entry velocity inside the gap
-Volume absorption during tests
-Structural integrity and depth of penetration
The result is a dynamic, information rich visualization of which gaps are being respected, which are being absorbed, and where potential reversals or continuations are most likely to occur.
All visual elements are configurable, including the maximum number of visible gaps per direction, mitigation method (close or wick) and an ATR based filter to ignore insignificant gaps in low volatility environments.
🔹 Features
🔸 Automated Fair Value Gap Detection
The script detects both bullish and bearish FVGs based on classic three candle logic:
Bullish FVG: current low is strictly above the high from two bars ago
Bearish FVG: current high is strictly below the low from two bars ago
🔸 ATR Based Gap Filter
To avoid clutter and low quality signals, the script can ignore very small gaps using an ATR based filter.
🔸Per Gap State Machine and Lifecycle
Each gap is tracked with an internal status:
Fresh: gap has just formed and has not been tested
Testing: price is currently trading inside the gap
Tested: gap was tested and left, waiting for a potential new test
Rejected: price entered the gap and then rejected away from it
Filled: gap is considered fully mitigated and no longer active
This state machine allows the script to distinguish between simple touches, multiple tests and meaningful reversals, and to trigger different alerts accordingly.
🔸 Visual Ranking of Gaps by Metrics
For each active gap, three additional horizontal rank bars are drawn on top of the gap area:
Rank 1 (Vel): maximum entry velocity inside the gap
Rank 2 (Vol): relative test volume compared to average volume
Rank 3 (Dpt): remaining safety of the gap based on maximum penetration depth
These rank bars extend horizontally from the creation bar, and their length is a visual score between 0 and 1, scaled to the age of the gap. Longer bars represent stronger or more favorable conditions.
🔸Signals and Rejection Markers
When a gap shows signs of rejection (price enters the gap and then closes away from it with sufficient activity), the script can print a signal label at the reaction point. These markers summarize the internal metrics of the gap using a tooltip:
-Velocity percentage
-Volume percentage
-Safety score
-Number of tests
🔸 Flexible Mitigation Logic (Close or Wick)
You can choose how mitigation is defined via the Mitigation Method input:
Close: the gap is considered filled only when the closing price crosses the gap boundary
Wick: a full fill is detected as soon as any wick crosses the gap boundary
🔸 Alert Conditions
-New FVG formed
-Price entering a gap (testing)
-Gap fully filled and invalidated
-Rejection signal generated
🔹Calculations
This section summarizes the main calculations used under the hood. Only the core logic is covered.
1. ATR Filter and Gap Size
The script uses a configurable ATR length to filter out small gaps. First the ATR is computed:
float atrVal = ta.atr(atrLength)
Gap size for both directions is then measured:
float gapSizeBull = low - high
float gapSizeBear = low - high
If useAtrFilter is enabled, gaps smaller than atrVal are ignored. This ties the minimum gap size to the current volatility regime.
2. Fair Value Gap Detection
The basic FVG conditions use a three bar structure:
bool fvgBull = low > high
bool fvgBear = high < low
For bullish gaps the script stores:
-top as low of the current bar
-bottom as high
For bearish gaps:
-top as high of the current bar
-bottom as low
This defines the price range that is considered the imbalance area.
3. Depth and Safety Score
Depth measures how far price has penetrated into the gap since its creation. For each bar, the script computes a currentDepth and updates the maximum depth:
float currentDepth = 0.0
if g.isBullish
if l < g.top
currentDepth := g.top - l
else
if h > g.bottom
currentDepth := h - g.bottom
if currentDepth > g.maxDepth
g.maxDepth := currentDepth
The safety score expresses how much of the gap remains intact:
float depthRatio = g.maxDepth / gapSize
float safetyScore = math.max(0.0, 1.0 - depthRatio)
safetyScore near 1: gap is mostly untouched
safetyScore near 0: gap is mostly or fully filled
4. Velocity Metric
Velocity captures how aggressively price moves inside the gap. It is based on the body to range ratio of each bar that trades within the gap and rewards bars that move in the same direction as the gap:
float barRange = h - l
float bodyRatio = math.abs(close - open) / barRange
float directionBonus = 0.0
if g.isBullish and close > open
directionBonus := 0.2
else if not g.isBullish and close < open
directionBonus := 0.2
float currentVelocity = math.min(bodyRatio + directionBonus, 1.0)
The gap keeps track of the strongest observed value:
if currentVelocity > g.maxVelocity
g.maxVelocity := currentVelocity
This maximum is later used as velScore when building the velocity rank bar.
5. Volume Accumulation and Volume Score
While price is trading inside a gap, the script accumulates the traded volume:
if isInside
g.testVolume += volume
It also keeps track of the number of tests and the volume at the start of the first test:
if g.status == "Fresh"
g.status := "Testing"
g.testCount := 1
g.testStartVolume := volume
An average volume is computed using a 20 period SMA:
float volAvg = ta.sma(volume, 20)
The expected volume is approximated as:
float expectedVol = volAvg * math.max(1, (bar_index - g.index) / 2)
The volume score is then:
float volScore = math.min(g.testVolume / expectedVol, 1.0)
This produces a normalized 0 to 1 metric that shows whether the gap has attracted more or less volume than expected over its lifetime.
6. Rank Bar Scaling
All three scores are projected visually along the time axis as horizontal bars. The script uses the age of the gap in bars as the maximum width:
float maxWidth = math.max(bar_index - g.index, 1)
Then each metric is mapped to a bar length:
int len1 = int(math.max(1, maxWidth * velScore))
g.rankBox1.set_right(g.index + len1)
int len2 = int(math.max(1, maxWidth * volScore))
g.rankBox2.set_right(g.index + len2)
int len3 = int(math.max(1, maxWidth * safetyScore))
g.rankBox3.set_right(g.index + len3)
This creates an intuitive visual representation where stronger metrics produce longer rank bars, making it easy to quickly compare the relative quality of multiple FVGs on the chart.

Rolling Volume Profile [Matrix Volume Heatmap] by NXT2017Description
This indicator offers a unique visual approach to Volume Profile analysis. Instead of the traditional histogram bars or boxes, this script renders a Rolling Volume Profile as a background "Matrix Heatmap" directly on your chart.
By dividing the price action of the most recent N-candles into 30 horizontal zones (buckets), it visualizes where the most trading activity has occurred within your defined lookback period. The visualization uses dynamic transparency to highlight the Point of Control (POC) and high-volume nodes, while fading out low-volume areas.
🧠 How it Works
The script operates on a "Rolling Window" basis, meaning it recalculates the profile at every bar to reflect the immediate market context.
Dynamic Range: It calculates the highest High and lowest Low of the user-defined Lookback Length (default: 1000 bars).
Bucket Slicing: This vertical range is divided into 30 equal price buckets.
Volume Distribution (Overlap Logic): The script iterates through the historical data. If a candle is large and spans multiple buckets, its volume is distributed proportionally across those buckets. This ensures a more realistic profile compared to simply assigning volume to the close price.
Heatmap Visualization:
The script calculates the Maximum Volume (POC) within the profile.
It uses a Reference Length to normalize this maximum.
Dynamic Opacity: Zones with volume close to the maximum are rendered opaque (solid). Zones with low relative volume become highly transparent. This creates an automatic "Heatmap" effect, allowing you to instantly spot the most significant price levels.
⚙️ Settings
Lookback Length (candles): Defines how far back the profile calculates volume (e.g., 1000 bars).
POC Reference Length: Defines the smoothing window for the 100% volume baseline. Increasing this stabilizes the color changes; decreasing it makes the heatmap more reactive to sudden volume spikes.
Profil Color: Choose the base color for the matrix. The transparency is calculated automatically.
💡 Use Case
This tool is ideal for traders who want to see the "Value Area" of the current range without cluttering the chart with complex boxes or side-bars. It works excellent as a background context tool to identify:
High Volume Nodes (Support/Resistance)
Low Volume Nodes (Price gaps/Rejection areas)
Migrating Points of Control (Trend direction)

CK FVGThis indicator automatically finds bullish and bearish Fair Value Gaps and shows you which ones still matter — without you drawing anything.
What it does:
Marks every new FVG on the chart
Shows bullish (green) and bearish (red) gaps
Removes gaps once they’re mitigated (filled)
Highlights rejections when price taps the FVG and shoots away
Option to only show the last few unmitigated FVGs
Works on any timeframe
Extra features:
Dashboard showing total FVGs + mitigation %
Alert system for new FVGs and mitigations
Static or dynamic gap mode depending on your preference
Why traders like it:
No more drawing FVG boxes manually
Helps spot clean reaction zones
Perfect for ICT-style setups, liquidity plays, and reversals
Simple, clean, and does all the FVG work for you.

Imbalance Heatmap (Free) – pc75A clean, efficient visualisation of liquidity voids, 3-bar imbalances, and price inefficiency zones.
This indicator highlights where the market left gaps in the order flow — areas price often revisits to rebalance.
Imbalances are displayed as stacked horizontal “heatmap strips,” making it easy to see:
Where aggressive buying/selling left a void
Whether multiple voids overlap (stronger zones)
Whether price is likely to return to fill the imbalance
How old a void is (older zones are marked differently)
This is a refined v6 rewrite based on a script I liked, completely modernised with cleaner logic, better performance, and optional labels.
🔍 Features
3-bar liquidity void detection (ICT-style logic)
Bullish imbalance when price displaces upward with no wick overlap
Bearish imbalance for downward displacement
✔ Heatmap-style visualisation
Each imbalance is sliced into multiple thin horizontal bands to create a visual density effect.
✔ Stacking intelligence
If a new void overlaps previous ones, the heatmap is drawn brighter, showing areas where the market left multiple inefficiencies.
✔ “Void xN” labels
Optional labels show how many overlapping voids existed at the moment the imbalance formed.
✔ Automatic deletion when filled
As soon as price trades back through a slice, that slice is removed.
This keeps the chart clean and focuses only on active inefficiencies.
✔ Smart ageing
Older voids are marked with a subtle border so you can distinguish freshly formed inefficiencies from historical ones.
✔ Alerts
Set alerts for when price taps a stacked imbalance zone (“Void x2” and above).
⚙ Inputs & Customisation
ATR threshold (optional)
Minimum tick size gap
Number of heatmap slices
Bullish / bearish toggles
Label toggles
Colour and transparency configuration
Max slice memory for performance
💡 How to Use
Imbalance zones often behave as:
Magnets → price gravitates toward them
Support/resistance → structure respects inefficiencies
Continuity points → used with market structure shifts
Targets → for both scalpers and swing traders
Strong (stacked) voids typically represent areas of institutional displacement, where the market is more likely to return for rebalancing.
📢 Notes
This is the free version.
Educational only — not financial advice.

Multi-Timeframe Fair Value Gap by Vigna📊 Multi-Timeframe Fair Value Gap (FVG) Indicator
This indicator displays Fair Value Gaps (FVGs) from multiple timeframes simultaneously on your chart. FVGs are price gaps that occur when the market moves quickly and skips certain price levels. These gaps tend to be "filled" later and often serve as important support and resistance zones.
🎯 What are Fair Value Gaps?
A Fair Value Gap occurs when:
Bullish FVG: The current low is higher than the high from 2 candles ago (gap upward)
Bearish FVG: The current high is lower than the low from 2 candles ago (gap downward)
⏱️ Supported Timeframes:
1 Hour (1H)
2 Hours (2H)
3 Hours (3H)
4 Hours (4H)
1 Day (1D)
1 Week (1W)
🎨 Features:
✅ All timeframes visible simultaneously
✅ Each timeframe has its own color (bullish & bearish)
✅ Labels show the timeframe of each gap
✅ Automatic deletion when gap is filled
✅ Optional: MidPoint Fill (gap marked as filled at 50%)
✅ Extend right: Gaps extend to the right until filled
✅ All colors fully customizable
⚙️ Settings:
Timeframes: Enable/disable individual timeframes as needed
MidPoint Fill: Mark gap as filled when 50% is reached
Delete On Fill: Automatically remove filled gaps from chart
Label Timeframes: Show labels with timeframe names
Colors: Customize all colors to your preferences
💡 Application:
FVGs often serve as magnetic attraction points for price
Higher timeframe FVGs (4H, 1D, 1W) are typically more significant
Use FVGs as potential entry/exit zones
Combine with other indicators for better confirmation
📈 Recommended Use:
Works best on timeframes from 15min to 1H
Ideal for Forex, Crypto, and Stocks
Especially useful for Swing Trading and Day Trading
🔧 Technical Details:
Uses optimized request.security() calls (12 total, under the 40 limit)
Employs tuple syntax for efficient data fetching
Real-time gap detection and filling mechanism
Memory-efficient array management with var keyword

Aurora Reversal Suite: Liquidity & Inversion ModelConcept & Methodology The Aurora Reversal Suite is not a general-purpose indicator; it is a hard-coded algorithmic implementation of a specific institutional reversal model often referred to as the "2022 Mentorship Model" or "Sweep-to-Inversion" setup.
While many scripts display Liquidity Sweeps or Fair Value Gaps individually, this script solves the problem of "confluence fatigue" by algorithmically enforcing a strict order of operations. It does not alert on every sweep; it alerts only when a specific sequence of price action events occurs in a verified order.
The Algorithmic Logic (How it Works) The core value of this script lies in its conditional filtering logic, which automates the following manual verification process:
Event A: Liquidity Sweep
The script first monitors key institutional levels: Previous Day High/Low, Session High/Low (Asia/London/NY), and dynamic Swing Points.
It detects a "Sweep" event when price breaches a level but fails to close beyond it (or closes back inside within a defined lookback period).
Event B: Displacement & Inversion
Unlike standard FVG indicators, this script searches specifically for Inversion FVGs (iFVG) that form immediately following the sweep event.
The script logic requires that the iFVG be created by the displacement leg that reverses the sweep. This binds the "Entry Signal" directly to the "Liquidity Event."
Event C: Algorithmic Filtering (The "Strict" Mode)
To filter out false positives common in choppy markets, the script applies a multi-layer filter before printing a signal:
Volume Qualification: The signal bar's volume must exceed a user-defined multiple of the N-period average volume (default 1.5x) to confirm institutional participation.
SMT Divergence Filter: The script cross-references a correlated asset (e.g., NQ vs. ES or EU vs. DXY). If enabled, a signal is only valid if the correlated asset failed to make a matching high/low at the moment of the sweep (SMT Divergence).
Bias Alignment: The script calculates directional bias using a waterfall logic (Daily > 4H > 1H). Signals counter to this calculated bias are suppressed in "Strict" mode.
Included Features & Components
Automated Market Structure: Real-time labeling of BOS (Break of Structure) and MSS (Market Structure Shift) based on swing point logic.
Session Killzones: Visual boxes for Asia, London, and NY sessions with auto-extending high/low lines to track session liquidity.
Multi-Timeframe Dashboard: A calculated table displaying the trend state of the Daily, 4H, and 1H timeframes to assist with top-down analysis.
Power of 3 (PO3) Overlay: Visualization of higher-timeframe candle geometry on lower-timeframe charts to identify accumulation/distribution phases.
Why This Mashup is Necessary Attempting to trade this specific reversal model using separate indicators results in chart clutter and conflicting signals. By combining the Sweep detection, iFVG creation, and SMT filtering into a single codebase, we can programmatically eliminate "naked" sweeps that have no displacement, providing a cleaner and more objective view of the market structure.
Settings & Customization
Signal Mode: Choose between "Simple" (Price Action only) or "Strict" (Trend + Volume filtered).
SMT Input: Manually define the correlated asset ticker for divergence checks.
Visuals: Fully customizable colors for Bullish/Bearish scenarios to fit light or dark themes.
Disclaimer This script is a tool for market analysis and does not guarantee future results. It is intended to assist traders in identifying high-probability setups based on historical price action concepts.

JP7FX Signals ProJP7FX Signals Pro
Smart session signals based on structure, liquidity shifts and volatility filters.
Designed for use on the 1 minute timeframe.
What this tool does
This indicator builds signals around three things traders track every day.
• session ranges for Asia, Frankfurt, London and New York
• Fair Value Gap behaviour
• Supertrend shifts with volatility confirmation
The script draws each session range on your chart. It tracks when price breaks a session high or low, then checks if the market is above or below the daily open. These conditions help filter trades by direction during different sessions.
It also detects bullish and bearish Fair Value Gaps. The script tracks when an FVG forms, when price enters the imbalance and when it gets mitigated. These checks create part of the signal logic.
Supertrend is used as an extra filter. A crossover above or below the Supertrend gives a directional bias. When combined with session behaviour and FVG conditions, the script can mark possible long or short signals during London or New York.
How the signals form
A signal only prints when the script has all conditions in place.
This includes:
• a session range break in the correct direction
• a price position relative to the daily open
• confirmation from Supertrend
• FVG creation or mitigation on the right side of price
• liquidity taken in previous sessions
These rules reduce noise and avoid signals that appear in weak conditions.
What the indicator is for
• understanding how sessions behave on the 1 minute chart
• tracking liquidity behaviour
• seeing when a clean break and trend shift takes place
• getting notified when the market forms the conditions you set
This is not a buy or sell system on its own
Signals do not replace analysis. You still need market structure, higher timeframe direction, orderblocks or your own trade model.
A signal is only a prompt to look at the chart, not a confirmation to enter a trade.
Price can shift quickly around sessions, so check the context before acting on any alert.
Important notes
• designed for the 1 minute timeframe
• signals do not guarantee trend continuation
• conditions can form in strong or weak market phases
• use your own risk rules and validation before entering trades
JP7FX Signals Pro helps you track session behaviour and FVG interaction more efficiently, but trading decisions still need your full chart process.

FVG / Imbalance MTF Pro (4 HTFs + Alerts) - (@JP7FX)FVG / Imbalance MTF Pro (@JP7FX)
This indicator finds and plots Fair Value Gaps across up to four higher timeframes on a single chart. It shows them as lines, zones, 50 percent levels and labels, and can fire alerts when new gaps form or when price mitigates them.
Core logic
The script detects bullish and bearish FVGs using the classic three candle logic:
• Bullish FVG when high is below the current low.
• Bearish FVG when low is above the current high.
All logic runs on the selected higher timeframes through request.security, then projects the zones down onto your current chart timeframe. The script also checks that your chart timeframe is equal to or lower than the selected HTFs so the plots stay meaningful.
Multi timeframe control
You can configure up to four separate FVG layers: TF1, TF2, TF3 and TF4.
For each TF you can choose:
• Timeframe (or link it to the chart).
• Display mode, Lines and Zones, Zones Only, Lines Only, or Disable.
• Whether to show the 50 percent line.
• Whether to show a label with the TF name next to each FVG.
Inputs also convert the timeframe into minutes and hours so labels can show clear tags such as “15m”, “1h” and so on.
Visuals per timeframe
For every timeframe you can set:
• Entry and stop FVG line colours.
• 50 percent line colour and line style.
• Bullish and bearish zone fill colours.
• Separate colours for mitigated bullish and mitigated bearish zones.
• Label text colours for demand and supply.
Each FVG can draw:
• Two lines for the “entry” and “stop” edges of the gap.
• An optional 50 percent line through the zone.
• A shaded box that tracks the zone as price trades into it.
• A label that shows the originating timeframe.
Line and zone behaviour
Global settings let you control:
• Maximum number of FVG lines and zones kept on the chart.
• Line style for FVG edges and 50 percent lines.
• Whether lines and zones extend to the right.
• Whether zones update with price movement as price trades deeper.
• Whether the zone colour changes once the FVG has been mitigated.
• Label offset so you can push the TF labels to the right of price.
• An option to avoid overlapping zones per timeframe by checking for box overlap.
The script uses arrays of lines, boxes and labels for each TF and for demand and supply separately. It removes the oldest objects once the max count is hit and deletes or recolours zones when price reaches them.
Bar colouring
You can optionally colour the bar that creates the chart timeframe FVG.
• Bullish FVG origin bar can show as green.
• Bearish FVG origin bar can show as red.
Alerts
The indicator exposes alertcondition signals for both creation and mitigation. For each timeframe it supports:
• FVG zone created, bullish or bearish.
• Bullish FVG mitigated.
• Bearish FVG mitigated.
You choose the alert pack per TF through the inputs, then set the alert from the chart by right clicking the indicator and adding an alert.
Use case
This tool is for traders who map and trade Fair Value Gaps across multiple higher timeframes and want clean, configurable MTF FVG zones with clear labels, mitigation behaviour and alerts all in one script.

FVG Tracker Pro (@JP7FX)FVG Tracker Pro (JP7FX)
FVG Tracker Pro monitors single timeframe Fair Value Gaps and tracks their behaviour over time. It shows when an FVG forms, when it closes and which candle completes the mitigation.
Features
• Tracks old FVGs so users can review how price interacted with previous gaps.
• Highlights when an FVG is fully mitigated and identifies the closing candle.
• Alerts for new FVG creation and FVG mitigation.
• Optional bar colours, visibility filters and 50 percent lines.
• Works on any asset and timeframe.
How It Helps
• Allows users to follow the lifecycle of each FVG.
• Reduces manual work by marking creation and mitigation automatically.
• Helps traders who study Smart Money concepts and price inefficiencies.
Alerts
Alert conditions are included for:
• New FVG creation
• Full mitigation of an FVG
Users can tailor alert settings to match their preference.

FVG Matrix - Orderblock, Expansion & Rejection(@JP7FX)FVG Matrix (JP7FX)
FVG Matrix detects and displays multiple types of Fair Value Gaps. It gives traders a clear view of imbalance behaviour without manual marking.
FVG Types
The indicator identifies five categories of FVGs:
• Standard FVGs
Three candle price inefficiencies.
• Orderblock FVGs
Gaps that form near orderblocks.
• Expansion FVGs
Imbalances created during strong impulsive moves.
• Consolidation FVGs
Gaps within tight ranges.
• Rejection FVGs
Gaps that show rejection behaviour when price returns.
Each type can be enabled, disabled or recoloured.
Features
• Multi type FVG detection across all timeframes.
• 50 percent mitigation tracking to show partial fills.
• Alerts for FVG creation and mitigation.
• Control over whether mitigated FVGs remain on the chart.
• Full colour and visibility customisation.
Alerts
The indicator includes alert conditions for new FVG creation and FVG mitigation.
Users can choose which FVG types trigger alerts.
Use Cases
Suitable for traders who track imbalance behaviour or follow Smart Money concepts. The indicator reduces chart work by automating the identification and organisation of Fair Value Gaps.

Obsidian Flux Matrix# Obsidian Flux Matrix | JackOfAllTrades
Made with my Senior Level AI Pine Script v6 coding bot for the community!
Narrative Overview
Obsidian Flux Matrix (OFM) is an open-source Pine Script v6 study that fuses social sentiment, higher timeframe trend bias, fair-value-gap detection, liquidity raids, VWAP gravitation, session profiling, and a diagnostic HUD. The layout keeps the obsidian palette so critical overlays stay readable without overwhelming a price chart.
Purpose & Scope
OFM focuses on actionable structure rather than marketing claims. It documents every driver that powers its confluence engine so reviewers understand what triggers each visual.
Core Analytical Pillars
1. Social Pulse Engine
Sentiment Webhook Feed: Accepts normalized scores (-1 to +1). Signals only arm when the EMA-smoothed value exceeds the `sentimentMin` input (0.35 by default).
Volume Confirmation: Requires local volume > 30-bar average × `volSpikeMult` (default 2.0) before sentiment flags.
EMA Cross Validation: Fast EMA 8 crossing above/below slow EMA 21 keeps momentum aligned with flow.
Momentum Alignment: Multi-timeframe momentum composite must agree (positive for longs, negative for shorts).
2. Peer Momentum Heatmap
Multi-Timeframe Blend: RSI + Stoch RSI fetched via request.security() on 1H/4H/1D by default.
Composite Scoring: Each timeframe votes +1/-1/0; totals are clamped between -3 and +3.
Intraday Readability: Configurable band thickness (1-5) so scalpers see context without losing space.
Dynamic Opacity: Stronger agreement boosts column opacity for quick bias checks.
3. Trend & Displacement Framework
Dual EMA Ribbon: Cyan/magenta ribbon highlights immediate posture.
HTF Bias: A higher-timeframe EMA (default 55 on 4H) sets macro direction.
Displacement Score: Body-to-ATR ratio (>1.4 default) detects impulses that seed FVGs or VWAP raids.
ATR Normalization: All thresholds float with volatility so the study adapts to assets and regimes.
4. Intelligent Fair Value Gap (FVG) System
Gap Detection: Three-candle logic (bullish: low > high ; bearish: high < low ) with ATR-sized minimums (0.15 × ATR default).
Overlap Prevention: Price-range checks stop redundant boxes.
Spacing Control: `fvgMinSpacing` (default 5) avoids stacking from the same impulse.
Storage Caps: Max three FVGs per side unless the user widens the limit.
Session Awareness: Kill zone filters keep taps focused on London/NY if desired.
Auto Cleanup: Boxes delete when price closes beyond their invalidation level.
5. VWAP Magnet + Liquidity Raid Engine
Session or Rolling VWAP: Toggle resets to match intraday or rolling preferences.
Equal High/Low Scanner: Looks back 20 bars by default for liquidity pools.
Displacement Filter: ATR multiplier ensures raids represent genuine liquidity sweeps.
Mean Reversion Focus: Signals fire when price displaces back toward VWAP following a raid.
6. Session Range Breakout System
Initial Balance Tracking: First N bars (15 default) define the session box.
Breakout Logic: Requires simultaneous liquidity spikes, nearby FVG activity, and supportive momentum.
Z-Score Volume Filter: >1.5σ by default to filter noisy moves.
7. Lifestyle Liquidity Scanner
Volume Z-Scores: 50-bar baseline highlights statistically significant spikes.
Smart Money Footprints: Bottom-of-chart squares color-code buy vs sell participation.
Panel Memory: HUD logs the last five raid timestamps, direction, and normalized size.
8. Risk Matrix & Diagnostic HUD
HUD Structure: Table in the top-right summarizes HTF bias, sentiment, momentum, range state, liquidity memory, and current risk references.
Signal Tags: Aggregates SPS, FVG, VWAP, Range, and Liquidity states into a compact string.
Risk Metrics: Swing-based stops (5-bar lookback) + ATR targets (1.5× default) keep risk transparent.
Signal Families & Alerts
Social Pulse (SPS): Volume-confirmed sentiment alignment; triangle markers with “SPS”.
Kill-Zone FVG: Session + HTF alignment + FVG tap; arrow markers plus SL/TP labels.
Local FVG: Captures local reversals when HTF bias has not flipped yet.
VWAP Raid: Equal-high/low raids that snap toward VWAP; “VWAP” label markers.
Range Breakout: Initial balance violations with liquidity and imbalance confirmation; circle markers.
Liquidity Spike: Z-score spikes ≥ threshold; square markers along the baseline.
Visual Design & Customization
Theme Palette: Primary background RGB (12,6,24). Accent shading RGB (26,10,48). Long accents RGB (88,174,255). Short accents RGB (219,109,255).
Stylized Candles: Optional overlay using theme colors.
Signal Toggles: Independently enable markers, heatmap, and diagnostics.
Label Spacing: Auto-spacing enforces ≥4-bar gaps to prevent text overlap.
Customization & Workflow Notes
Adjust ATR/FVG thresholds when volatility shifts.
Re-anchor sentiment to your webhook cadence; EMA smoothing (default 5) dampens noise.
Reposition the HUD by editing the `table.new` coordinates.
Use multiples of the chart timeframe for HTF requests to minimize load.
Session inputs accept exchange-local time; align them to your market.
Performance & Compliance
Pure Pine v6: Single-line statements, no `lookahead_on`.
Resource Safe: Arrays trimmed, boxes limited, `request.security` cached.
Repaint Awareness: Signals confirm on close; alerts mirror on-chart logic.
Runtime Safety: Arrays/loops guard against `na`.
Use Cases
Measure when social sentiment aligns with structure.
Plan ICT-style intraday rebalances around session-specific FVG taps.
Fade VWAP raids when displacement shows exhaustion.
Watch initial balance breaks backed by statistical volume.
Keep risk/target references anchored in ATR logic.
Signal Logic Snapshot
Social Pulse Long/Short: `sentimentEMA` gated by `sentimentMin`, `volSpike`, EMA 8/21 cross, and `momoComposite` sign agreement. Keeps hype tied to structural follow-through.
Kill-Zone FVG Long/Short: Requires session filter, HTF EMA bias alignment, and an active FVG tap (`bullFvgTap` / `bearFvgTap`). Labels include swing stops + ATR targets pulled from `swingLookback` and `liqTargetMultiple`.
Local FVG Long/Short: Uses `localBullish` / `localBearish` heuristics (EMA slope, displacement, sequential closes) to surface intraday reversals even when HTF bias has not flipped.
VWAP Raids: Detect equal-high/equal-low sweeps (`raidHigh`, `raidLow`) that revert toward `sessionVwap` or rolling VWAP when displacement exceeds `vwapAlertDisplace`.
Range Breakouts: Combine `rangeComplete`, breakout confirmation, liquidity spikes, and nearby FVG activity for statistically backed initial balance breaks.
Liquidity Spikes: Volume Z-score > `zScoreThreshold` logs direction, size, and timestamp for the HUD and optional review workflows.
Session Logic & VWAP Handling
Kill zone + NY session inputs use TradingView’s session strings; `f_inSession()` drives both visual shading and whether FVG taps are tradeable when `killZoneOnly` is true.
Session VWAP resets using cumulative price × volume sums that restart when the daily timestamp changes; rolling VWAP falls back to `ta.vwap(hlc3)` for instruments where daily resets are less relevant.
Initial balance box (`rangeBars` input) locks once complete, extends forward, and stays on chart to contextualize later liquidity raids or breakouts.
Parameter Reference
Trend: `emaFastLen`, `emaSlowLen`, `htfResolution`, `htfEmaLen`, `showEmaRibbon`, `showHtfBiasLine`.
Momentum: `tf1`, `tf2`, `tf3`, `rsiLen`, `stochLen`, `stochSmooth`, `heatmapHeight`.
Volume/Liquidity: `volLookback`, `volSpikeMult`, `zScoreLen`, `zScoreThreshold`, `equalLookback`.
VWAP & Sessions: `vwapMode`, `showVwapLine`, `vwapAlertDisplace`, `killSession`, `nySession`, `showSessionShade`, `rangeBars`.
FVG/Risk: `fvgMinTicks`, `fvgLookback`, `fvgMinSpacing`, `killZoneOnly`, `liqTargetMultiple`, `swingLookback`.
Visualization Toggles: `showSignalMarkers`, `showHeatmapBand`, `showInfoPanel`, `showStylizedCandles`.
Workflow Recipes
Kill-Zone Continuation: During the defined kill session, look for `killFvgLong` or `killFvgShort` arrows that line up with `sentimentValid` and positive `momoComposite`. Use the HUD’s risk readout to confirm SL/TP distances before entering.
VWAP Raid Fade: Outside kill zone, track `raidToVwapLong/Short`. Confirm the candle body exceeds the displacement multiplier, and price crosses back toward VWAP before considering reversions.
Range Break Monitor: After the initial balance locks, mark `rangeBreakLong/Short` circles only when the momentum band is >0 or <0 respectively and a fresh FVG box sits near price.
Liquidity Spike Review: When the HUD shows “Liquidity” timestamps, hover the plotted squares at chart bottom to see whether spikes were buy/sell oriented and if local FVGs formed immediately after.
Metadata
Author: officialjackofalltrades
Platform: TradingView (Pine Script v6)
Category: Sentiment + Liquidity Intelligence
Hope you Enjoy!

ICT Asian & London Range + First Presented FVGIndicator: ICT Sessions + First Presented FVG
What it does: This tool automates the markup of key ICT (Inner Circle Trader) timeframes and entry signals. It allows you to trade on higher timeframes (like the 5m or 15m) while the script automatically "looks inside" the 1-minute chart to find specific setups for you.
Key Features:
Session Ranges (Asian & London)
Automatically highlights the Asian Session (8 PM - Midnight NY) and London Open (2 AM - 5 AM NY).
Draws a shaded box for the session's High and Low.
New: Extends the High and Low lines to 4:00 PM NY (end of the trading day) so you can use them as liquidity targets.
The "First Presented" FVG (Sniper Logic)
It detects the very first Fair Value Gap (FVG) that forms on the 1-minute chart immediately after a session starts.
It draws this 1-minute gap on your current chart, regardless of what timeframe you are viewing.
The FVG box automatically extends to the end of the trading day (4 PM NY), showing you where price might return to "mitigate" or react later in the day.
