Smart Money Accumulating BDL — Are You Watching This Setup?Hello Traders!
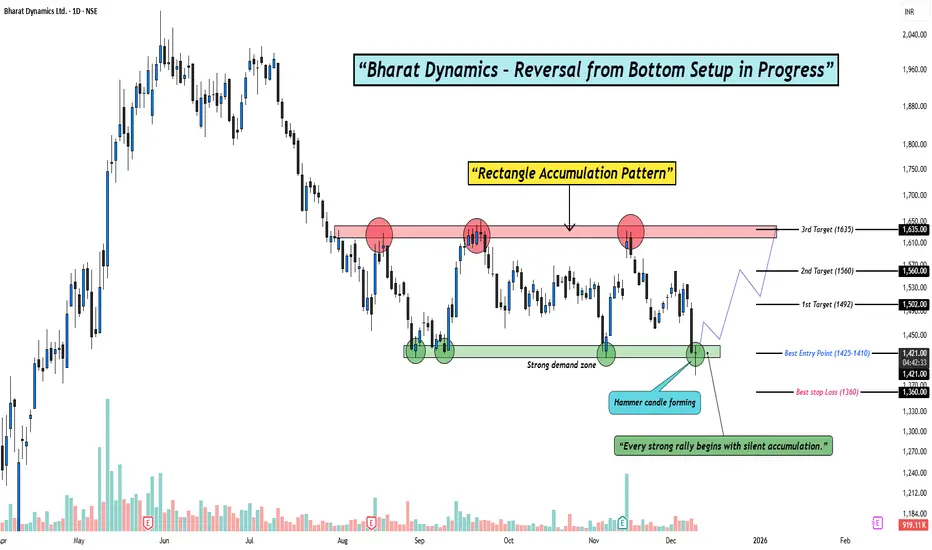
Today’s analysis is on Bharat Dynamics Ltd. (BDL) where a clear Reversal from Bottom Setup is developing. After weeks of sideways consolidation, the stock has formed a clean Rectangle Accumulation Pattern right above a strong demand zone. The latest Hammer candle appearing inside this zone adds strong confirmation that buyers are stepping in again.
Why this setup is special?
Multiple rejections from supply and repeated buying from demand create a classic accumulation range.
The recent hammer candle shows rejection of lower prices and signals potential reversal strength.
Sideways accumulation after a downtrend often leads to strong breakout rallies when demand overpowers supply.
Levels to Track:
The best entry zone lies between 1425–1410, aligning perfectly with demand. As long as price stays above 1360, the structure remains intact. On the upside, the first target sits near 1492, followed by 1560, and finally a breakout extension target around 1635, where previous supply reacts strongly.
Rahul’s Tip:
Every strong rally begins with silent accumulation. Patterns like this look slow at first, but once the breakout hits, momentum often surprises traders who were waiting too long.
(Analysis By @TraderRahulPal | More analysis & educational content on my profile. If this helped you, don’t forget to like and follow for regular updates.)
Disclaimer:
This analysis is for educational purposes only and should not be taken as financial advice. Please do your own research or consult your financial advisor before investing.
Community ideas
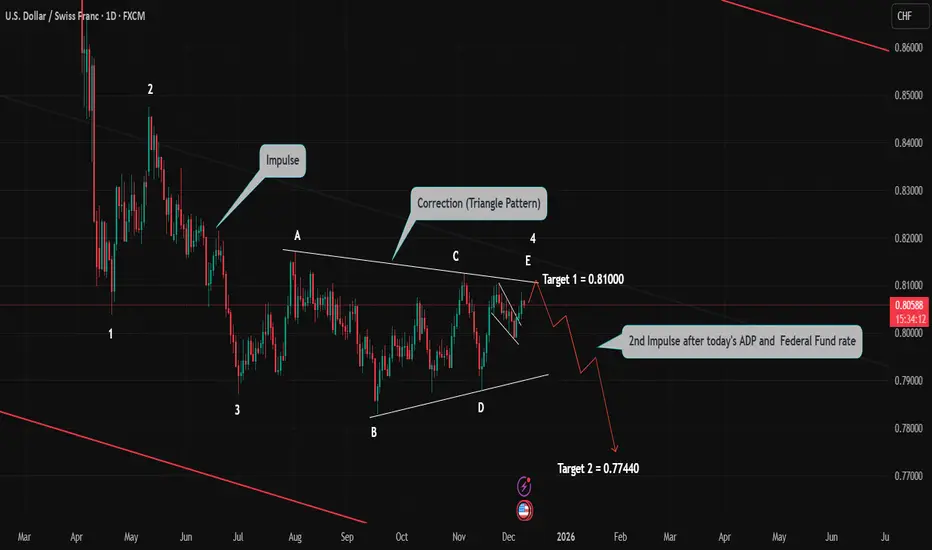
USD/CHF in Daily time frameBy Wave Analysis, Initial move to little upside for the target1 mentioned in the chart. Once the "E" wave of Triangle pattern completed, then strong impulse of downside to Target 2 is expected.
Technically the pattern is ready for big move, but fundamentally ADP and Federal fund's rate will decide the direction. If both are in alignment then perfect move of downside is expected. Or else change in structure is possible.
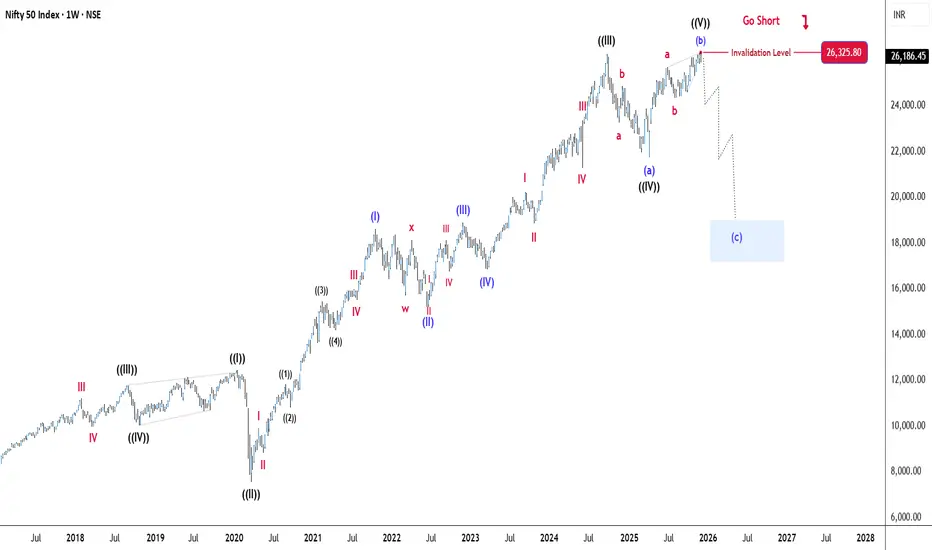
Nifty 50 - Elliott Wave Weekly AnalysisNifty 50 Now in correction face of Grand super cycle . Already Wave A and B Completed. C wave starts now (forming Expanded / Irregular Flat) end up to Fib extension of 1.618% wave A, B or Retrace 38.2% of Motive wave 2,3 so expected for correction in nifty 50 through Elliott wave theory so investors proper hedge your position or go short in FNO and big buying opportunity is coming soon...
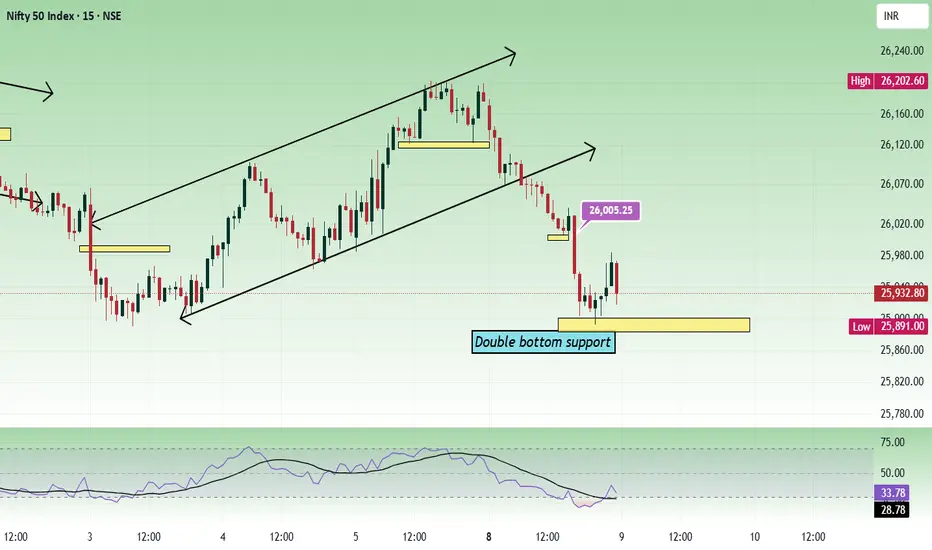
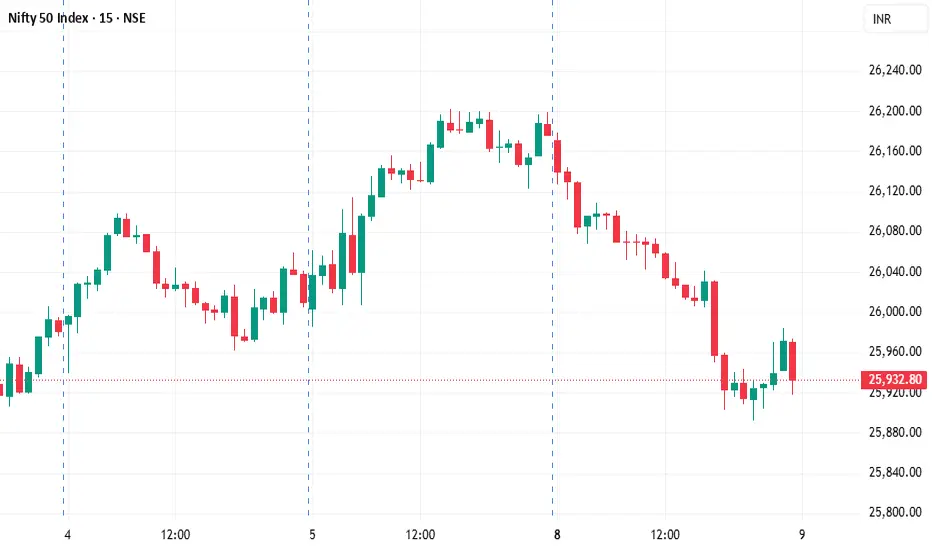
Nifty - Expiry day analysis Dec 9The price broke the channel and fall down towards the double bottom support at the 25900 zone. The price can move in this range 25800 to 26200 as per the higher(daily) and lower(15 minutes) chart analysis.
As per the daily chart, we can see a strong support at the 25850 zone.
Buy above 25900 with the stop loss of 25840 for the targets 25940, 25980, 26020, 26100, 26160 and 26200.
Sell below 25780 with the stop loss of 25840 for the targets 25740, 25700, 25640, 25600 and 25540.
Expected expiry day range is 25700 to 26100.
Always do your analysis before taking any trade.
Order Blocks & Smart Money Concepts (SMC)1. Understanding Smart Money vs. Retail Money
Retail traders usually trade based on indicators—RSI, MACD, moving averages—and often enter late or exit early. But institutions (smart money) cannot enter the market with huge volume suddenly. They need liquidity to fill their orders. So smart money:
Creates liquidity pools
Traps retail traders
Pushes price into zones where their orders are waiting
SMC tries to decode this behavior and trade with institutional flow.
The core belief of SMC is:
Price moves from liquidity to liquidity and respects institutional footprints like Order Blocks.
2. What Are Order Blocks?
Order Blocks (OBs) are the final candles where institutional buying or selling took place before a major price move. These candles reflect zones where big players opened positions.
Types of Order Blocks
Bullish Order Block
The last down candle before an impulsive up move (break of structure).
It shows smart money was buying.
Bearish Order Block
The last up candle before an impulsive down move.
It shows smart money was selling.
Why Order Blocks Matter
They represent areas where institutions left unfilled orders.
Price often returns (mitigation) to these areas before continuing in the original direction.
They provide high-probability entry zones with low stop-loss.
Characteristics of a Good Order Block
Strong displacement afterwards (fast, impulsive move)
Break of key market structure
Alignment with liquidity (e.g., sweep before displacement)
Imbalance or Fair Value Gap nearby
Higher timeframe confluence
3. Market Structure in SMC
SMC is heavily based on market structure: identifying the direction of the trend using swing highs and swing lows.
3.1 BOS – Break of Structure
A BOS occurs when price breaks a previous major swing high/low. It confirms trend continuation.
3.2 CHoCH – Change of Character
A CHoCH signals a trend reversal.
Example: In an uptrend, price forms a lower low → CHoCH → possible new downtrend.
Why Structure Matters
Order Blocks are validated only when a BOS or CHoCH occurs after them.
This proves smart money was indeed behind the move.
4. Liquidity in SMC
Liquidity is fuel for price movement. Smart money seeks liquidity to enter and exit positions.
Types of Liquidity
Equal Highs / Equal Lows (Double Tops/Bottoms)
Retail traders place stop orders here → liquidity pools.
Trendline Liquidity
Too-perfect trendlines attract breakout traders.
Buy/Sell Stops
Stops placed above highs or below lows are markets for institutional orders.
Imbalance / FVG Liquidity
Price returns to fill gaps to balance orders.
Liquidity Principle
“Price takes liquidity before reversing.”
This is where Order Blocks come into play—after grabbing liquidity, price mitigates an OB and then continues.
5. Fair Value Gaps (FVG) and Imbalances
An imbalance occurs when price moves so fast that there is insufficient trading between three candles (Candle A, B, C).
These gaps often get filled because smart money needs balanced positions.
FVGs often appear near:
Valid Order Blocks
Breaker Blocks
Mitigation Blocks
When price returns to these gaps, it becomes a high-probability entry.
6. Inducement: Retail Traps Before Real Move
Inducement is a clever liquidity trick used by institutions.
Example:
Price forms a small high near a bigger liquidity zone.
Retail traders enter early.
Smart money uses these small highs/lows as liquidity to tap, then moves to the real target.
Inducements typically appear:
Just before hitting an Order Block
Above equal highs
Below recent swing points
Understanding inducement helps avoid premature entries.
7. Mitigation: Why Price Revisits Order Blocks
After smart money enters the market with heavy orders, not all positions fill immediately.
So they bring price back to the order block to fill remaining orders.
This return is called mitigation.
Mitigation Concepts
Price taps the OB, grabs liquidity, and continues in the main direction.
It removes institutional drawdown.
It confirms OB validity.
A successful mitigation is one of the strongest signals for trend continuation setups.
8. How to Trade With Order Blocks (SMC Strategy)
Below is a simplified but effective approach:
Step 1: Determine Market Direction
Use BOS and CHoCH to identify trend or reversal.
Uptrend → focus on Bullish Order Blocks
Downtrend → focus on Bearish Order Blocks
Step 2: Mark High-Probability Order Blocks
Select Order Blocks that have:
Strong displacement
BOS confirmation
Nearby liquidity sweep (e.g., equal highs taken)
Nearby FVG (imbalance)
Step 3: Wait for Price to Return
Patience is key. Price almost always returns to OB for mitigation.
Place Buy Limit at Bullish OB
Place Sell Limit at Bearish OB
Step 4: Stop-Loss and Take-Profit
SL: Below OB (for bullish), Above OB (for bearish)
TP Levels:
Next liquidity pool
Opposite OB
FVG fill
This ensures positive risk-reward ratios (1:3 or higher).
9. Example: Bullish Order Block Workflow
Price sweeps liquidity below equal lows.
A strong bullish move creates displacement.
A BOS confirms institutional strength.
Identify the last down candle (bullish OB).
Price returns and mitigates OB.
Enter long position.
Target next liquidity pool above.
This is considered a textbook SMC setup.
10. Limitations of SMC
Although powerful, SMC requires practice.
Challenges
Order Blocks appear frequently; choosing the wrong one is common.
Market structure can be subjective for beginners.
Liquidity grabs may fake out traders.
News events disrupt SMC setups.
SMC should always be combined with:
Timeframe confluence
Session timing (London/NY sessions are best)
Risk management rules
11. Why SMC Works
SMC aligns with institutional behavior, making it uniquely accurate for:
Understanding market manipulation
Identifying highly precise entries
Reducing drawdown
Avoiding false breakouts
Trading with low risk, high return
Institutions leave traces—Order Blocks, FVGs, BOS, inducements.
SMC helps retail traders read these footprints.
Conclusion
Order Blocks & Smart Money Concepts (SMC) form a powerful trading framework focused on understanding institutional behavior. By studying liquidity, market structure, BOS, CHoCH, FVG, and mitigation, traders can read the true intention behind major price movements. Order Blocks act as the foundation of SMC, giving precise, low-risk entries aligned with smart money flow. With discipline, patience, and multi-timeframe confluence, SMC becomes one of the most effective and accurate price-action trading methods available today.
Nifty 1H Elliott Wave Analysis Nifty 1H trend is Bearish - Ending Diagonal 5 Waves Completed and break channel pattern then C wave grand super cycle degree is started now c1,c2 in completed (cycle degree) c3 running expected target 1.618 to 2.618 of Fib level So correction is going don't go long protect your position in proper hedging or go short

Nifty 16th Dec Expiry OutlookMulti-Timeframe Analysis: Rounded Top Completion Into Monthly Channel Support
Structure: Distribution on lower timeframes aligning with higher-timeframe trend support
Bias: Short-term corrective → Medium-term bullish continuation
Key Zone: 25,550–25,600 (multi-timeframe confluence)
1. Higher-Timeframe Context (Weekly & Monthly)
Nifty remains inside a multi-year rising parallel channel, with price currently trading in the upper half of the structure. The lower boundary of this monthly channel now intersects directly with the 25,550–25,600 zone, creating a major confluence level.
Key observations:
- The higher-timeframe trend is intact and bullish.
- Market is undergoing a controlled correction within the channel, not a structural reversal.
- This zone has historically acted as a “trend guardian”—every meaningful correction in the past two years has reacted sharply from these channel boundaries.
Implication:
A deeper dip into the monthly channel support is healthy and expected before Nifty attempts another leg higher toward 26,300 → 26,800+.
2. Mid-Timeframe Structure (Daily)
Daily chart shows:
- Failure at the 26,200–26,300 supply zone (multiple rejections)
- A shift from HH → LH, confirming momentum exhaustion
- Breakdown from the rising micro-channel
- Volume tapering on the right side of the structure, consistent with distribution
- Price accelerating toward the next liquidity pocket at 25,650–25,700
The daily structure is now in a corrective downswing, not a trend reversal.
3. Lower-Timeframe Breakdown (1-Hour)
The 1H timeframe gives the clearest picture of immediate price action:
✔ Rounded Top / Curve Distribution
Nifty has formed a 3-week rounded top, with:
- Progressive lower highs
- Exhaustion near 26,300
- Failed retests of intraday resistance
- A clean Break of Structure (BOS) below the rising trendline
- Retests turning into supply
This is a textbook distribution phase unfolding beneath higher-timeframe resistance.
✔ Liquidity Zones & Demand Clusters
Three major intraday demand pockets lie at:
25,780 – 25,820
25,650 – 25,700
25,520 – 25,580 ← major confluence zone
These zones align with:
- Previous swing lows
- Breaker blocks
- Volume nodes
- Bollinger lower bands
- FIB 0.382–0.5 retracements
- Monthly parallel channel support
This creates a high-probability reaction zone.
4. Multi-Timeframe Confluence Zone (The Most Important Part)
The convergence of:
- Monthly parallel channel support
- Rounded top target completion
- Intraday liquidity clusters
- Higher-timeframe HL structure
- Daily retracement zones
- Volume profile support
all occurs between:
⭐ 25,550 – 25,600
This is the likely end of correction and start of reversal zone.
Markets rarely give this kind of alignment across 1H, Daily, Weekly, and Monthly at the same price level. When they do, the reaction is usually sharp.
5. Expected Path (Probabilistic Outlook)
Based on structure, order flow, and confluence:
🔻 Phase 1 — Ongoing (High Probability)
A grind lower within the rounded top curve:
Sideways → LH → weak bounce → continuation down.
Targets:
✔ 25,780 → 25,700 → 25,600
🔻 Phase 2 — Final Sweep (Moderate Probability)
A liquidity wick into 25,550–25,580 to collect stops.
🟩 Phase 3 — Reversal (High Probability)
Strong reaction from the monthly channel support zone.
Likely targets:
25,950
26,100
26,200
26,300+
Once the structure reclaims 26,200, Nifty can attempt an ATH push.
6. Invalidation Levels
The bullish continuation thesis is invalidated only if:
Nifty closes below 25,450 on a daily basis
→ This would break the monthly channel and shift the trend.
As long as 25,450 holds, dips into demand remain buying opportunities, not trend breaks.
Conclusion
Nifty is completing a rounded top distribution on the 1H chart, targeting demand zones between 25,700–25,600. This aligns perfectly with the monthly parallel channel support, creating a rare multi-timeframe confluence zone.
Expect a slow corrective drift, followed by a significant bullish reversal from 25,550–25,600. This correction is a healthy reset before Nifty attempts the next leg higher toward 26,300+ and potentially new highs.

Bitcoin Bybit chart analysis December 8Hello
It's a Bitcoin Guide.
If you "follow"
You can receive real-time movement paths and comment notifications on major sections.
If my analysis was helpful,
Please click the booster button at the bottom.
Here's a 30-minute Bitcoin chart.
There are no separate indicators released today.
I've developed a long position strategy based on Nasdaq movements.
*Conditional long position strategy based on the red finger movement path.
- If the price touches the top once or twice and rebounds within the purple support line, it's a vertical rise.
1. If the price falls immediately without touching the top once, the lower level is $91,308.2, the entry point for a long position. / If the green support line is broken, the stop-loss price is $91,308.2.
2. $93,432.7, the first target price for a long position -> the top is the second target price.
If the strategy is successful, $92,961.4 is the point at which to re-enter a long position.
If the price reaches the top before the 9:00 AM candlestick tomorrow, you can enter a short position and then wait for a long position. (Bollinger Band daily chart resistance zone)
The green support line held tight,
but after breaking out, it opened to the bottom, reaching 3 levels.
Please note that my analysis is for reference only.
I hope you will operate safely, with a focus on principled trading and stop-loss orders.
Thank you.

Gold sell target as per your return you want so im selling this selling gold right away so can get some targets
becuase its pre LDN sell off so taking a 1.5% risk of capital

Nifty Short term view from December, 2025 to March/April 2026Wrap up:-
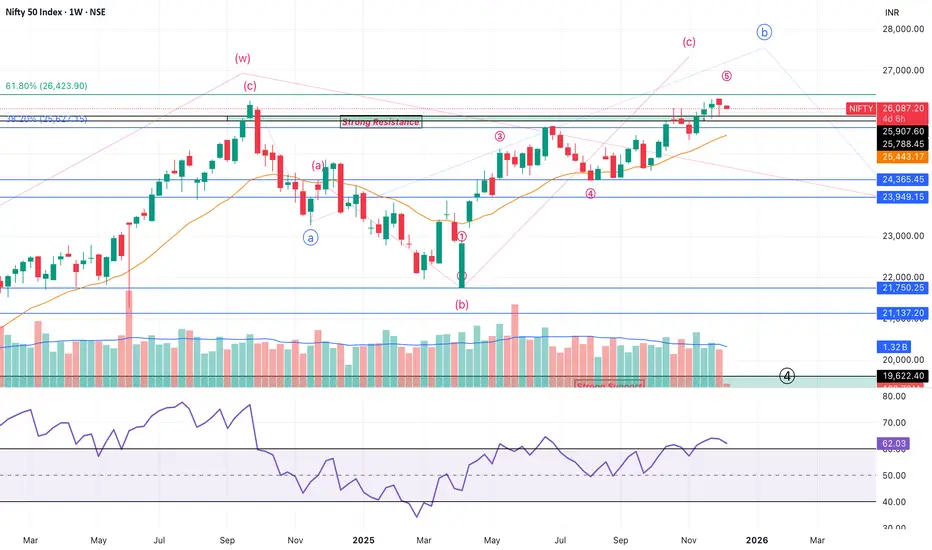
After breaking ATH, Wave X of Nifty has been shifted further and whole of the pattern has been changed. Now, wave w of major wave X is treated as completed at 26277 and wave x of Major wave X is running of which wave a of x of X was completed at 23263 and wave b of x of X is running. Internal wave b of wave b of x of X is completed at 21743 and heading towards wave c.
Min. projection of final wave 5 of internal wave c is achieved at 25627 and heading towards its second target 26423. Final target can be found from its internal wave 5 in lower time frame.
Expectation:- Wave 5 is expected to be completed in Dec, 2025 or Mid of January, 2026 and thereafter, correction in Nifty starts from Mid January, 2026 to March/April 2026.
Disclaimer: Sharing my personal market view — only for educational purpose not financial advice.
NIFTY Levels for TodayHere are the NIFTY's Levels for intraday (in the image below) today. Based on market movement, these levels can act as support, resistance or both.
Please consider these levels only if there is movement in index and 15m candle sustains at the given levels. The SL (Stop loss) for each BUY trade should be the previous RED candle below the given level. Similarly, the SL (Stop loss) for each SELL trade should be the previous GREEN candle above the given level.
Note: This idea and these levels are only for learning and educational purpose.
Your likes and boosts gives us motivation for continued learning and support.
Why People Don’t Believe in Compounding Until It’s Too Late?Hello Traders!
Compounding is the most powerful wealth-building force in finance, and yet, most people ignore it.
Not because it doesn’t work, but because it works slowly in the beginning and too fast later.
By the time people realize how powerful compounding really is, they’ve already lost years they can never get back.
Let’s break down why this happens and what you can learn from it.
1. Compounding Looks Boring in the Beginning
In the first few years, compounding feels slow, almost invisible.
You invest, wait, and see very small growth, so people lose interest.
But compounding is like planting a tree: nothing happens for a long time… then everything happens at once.
Early years test your patience. Later years reward it.
2. People Want Fast Results, Not Slow Success
Most traders and investors chase quick profits, because excitement feels better than discipline.
Compounding requires consistency, which feels “boring” compared to high-risk trades.
This impatience makes people break the process before results can appear.
Compounding is slow at first, but permanent later.
3. The Growth Is Invisible Until It Explodes
Compounding does almost nothing for years, then suddenly grows exponentially.
By the time people understand how powerful it is, they’re already 10–15 years behind.
This is why older investors say, “I wish I started earlier.”
The curve is flat… until it goes vertical.
4. Lack of Discipline Breaks the Magic
Skipping contributions here and there reduces future growth dramatically.
Touching invested money destroys compounding momentum.
Consistency, not intelligence, creates compounding returns.
You don’t need to be brilliant. You need to be consistent.
5. People Underestimate Time More Than Money
You can always earn more money, but you can’t earn more time.
The earlier you start, the stronger compounding becomes.
A 25-year-old investing small amounts beats a 40-year-old investing large amounts.
Time is the real multiplier.
Rahul’s Tip:
Compounding doesn’t reward the smartest or richest.
It rewards the most patient.
If you start early, stay consistent, and let time do the heavy lifting, your future wealth becomes unavoidable.
Conclusion:
People don’t believe in compounding because it doesn’t give instant gratification.
But the moment they understand how powerful exponential growth truly is, it’s usually too late.
Start early. Stay patient. Let years, not emotions, build your wealth.
If this post shifted your mindset about long-term investing, like it, comment your thoughts, and follow for more clarity-focused finance lessons!
Nifty 50 Price Structure Analysis [09/12/2025: Tuesday] Top-Down Nifty 50 price structure analysis for 09th December 2025. The day is Tuesday.
(1) Monthly Time Frame:
Red indecisive candle. Major resistance is at level 26100. Minor support is at level 25900. The view is indecisive to bearish.
(2) Weekly Time Frame:
First day of the week. Today's red candle confirms that last week's red paper umbrella was a hanging man. Clear sign of trend reversal. Major resistance is at level 26100. Minor support is at level 25900. The view is bearish.
(3) Daily Time Frame:
It's kind of a red morubozu with a minor 50 points lower wick. The candle engulfed the last 2 days of green candles. A major resistance zone is formed at the levels 26100 - 26000. Minor support is at level 25900. The view is bearish.
(4) 30-Minute Time Frame:
Two trend reversal patterns are observed. The first pattern is head & shoulder (H&S). The second pattern is a triple top. It's a clear sign of trend reversal. The neck of both the H&S and triple top is formed at the level 25900. A major resistance zone is formed at the zone 26100 - 26000. Minor support is at level 25900. Every up move should be doubted. The view is bearish.
Events:
Nifty 50 weekly expiry. No other high-impact event. However, a major event is on 12 December - the FED interest rate decision. Thus, volatility is expected.
Bullish Scenario Set-Up:
(i) Price sustains above the opening price.
(ii) Price sustains above the level 26100.
Bearish Scenario Set-Up:
(i) Price sustains below the opening price.
(ii) Price sustains below the level 25900 and shows promise of breaking below the level 25850.
(iii) Bearish target is in the zone (25750 - 25700)
Expectations (Hypothesis and Insights from the Trading Plan):
(i) Take a bearish position only. Price must break the level 25900 and show promise of trading below the level 25850.
(ii) Doubt every up move.
(iii) Take no bullish trade until the price starts to trade above the level 26000 - 26100.
(iv) There is a higher probability of breaking down (bearish trend continuation).
(v) After price breaks below the level 25850, there is a higher chance that the price will try to fill the gap in the zone 25750 - 25700.
(vi) Its expiry day. So, expect uncertain price movement in the second half.
(vii) It may happen that bulls might try to expire price above the level 26000 by the end of the day.
(viii) Trade only when bullish/ bearish conditions are fulfilled. Otherwise, don't trade. Protect your resources.
NOTE:
"Mark your points. Trade your points. Price is God. Anything can happen. Therefore, trade what you see, not what you believe."
Happy Trading!
BTC Elliott wave - what do you think ? Elliott wave theory. 5 wave count, with an ABCDE correction.
looking at 500m to liquidate at 94350.
how is the count and entry?

BUY TODAY SELL TOMORROW for 5%DON’T HAVE TIME TO MANAGE YOUR TRADES?
- Take BTST trades at 3:25 pm every day
- Try to exit by taking 4-7% profit of each trade
- SL can also be maintained as closing below the low of the breakout candle
Now, why do I prefer BTST over swing trades? The primary reason is that I have observed that 90% of the stocks give most of the movement in just 1-2 days and the rest of the time they either consolidate or fall
Cup & Handle Breakout in KMEW
BUY TODAY SELL TOMORROW for 5%

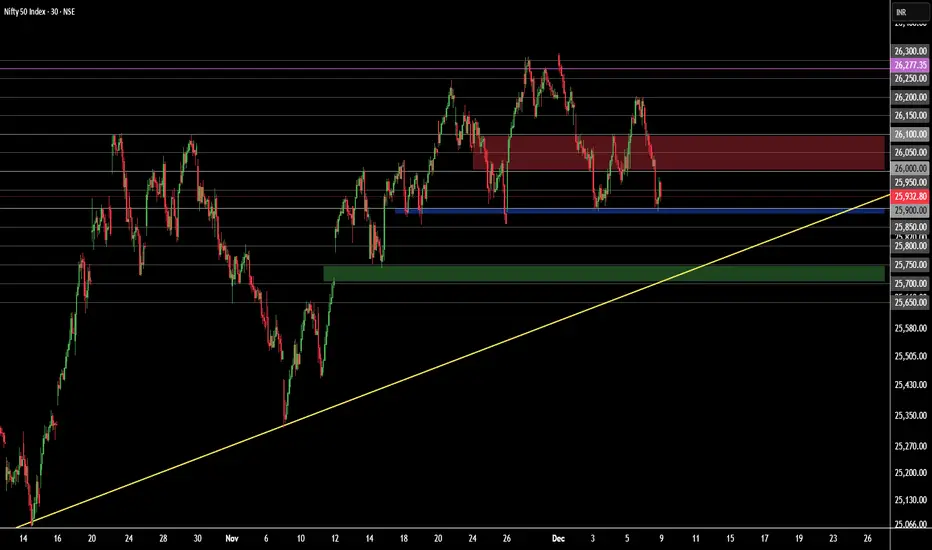
NIFTY : Trading levels and Plan for 09-Dec-2025📊 NIFTY TRADING PLAN — 09 DEC 2025
Nifty closed around 25,933, sitting just below Opening Resistance/Support (25,958).
Price remains in a corrective structure but is approaching major intraday support below.
Key Levels from the chart:
• Opening Resistance / Support: 25,958
• Last Intraday Resistance: 26,082
• Major Resistance: 26,136
• Last & Important Support Zone: 25,770 – 25,812
• Deeper Support: 25,732
Market sentiment is still fragile, and tomorrow’s opening will determine short-term direction.
🚀 1. GAP-UP OPENING (100+ points)
A gap-up above 26,020–26,050 places price close to the last intraday resistance cluster.
1. If price opens above 25,958 and retests it successfully
• Do NOT chase the opening candle.
• Wait for a retest of 25,958 showing bullish confirmation (wick rejection or CHoCH).
• Long entry activates → Targets: 26,082 → 26,136.
• Book partial profits near 26,082 as sellers previously reacted there.
2. If gap-up opens inside the resistance band (26,082–26,136)
• Avoid fresh longs — this zone is historically a rejection area.
• Look for bearish signs → If rejection occurs → Short only after price falls under 25,958.
• Downside targets: 25,900 → 25,850.
3. If price breaks and sustains above 26,136
• Strong bullish momentum.
• Next targets: 26,200 → 26,240.
• Trail stop-loss to protect profits.
📌 Educational Note:
Gap-ups typically require validation — breakouts without retests often fail. Always wait for a confirmation candle.
⚖ 2. FLAT OPENING (around 25,900–25,950)
Flat opens allow clean level-by-level trading and reduce whipsaw risk.
1. If price reclaims 25,958 and sustains
• Bulls gain early strength.
• Long trades activate on breakout + retest.
• Targets: 26,020 → 26,082 → 26,136.
2. If price rejects 25,958
• Lower-high formation indicates weakness.
• Short trades become valid toward 25,880 → 25,812.
3. If price trades between 25,900–25,958 initially
• Expect range-bound movement.
• Buy only near the lower range boundary with support confirmation.
• Sell only at the upper boundary with resistance confirmation.
📌 Educational Note:
Flat openings expose the true intention of the first 15–30 mins. Structural clarity matters more than speed.
📉 3. GAP-DOWN OPENING (100+ points)
A gap-down into 25,850–25,780 brings price directly into the strongest demand region on the chart.
1. If price opens inside 25,770–25,812 (Last & Important Support Zone)
• Absolutely avoid shorting this zone — strong buying expected.
• Wait for reversal candle patterns (hammer, engulfing, CHoCH).
• If reversal confirmed → Long toward 25,900 → 25,958.
2. If price opens near 25,732
• This is deeper support.
• Look for absorption of selling → If reversal appears → Long with targets:
→ 25,812 → 25,900.
3. If 25,732 breaks decisively
• Avoid catching a falling knife.
• Wait for a retest of 25,732.
• If retest rejects → Short continuation toward 25,670 → 25,620.
📌 Educational Note:
Gap-downs sweep liquidity. Smart money accumulates at support before trend reversals. Patience is key.
🛡 RISK MANAGEMENT TIPS FOR OPTIONS TRADERS
1. Do NOT trade the first 5 minutes after a gap opening.
Premiums fluctuate wildly.
2. Avoid buying far OTM options after a big gap.
IV crush + theta decay = quick capital loss.
3. Use strict stop-loss based on price levels, not premium.
4. Never risk more than 1–2% of your capital on a single trade.
5. High IV → Option selling strategies (credit spreads) work better.
Low IV → Option buying becomes more effective.
6. Book partial profits near key reaction levels:
25,958 / 26,082 / 26,136.
7. Avoid revenge trading — protect capital first.
📌 SUMMARY & CONCLUSION
• Bullish bias above 25,958, with targets toward 26,082 → 26,136.
• Choppy or neutral zone between 25,900–25,958 until breakout.
• Strong bullish reversal zones:
– 25,770–25,812
– 25,732
• Always trade with confirmation — retest entries provide the highest reliability.
• Strict risk management is essential in volatile conditions.
⚠ DISCLAIMER
I am not a SEBI-registered analyst.
This trading plan is purely for educational purposes and should not be considered investment advice.
Market conditions can change rapidly — always use your own judgment and proper risk controls.

#DREDGECORP - VCP + Large Base BreakOut Script: DREDGECORP
Key highlights: 💡⚡
📈 VCP BreakOut in Daily Time Frame
📈 Volume spike during Breakout
📈 Large Base BreakOut
📈 MACD Crossover
BUY ONLY ABOVE 970 DCB
⏱️ C.M.P 📑💰- 968
🟢 Target 🎯🏆 – 22%
⚠️ Stoploss ☠️🚫 – 11%
⚠️ Important: Market conditions are Okish, Position size 25% per Trade. Protect Capital Always
⚠️ Important: Always Exit the trade before any Event.
⚠️ Important: Always maintain your Risk:Reward Ratio as 1:2, with this RR, you only need a 33% win rate to Breakeven.
✅ Boost and Follow to never miss a new idea!✅
Disclaimer: I am not SEBI Registered Advisor. My posts are purely for training and educational purposes. Not a BUY or SELL recommendation.
Eat🍜 Sleep😴 TradingView📈 Repeat 🔁
Happy learning with MMT. Cheers!🥂

Gold Trading Strategy for 08th December 2025📌 GOLD (XAUUSD) INTRADAY TRADE PLAN
BUY SETUP – Breakout Above 1-Hour Candle
Idea: Buy only if the price shows strength by breaking and closing above the 1-hour candle high.
🔹 Buy Conditions
Buy Above: $4,241
Condition: Wait for a strong 1-hour candle close above $4,241.
After the candle closes, enter on the next candle when price retests or continues above this breakout zone.
🎯 Buy Targets
TP1: $4,256
TP2: $4,266
TP3: $4,277
🛡️ Stoploss (SL) for Buy
Conservative SL: Below $4,233 (previous 1-hour support zone)
Aggressive SL: Below the breakout candle low
Choose based on your risk appetite.
📉 SELL SETUP – Breakdown Below 30-Minute Candle
Idea: Sell only if price shows weakness and breaks the 30-minute candle low.
🔹 Sell Conditions
Sell Below: $4,173
Condition: Price must break and close below the 30-min candle low at $4,173.
Enter after confirmation candle retests or continues downward.
🎯 Sell Targets
TP1: $4,160
TP2: $4,148
TP3: $4,135
🛡️ Stoploss (SL) for Sell
Conservative SL: Above $4,182
Aggressive SL: Above the breakdown candle high
📌 Risk Management Notes
Never trade without SL.
Follow proper position sizing (1–2% of account per trade).
Always wait for candle close confirmation to avoid false breakouts.
Trail your SL as each target hits to lock profits.
Avoid trading news minutes unless your strategy allows volatility.
⚠️ DISCLAIMER
This is not financial advice.
This trade plan is for educational and informational purposes only.
Trading involves substantial risk of loss, especially in leveraged markets.
Always do your own analysis and consult your financial advisor before making any trading decisions.

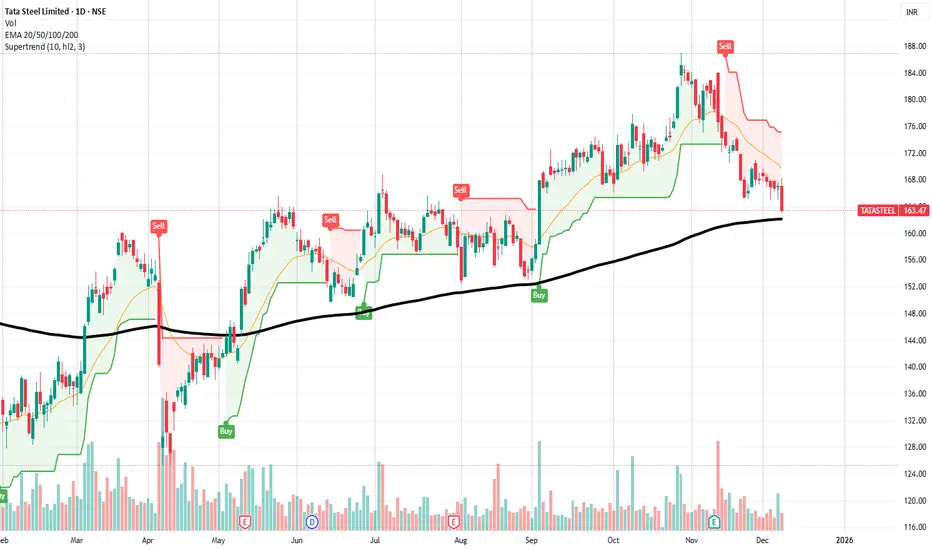
Tata Steel | 200 EMA Support + MACD Bullish Setup | Perfect std.Tata Steel has entered a high-probability reversal zone, combining multiple technical signals that traders often use to identify strong opportunities.
1. Price Sitting Exactly on 200 EMA (Major Trend Support)
The stock has reached the 200 EMA, a long-term trend indicator that acts as strong dynamic support.
From the chart, the last 3 touches to the 200 EMA (May, June & September) resulted in sharp upward reversals.
This increases the probability that buyers may step in again at this level.
------------------------------------------------------------------
2. MACD Close to Bullish Crossover
The MACD histogram is reducing red bars and is moving toward the zero line, indicating that selling pressure is cooling down.
A bullish crossover near a major support often marks the beginning of an upswing in momentum.
------------------------------------------------------------------
3. Stock Appears Short-Term Oversold
Price is stretched away from the short-term moving averages (20 & 50 EMA), and recent candles show slowing selling pressure.
This supports the idea of a bounce or trend reversal from the current zone.
------------------------------------------------------------------
4. Supertrend Still in Sell but Losing Momentum
Supertrend remains red, but the fall has slowed significantly.
A close above 170–172 will flip Supertrend to Buy, confirming the reversal.
Support Zones
162–164 → 200 EMA support zone
158 → Last horizontal support (critical)
Resistance Zones
170 → Short-term resistance (20 EMA)
176–178 → Strong reversal confirmation zone
185 → Major swing resistance
📈 Possible Bullish Scenario (Primary View)
If the price holds above 162–164 and MACD turns positive:
Targets: 170 | 176–178 | 185 | Stop-loss: Below 160 (Daily close)
📝 Notes (Important for Traders)
This is a technical analysis idea, not a buy/sell recommendation.
Risk management is important: adjust SL according to your trading style.
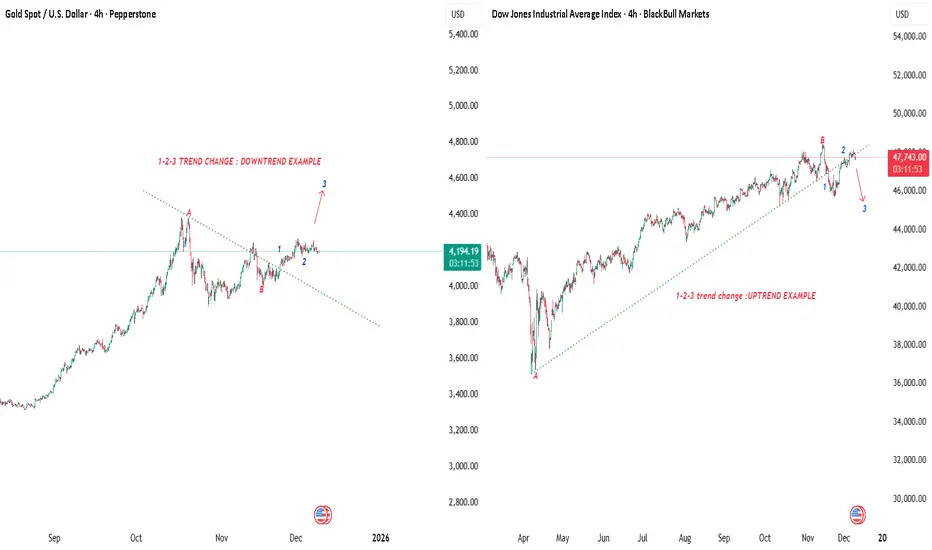
Price Action Pattern Series- 1-2-3 Trend Change Method !Starting this series with a very reliable structure-based reversal technique. The 1-2-3 method helps identify when a trend has actually changed instead of guessing bottoms or tops.
In simple terms, the trend shifts only after three structural events complete:
Sharing a simple but powerful reversal method for anyone who follows pure price structure. This technique removes the guessing part during trend shifts and keeps everything rule-based.
The method works in three steps:
Step 1: Draw a trendline from the most recent extreme high to the recent extreme low in a downtrend. The first sign of strength is when price closes above that line. This only shows the momentum is changing, not the trend.
Step 2: After the break, price usually pulls back and retests the previous low area. The retest can be slightly lower or slightly higher, but the important part is that it rejects and pushes back up, forming a higher low.
Step 3: The trend flips only when price closes above the swing high formed between the trendline break and the retest. That’s where the structure officially shifts and the market enters a new leg.
Where this method works best (timeframes)
– 15m to 1H: Perfect for intraday traders. It shows early trend shifts but with enough confirmation to avoid traps.
– 4H: Ideal for swing traders. Gives a clean, reliable trend change without noise.
– Daily: Best for bigger structural shifts. Useful for long-term direction changes and macro reversals.
– Weekly: Works, but slow. Only for big cycle traders.
When to use it
– When the market is coming out of a strong trend and you want confirmation before entering the opposite direction.
– After a large spike or news move when you want the structure to settle.
– During consolidation phases where direction is unclear.
– When you want to filter out false bottom/fake breakouts.
– When liquidity sweeps the low and you want to see if real demand steps in.
Why this method is reliable
It forces the market to:
Break momentum
Retest and hold
Break structure
Only after all three happen, the trend officially changes. It reduces emotional entries and keeps you aligned with clean structure.
This method is built on classic price-action principles seen. Sharing it purely for educational purpose as part of the price action series. More patterns will follow. Trade safe !!
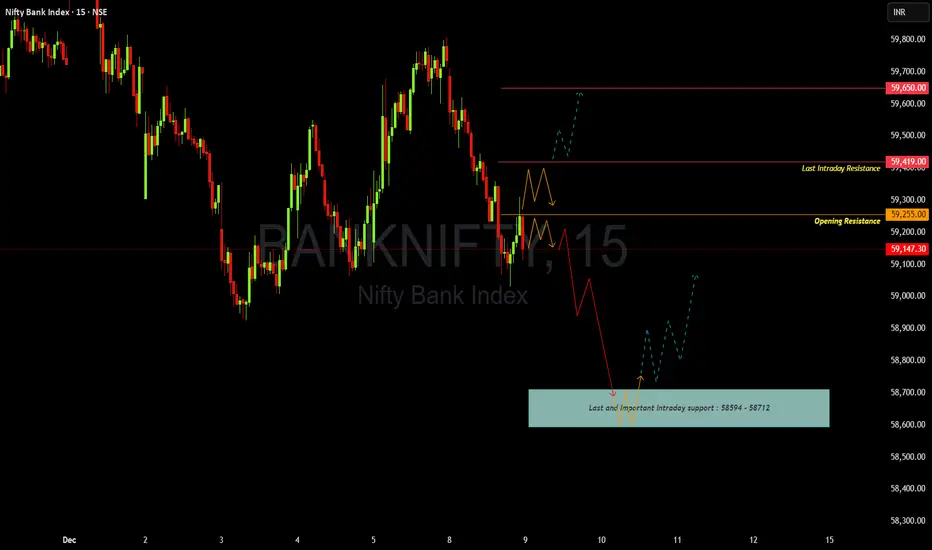
BANKNIFTY : Trading levels and Plan for 09-Dec-2025📊 BANKNIFTY TRADING PLAN — 09 DEC 2025
BankNifty closed around 59,147, sitting just below the Opening Resistance (59,255) and well below Last Intraday Resistance (59,419).
Downside includes a major liquidity pocket:
Last & Important Intraday Support: 58,594 – 58,712
Tomorrow’s opening reaction at these key levels will dictate trend continuation or reversal.
Key Levels from the chart:
• Opening Resistance: 59,255
• Last Intraday Resistance: 59,419
• Major Resistance: 59,650
• Major Support Zone: 58,594 – 58,712
🚀 1. GAP-UP OPENING (200+ points)
A gap-up above 59,350–59,400 puts BankNifty directly near the resistance cluster.
1. If price opens above 59,255 and retests it successfully
• Do NOT chase the gap-up.
• Wait for a retest of 59,255 with bullish reaction (wick rejections, CHoCH, engulfing).
• Once confirmed → Long entry toward 59,419 → 59,650.
• Book partial profits at 59,419 due to historical resistance.
2. If price opens directly inside 59,419 (Last Intraday Resistance)
• High chance of rejection and profit booking.
• Avoid fresh longs here.
• Look for rejection patterns → Short entries valid only if price falls back below 59,255.
• Targets: 59,147 → 59,000.
3. If breakout sustains above 59,650
• Signals strong trending day.
• Next targets open toward 59,800–59,900.
• Trail stop-loss aggressively to protect gains.
📌 Educational Note:
Gap-ups often test nearby resistance first. Retests offer the safest way to enter trending moves.
⚖ 2. FLAT OPENING (±70 pts around 59,150)
Flat openings allow for clean structural setups.
1. If price reclaims 59,255 and sustains
• Buyers show control above this level.
• Long setups activate after breakout + retest.
• Targets: 59,419 → 59,650.
2. If price rejects 59,255
• Bearish rejection = lower-high structure.
• Short setups valid toward 59,147 → 59,000.
3. Break below 59,147 (LTP area)
• Trend pressure shifts bearish.
• Next downside targets: 58,900 → 58,712.
📌 Educational Note:
Flat opens reveal market intent through early candle structure. Let the market show its direction—avoid guessing.
📉 3. GAP-DOWN OPENING (200+ points)
A gap-down near 58,900–58,850 brings price closer to the big buyer zone.
1. If price opens near 58,900 and holds above it
• Expect initial volatility but avoid panic.
• Look for reversal patterns → If confirmed → Long toward 59,000 → 59,147.
2. If price opens inside the Major Support Zone (58,594–58,712)
• This is the strongest demand region on the chart.
• Never short inside this zone.
• Look for reversal signs (hammer, bullish engulfing, CHoCH).
• If reversal confirmed → Long toward 58,900 → 59,147 → 59,255.
3. If price breaks below 58,594 with strong momentum
• Do NOT enter immediately — wait for a retest.
• If retest rejects → Short continuation toward 58,450–58,400.
• Trend becomes bearish for the day.
📌 Educational Note:
Aggressive selling during gap-downs often sweeps liquidity before sharp reversals. Trade based on confirmation, not assumptions.
🛡 RISK MANAGEMENT TIPS FOR OPTIONS TRADERS
1. Avoid trading the first 5 minutes after big gap opens.
Premiums behave erratically.
2. Do NOT buy deep OTM options after a big gap-up or gap-down.
IV crush + theta decay = rapid losses.
3. Always use price-level-based stop losses, not premium-based SL.
4. Follow strict risk-per-trade:
Risk only 1–2% of trading capital.
5. High IV → favour option selling (credit spreads, iron condors).
Low IV → option buying becomes more efficient.
6. Book partial profits near major zones:
59,255 / 59,419 / 59,650
7. Avoid revenge trading.
Protect capital before chasing profits.
📌 SUMMARY & CONCLUSION
• Bullish bias only above 59,255, with targets toward 59,419 → 59,650.
• Choppy zone expected between 59,147–59,255.
• Major downside reversal area: 58,594–58,712 (strong buyer zone).
• Always wait for breakout + retest for clean entries.
• Maintain disciplined risk management—levels are your guide.
⚠ DISCLAIMER
I am not a SEBI-registered analyst.
This plan is for educational purposes only and must not be considered investment advice.
Market behaviour can change rapidly — always use your own judgment and proper risk management.
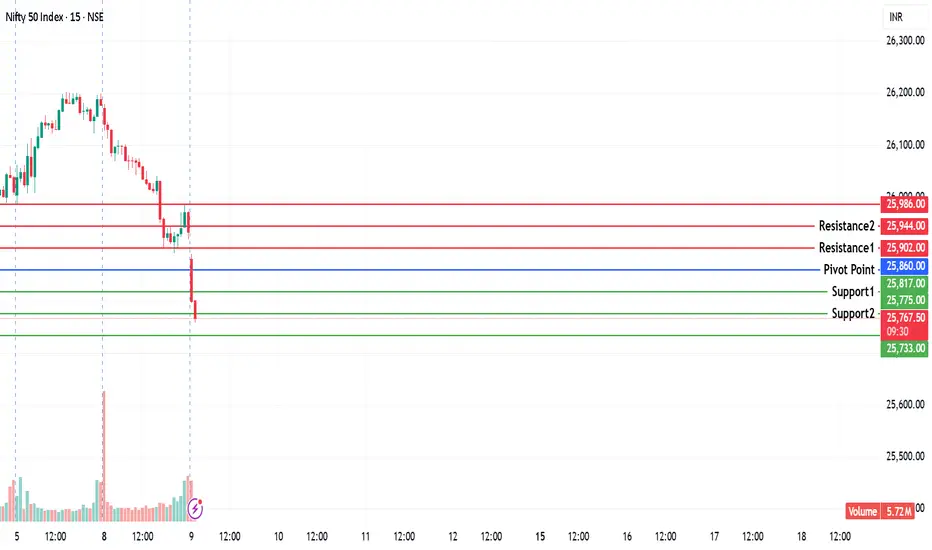
NIFTY KEY LEVELS FOR 09.12.2025NIFTY KEY LEVELS FOR 09.12.2025
Timeframe: 3 Minutes
If the candle stays above the pivot point, it is considered a bullish bias; if it remains below, it indicates a bearish bias. Price may reverse near Resistance 1 or Support 1. If it moves further, the next potential reversal zone is near Resistance 2 or Support 2. If these levels are also broken, we can expect the trend.
When a support or resistance level is broken, it often reverses its role; a broken resistance becomes the new support, and a broken support becomes the new resistance.
If the range(R2-S2) is narrow, the market may become volatile or trend strongly. If the range is wide, the market is more likely to remain sideways
please like and share my idea if you find it helpful
📢 Disclaimer
I am not a SEBI-registered financial adviser.
The information, views, and ideas shared here are purely for educational and informational purposes only. They are not intended as investment advice or a recommendation to buy, sell, or hold any financial instruments.
Please consult with your SEBI-registered financial advisor before making any trading or investment decisions.
Trading and investing in the stock market involves risk, and you should do your own research and analysis. You are solely responsible for any decisions made based on this research
This Stupid Simple Strategy will help you become a better traderI make educational content videos for swing trading
Charts used are 3 months or older .
