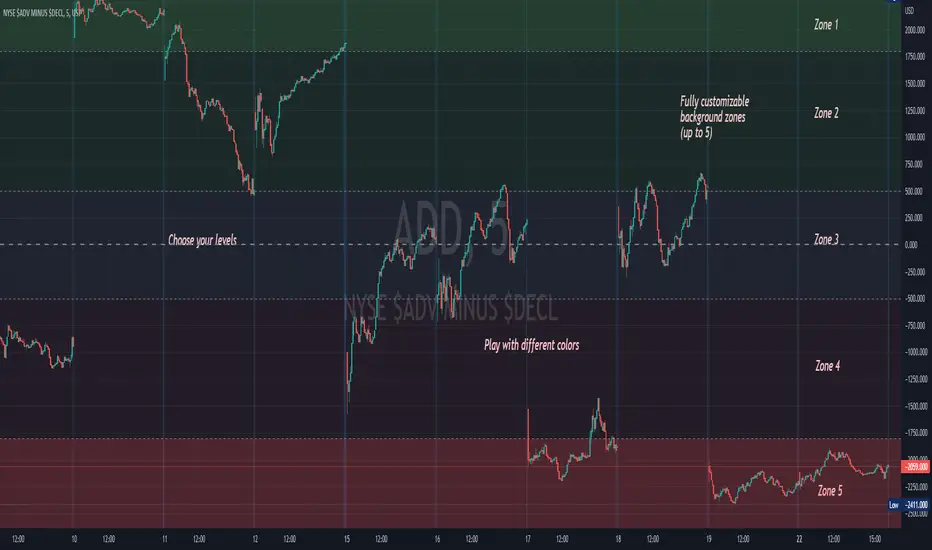
Background ZonesThis script provides up to 5 zones to apply background colors. This is especially useful for applying to indices such as USI:TICK , USI:ADD , and USI:VOLD , where certain levels provides significant meaning to market sentiment and directions. This script will give you the visual cue to help with your trading.
All levels and colors are fully customizable.
Enjoy~!!
Example:
Levels
Quick LevelsQuick Levels allow users to quickly add multiple levels to their chart all at once through an intuitive user interface!
No need to fiddle with drawing lines and then inputting their exact position afterwards, do all of it with one string of numbers!
Insert multiple levels at once, simply separate your price levels by commas(,).
Insert levels across tickers to save time when switching between charts.
Notes:
For users coming from "Copy/Paste Levels", this system is very robust.
The only user input variable that is not multiple choice is the "levels" box. I have taken steps to fool proof this box, by (input processing) removing spaces, removing commas at the start or end, and replacing semicolons with commas. You can see in the cover chart that the inputs for the first level have a lot of spaces and a comma at the end, yet it does not effect the output.
If there is no ticker entered in the "Ticker" box, the levels will be drawn on your current chart.
Enjoy!

Copy/Paste Levels Creator ToolThis indicator is for making levels to enter into the Copy/Paste Levels Indicator, This description will serve as a guide on how to use this tool to export levels for sharing!
Copy/Paste Levels Indicator:
Once you add this indicator to your chart it will pop up with a confirmation box for quick access to adding levels, You can see a snapshot of the settings UI on the left in the chart in this post.
If you want to just add the indicator to your chart press "apply" and you will be able to add levels by going into the settings for the indicator. Otherwise, Just fill out the settings and only check on the boxes you need (minimum 1).
All values are default, and the only boxes that need to be filled out are the Ticker and Lvls.
In the lvls box, insert your levels separated by commas(,) it is preferred that you do not have any spaces in the lvls box, however in the code, I have a piece to remove spaces from this box.
Now The Important Part!
As you may notice, this indicator does not display anything. Its main function is to export formatted text to be entered into the Copy/Paste Levels Indicator.
The way we do this is through email alerts .
After inputting levels to Export, Go to a live chart and set an alert for this indicator, check the box for "Email Alerts".
This will send the alert message to your email when it fires.
After the alert fires,
Check your email, you will have a message containing the formatted levels, ready to be copy and pasted into the other indicator!
How does the alert fire?
I have the alert function set to fire on every calculation of the indicator because of this,
This indicator will alert immediately , on any LIVE chart.
Note: After the alert fires, it is probably a good idea to immediately delete the alert, or else you will get an alert on ever candle with the same information you have already exported.
What if its after market and the chart is not ticking?
When making levels on off hours, remember to set the alert (for this indicator) on a live chart such as BTC.
Remember: The chart you are on does not have to be the one you are making levels for. This indicator is simple an interface.
Enjoy!

Copy/Paste LevelsCopy/Paste Levels allows levels to be pasted onto your chart from a properly formatted source.
This tool streamlines the process of adding lines to your chart, and sharing lines from your chart.
More than one ticker at a time!
This indicator will only draw lines on charts it has values for!
This means you can input levels for every ticker you need all at once, one time, and only be displayed the levels for the current chart you are looking at. When you switch tickers, the levels for that ticker will display. (Assuming you have levels entered for that ticker)
The formatting is as follows:
Ticker,Color,Style,Width,Lvl1,Lvl2,Lvl3;
Ticker - Any ticker on Tradingview can be used in the field
Color - Available colors are: Red,Orange,Yellow,Green,Blue,Purple,White,Black,Gray
Style - Available styles are: Solid,Dashed,Dotted
Width - This can be any negative integer, ex.(-1,-2,-3,-4,-5)
Lvls - These can be any positive number (decimals allowed)
Semi-Colons separate sections, each section contains enough information to create at least 1 line.
Each additional level added within the same section will have the same styling parameters as the other levels in the section.
Example:
2 solid lines colored red with a thickness of 2 on QQQ, 1 at $300 and 1 at $400.
QQQ,RED,SOLID,-2,300,400;
IMPORTANT MUST READ!!!
Remember to not include any spaces between commas and the entries in each field!
ex. ; QQQ, red, dotted, -1, 325; <- Wrong
ex. ;QQQ,red,dotted,-1,325;)<- Right
However,
All fields must be filled out, to use default values in the fields, insert a space between the commas.
ex. ;QQQ,red,dotted,,325; <- Wrong
ex. ;QQQ,red,dotted, ,325; <- Right
While spaces can not be included line breaks can!
I recommend for easier typing and viewing to include a line break for each new line (if changing styling or ticker)
Example:
2 solid lines, one red at $300, one green at $400, both default width. Written in a single line AND using multiple lines, both give the same output.
QQQ,red,solid, ,300;QQQ,green,solid, ,400;
or
QQQ,red,solid, ,300;
QQQ,green,solid, ,400;
In this following screenshot you can see more examples of different formatting variations.
The textbox contains exactly what is pasted into the settings input box.
As you can see, capitalization does not matter.
Default Values:
Color = optimal contrast color, If this field is filled in with a space it will display the optimal contrast color of the users background.
Style = solid
Width = -1
More Examples:
Multi-Ticker: drawing 3 lines at $300, all default values, on 3 different tickers
SPY, , , ,300;QQQ, , , ,300;AAPL, , , ,300
or
SPY, , , ,300;
QQQ, , , ,300;
AAPL, , , ,300
Multiple levels: There is no limit* to the number of levels that can be included within 1 section.
* only TV default line limit per indicator (500)
This will be 4 lines all with the same styling at different values on 2 separate tickers.
SPY,BLUE,SOLID,-2,100,200,300,400;QQQ,BLUE,SOLID,-2,100,200,300,400
or
SPY,BLUE,SOLID,-2,100,200,300,400;
QQQ,BLUE,SOLID,-2,100,200,300,400
Semi-colons must separate sections, but are not required at the beginning or end, it makes no difference if they are or are not added.
SPY,BLUE,SOLID,-2,100,200,300,400;
QQQ,BLUE,SOLID,-2,100,200,300,400
==
SPY,BLUE,SOLID,-2,100,200,300,400;
QQQ,BLUE,SOLID,-2,100,200,300,400;
==
;SPY,BLUE,SOLID,-2,100,200,300,400;
QQQ,BLUE,SOLID,-2,100,200,300,400;
All the above output the same results.
Hope this is helpful for people,
Enjoy!

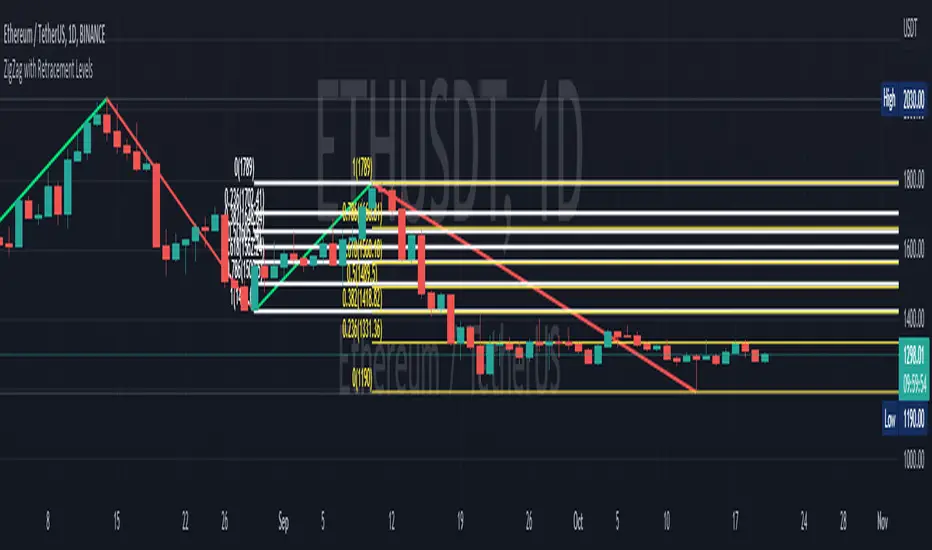
ZigZag with Retracement LevelsThis is a modification to "ZigZag with Fibonacci Levels" by LonesomeTheBlue.
By default, the script finds the ZigZag, draws Fibonacci lines and labels accordinly. ZigZag period can be set.
The modification to the original script provides the following features:
1) Option for user to customize retracement levels, if they don't want to use Fibonacci levels. This allows for different strategy adoptions.
2) Option to show Fibonacci or custom retracement levels based on the latest pivot (including the current bar)
For example:
Enjoy and happy trading~!!
Risk:RewardThis Indicator displays Entry and Exits levels. The display is done under 3 modes:
- Risk/Reward mode (the one by default. It is set to a 1:1 ratio)
- Multiples TP Levels
- Custom Levels
Click to Set entry Price on chart
The displaying is static by default
to make it dynamic disable the "Use custom Entry ?" input.
Disclaimer: Scripts that I post publicly are experimental. They are not financial advices. Always backtest your ideas using your own methodologies.

Volume Analysis*Sourced code from Volume Flow v3 by oh92 for Bull\Bear volume flow calculations. Thank you so much for your engineering skills!
This indicator integrates the Ma-over-MA crossover strategy in oh92's V3 DepthHouse calculation with a volume-over-MA
calculation to further narrow down "Areas of Interest" levels for a potential re-test zone to the right of the chart.
I added a Moving Average calculation for a multi-level cloud and further broke down more conditions to highlight both
volume flow crossover on the High and Extreme High MA's and also high and extreme high volume spikes on set period average
without bull\bear conditions. Original Bull/Bear Spikes are still viewable although that was the only plot from oh92's script
that was integrated.
Session backgrounds set for research purposes.
Please note: Setting MA Cloud to "None" will remove all plots calculated with the MA Cloud from the chart entirely. Turn off visuals
in the Style tab.


nifty gann & 100 levelsnifty gannlevels with 100 points defference
gann levels with manual entry of cuurent gann level
manual entry of diffeence between two gann levels

Titans Empirical LevelsThis indicator marks key pivot levels across two higher timeframes, longer term, and medium term.
When a pivot high or low is detected at the higher timeframe, a line is plotted in the future.
The user may select timeframes and pivot sensitivities in the indicator settings.
As no calculation is involved, the levels are identified purely from historical precedent.
Overlapping lines could imply strength of recent support/resistance at that level.
This indicator should be used in combination with other indicators.
The user is advised to use this indicator at his own risk.

Rollin' pseudo-Bollinger Bands 5 linear regression curves and new highs/lows mixed together from the basis for this indicator. Using slightly different logic an upper boundary and lower boundary are formed. Then the boundary's are built upon to show price channels within the band using variations of fib levels and the distance between the initial boundary's. Dots plotted show the inverse of the close price relative to either the upper or lower boundary depending on where the close is relative to the center of the band. This shows the market's tendency for symmetry which is useful when looking for reversals etc. If it's too cluttered feel free to turn off some things in the options and keep what you feel is helpful.

RAS.V2 Strength Index OscillatorHeavily modified version of my previous "Relative Aggregate Strength Oscillator" -Added high/low lines, alma curves,, lrc bands, changed candle calculations + other small things. Replaces the standard RSI indicator with something a bit more insightful.
Credits to @wolneyyy - 'Mean Deviation Detector - Throw Out All Other Indicators ' And @algomojo - 'Responsive Coppock Curve'
And the default Relative Strength Index
The candles are the average of the MFI ,CCI ,MOM and RSI candles, they seemed similar enough in style to me so I created candles out of each and the took the sum of all the candle's OHLC values and divided by 4 to get an average, same as v1 but with some tweaks. Previous Peaks and Potholes visible with the blue horizontal lines which adjust when a new boundary is established. Toggle alma waves or smalrc curves or both to your liking. This indicator is great for calling out peaks and troughs in realtime, although is best when combined with other trusted indicators to get a consensus.

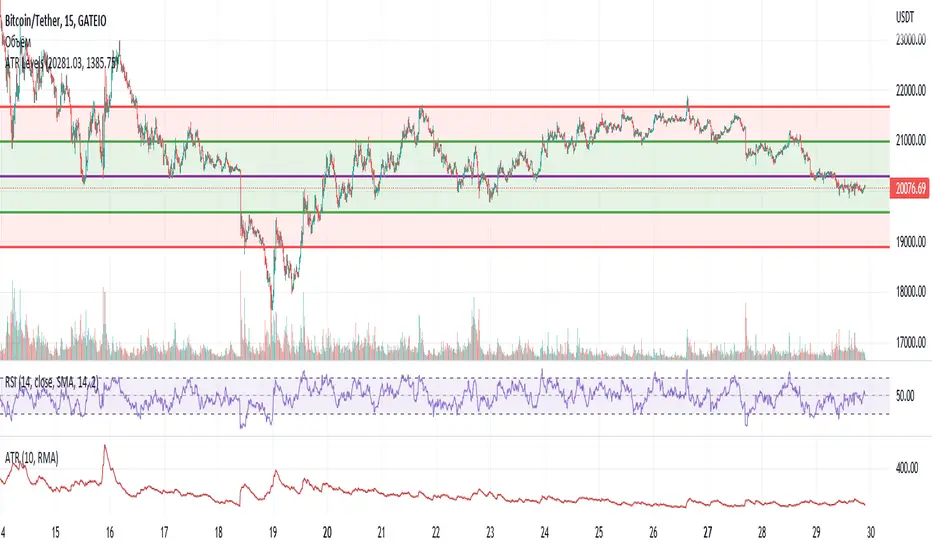
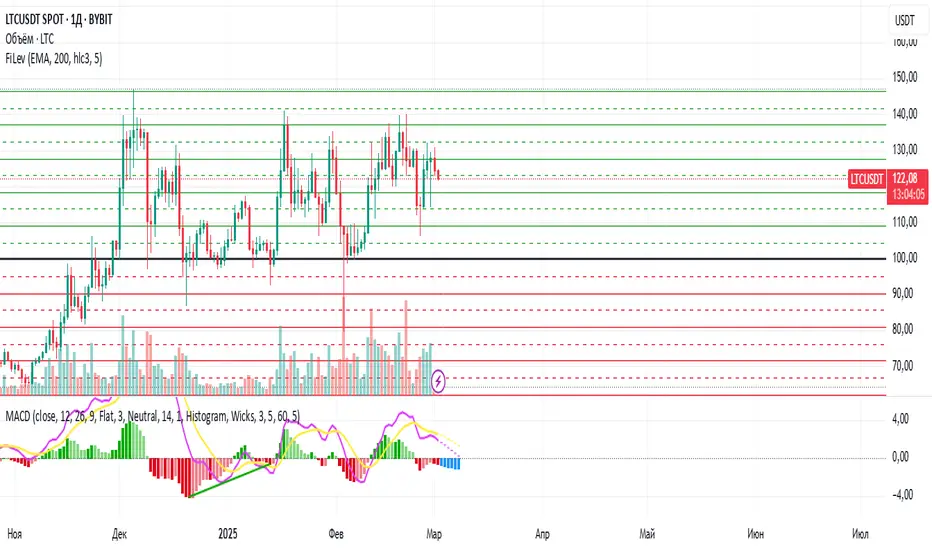
ATR LevelsATR Levels
The indicator plots levels based on the ATR indicator
Initial data required for the indicator:
- Open price
- ATR
Levels are calculated as follows:
1. Open price +100% ATR
2. Open price +50% ATR
3. Open price
4. Open price -50% ATR
5. Open price -100% ATR
For visual convenience:
The area between levels 1-2 and 4-5 is filled with red
Zone between levels 2-4 - filled with green
Уровни среднего истинного диапазона
Индикатор строит уровни, основанные на индикаторе ATR (Средний истинный диапазон)
Исходные данные, необходимы для индикатора:
- Цена открытия
- ATR (Средний истинный диапазон)
Уровни рассчитываются следующим образом:
1. Цена открытия +100% ATR
2. Цена открытия +50% ATR
3. Цена открытия
4. Цена открытия -50% ATR
5. Цена открытия -100% ATR
Для удобства визуального восприятия:
Зона между уровнями 1-2 и 4-5 заполнена красным цветом
Зона между уровнями 2-4 - заполнена зеленым цветом
Know your Monthly, Weekly, Daily LevelsThis script will show monthly, weekly and daily (with or without pre market) levels on your intraday chart. You can chose what values of the corresponding candles (high, low, close) should be included.
Please consider following limitations:
1. Maximum of 500 drawing objects per chart
To make sure the most relevant levels are shown, values are sorted based on the latest close value before levels > 500 are cut off.
2. Lookback history
The max lookback history is limited by the currently selected timeframe. E.g. on a 5min timeframe, 20000 bars (Premium Plan) result in approx. 5 months of lookback period, meaning you may want to have a 30 min or higher chart open to get a complete picture of levels, while trading on a lower timeframe.
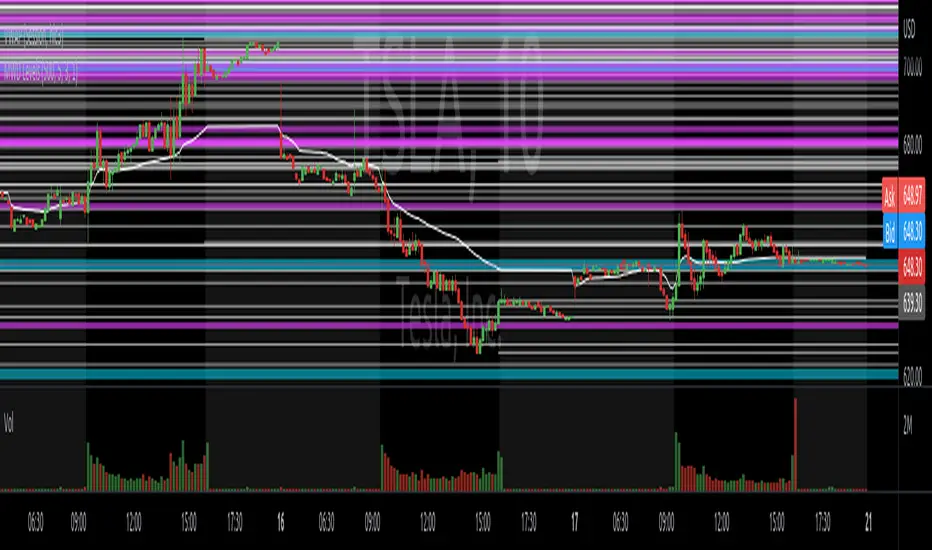
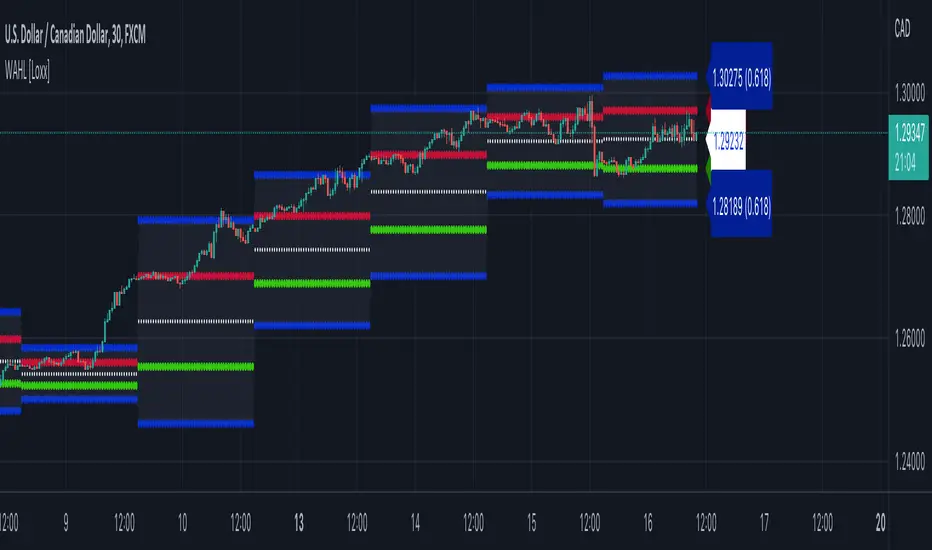
Waddah Attar Hidden Levels [Loxx]Waddah Attar Hidden Levels is a dynamic indicator of support of resistance built by Ahmad Waddah Attar
Details
-Uses data from the Daily time frame only
-Used for intraday trading, restricted to timeframes 1 hour and below
-Best Time Frames 15, 30, 60 minutes
-Draws support and resistance lines on chart inside a boundary of fibonacci levels
How to use Waddah Attar Hidden Levels
-Breakout trading indicator
-Buy at the broken red line, or insert pending buy order
-Sell at the broken green line, or insert pending buy order
-Take profit/Stop-loss at blue lines
v2.3 Weekly Fibo Candle Middle LineThis is a real time tools assisting traders in monitoring the Fibonacci Retracement Levels while the range is extending in real time run. I have simply marked the three most important Fibonacci retracement level, namely 38.2%, 50%, 61.8% which are colored and marked as blue Fibo_up, red Fibo_mid and blue Fibo_low. Should you have any idea in trading with other Fibonacci levels, please send me your feedback for improvement and sharing.

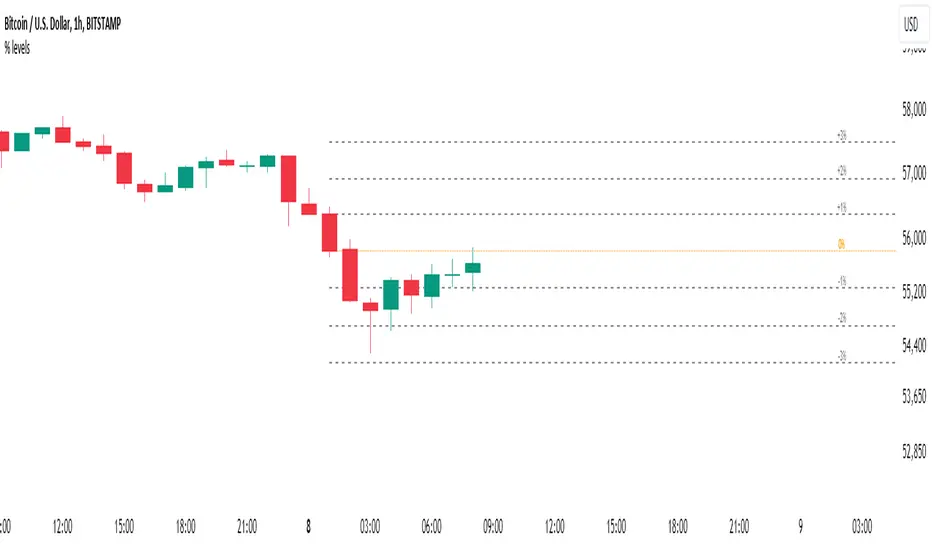
Percent Levels From Previous CloseThis indicator plots on the chart +/- 1% / 2% / 3% ranges based on the previous day's close levels.
Disclaimer :
Success in trading is all about following your trading strategy and indicators should fit into your own strategy, and not be traded purely on.
This script is for informational and educational purposes only. Use of the script does not constitute professional and / or financial advice. You are solely responsible for evaluating the outcome of the script and the risks associated with using the script. In exchange for the use of the script, you agree not to hold monpotejulien TradingView user responsible for any possible claims for damages arising out of any decisions you make based on the use of the script.
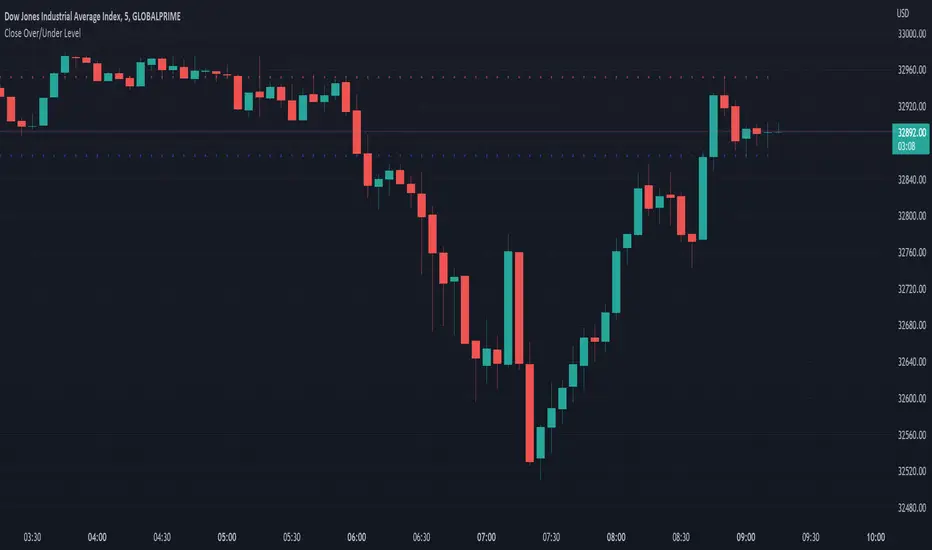
Close Over/Under LevelIf you want to be alerted when a price closes above or below a given level(s), then this indicator is for you! 😁 Whether you're looking for a breakout, or some change of structure, etc, this should come in handy.
Usage:
Just add a level(s) (anything above 0).
Optionally plot lines.
Set alerts as normal.
Enjoy!
4C Daily Levels Suite + Premarket High/LowThis '4C Daily Levels Suite + Premarket High/Low' indicator is a clean way to automatically plot important daily levels including:
Prior Day High
Prior Day Low
Prior Day Close
50% level between Prior High/Low
Today's Open
Today's Premarket Low+High
This Daily Levels indicator is unique in its ability to:
-Plot all of the daily level PLUS premarket high/low levels (extended hours must be turned ON)
-Can hide past days levels, only plotting levels on the current day, to keep chart cleaner
-Can extend line levels right or fullscreen
-Plots the level price at each level on the chart
-Can show/hide price levels labels
-Can add supplemental premarket levels plot to show levels being formed during the premarket time period
-Coded with line.new vs plot so dashed lines are available as a style
-Automatically hides the indicator if the timeframe selected is Daily or greater
SEE SCREENSHOT EXAMPLES BELOW
Default mode, with extended hours showing:
With supplemental premarket plot showing:
Default mode without extended hours showing:
Showing past day’s levels
Extend lines to fullscreen
Some parts of this code were adapted from 'pd Levels' by CryptoCurl

Session LevelsThis indicator plots important session (intraday) levels for the day. It plots high and low of previous day, week, month, 52 week and all time. Also plots the vix range which shows the daily expected trading range of the instrument. These levels acts as important support/resistance for the day.
For example, if price closes above previous day, week, or month high/low it indicates bullish sentiment and vice versa for bearish.
Vix Range plots top, center, bottom line for expected trading range for the day. It is calculated based on the volatility index selected (NSE:India VIX is used by default).

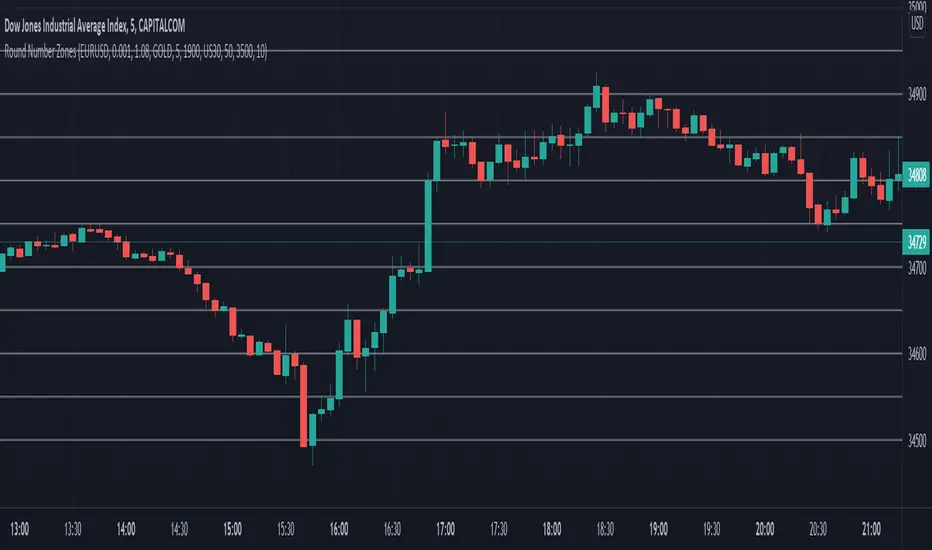
Round Number ZonesThis indicator shows zones of round numbers for 3 custom symbols like US30, EURUSD or GOLD as lines in the chart. The starting price can also be the current or a custom one and you can configure the increments as well. CAPITALCOM:US30
Fibonacci LevelsENGLISH
FiboLevels uses standard deviation (a measure of market volatility). For me, more successful parameters were EMA, 500 days, showing levels 50 and 100.
The standard RSI 14 indicator helps to determine the levels, you can use its values to navigate the levels if the price approaches any line, and the RSI is in the overbought or oversold zone, that is, there is a high probability that the price may rebound from this level.
If the script does not display levels, then you need to reduce the length parameter
If the price has gone beyond the lines, then the number of levels can be increased in the Number of Lines Show parameter
Russian
В FiboLevels используется стандартное отклонение (величина измерения волатильности рынка). Для меня более удачными параметрами вышли EMA, 500 дней , показ уровней 50 и 100.
Определять уровни помогает стандартный индикатор RSI 14, по его значениям можно ориентироваться в уровнях, если цена подходит к какой-либо линии, а RSI находится в зоне перекупленности или перепроданности, то есть большая вероятность что от этого уровня цена может оттолкнуться.
Если скрипт не отображает уровней, то нужно уменьшить параметр длина
Если цена вышла за пределы линий, то количество уровней можно увеличить в параметре Number of Lines Show
Key Levels// How it Works \\
Calculating Previous Days, Weeks and Monthly open, high, low, close and vwaps
Plots these levels on your chart
// Settings \\
You can enable/disable any of the levels you want to see
You can also change the amount of bars back the levels are plotted back to
// Use Case \\
These levels are often used in different methods of Technical analysis for support and resistance.
// Suggestions \\
Happy for anyone to make any suggestions on changes which could improve the script,
// Terms \\
Feel free to use the script, If you do use the script could you please just tag me as I am interested to see how people are using it. Good Luck!
