TopTenAlgo 7. Linear Trend Tracking (Include Volume & Coloring)EN:
Dogrusal Trend Takipcisi is used in conjunction with Gosterge Trend. Both indicators are for approval of each other. While the Indicator looks at Logarithmic to prices, It looks at Linear. Although its mathematical function is stuck between two trend lines like Gösterge Trend, the Dogrusal Trend Takipcisi can also be used as the main histogram, the absolute value of the difference between the trend and the down trend line .
If the uptrend line is larger than the downtrend, histogram bars are light green or dark green areas. When the bullish trend line now crosses the down trend line , the bar is dark green. When the up trend line is larger than the down trend line and the up trend line increases, the bars also become dark green. This tendency starts to keep getting stronger. If the bullish trend line is larger than the bearish trend line but decreases, the bars are light green. This is when the bullish trend loses strength, So, Uptrend is weakening.
If the downtrend line is larger than the bullish trend line , a negative occur, and the bars become red or light red. If the bearish trend line has exceeded the bullish trend line or the value is increasing, the bar is in red. If the bearish trend line is larger than the bullish trend line but the value is decreasing, the bars are light red. This comes when the downward trend is losing power. So, Downtrend is weakening.
This algorithm is prepared with @Top10Algo ...
TR: Doğrusal Trend Takipçisi Gösterge Trendle ile beraber kullanılır. Her iki göstergede birbirinin onayını almak içindir. Gösterge Trend fiyatlara logaritmik bakarken, Doğrusal Tren Takipçisi Linear bakar. Matematiksel fonsiyonu Gösterge Trend gibi iki trend çizgisi arasına sıkışmış olsada Doğrusal Trend Takipçisi ayrıca ana histogram olarak gösterilen yukarı trend ve aşağı trend çizgisi arasındaki farkın mutlak değerini linear olarak hesaplayarak momentumun gücünü ölçer ve size zayıflayan trendleri haber eder.gösterir.
Yukarı trend çizgisi aşağı trendden büyükse (bu nedenle pozitif hareketi gösterir), histogram çubukları açık yeşil veya koyu yeşil olacaktır. Artış trendi çizgisi şimdi aşağı trend çizgisini geçtiğinde, çubuk koyu yeşil olacaktır. Yukarı trend çizgisi aşağı trend çizgisinden daha büyük olduğunda ve yukarı trend çizgisi arttığında çubuklar da koyu yeşil olur. Bu eğilimin güçlenmeye devam ettiği anlamına geliyor. Yükseliş trendi çizgisi düşüş trendi çizgisinden büyükse ancak azalıyorsa, çubuklar açık yeşil olacaktır. Bu yükseliş eğiliminin güç kaybettiği anlamına gelir.Yani yükseliş trendi zayıflıyordur.
Düşüş trendi çizgisi yükseliş trendi çizgisinden büyükse, olumsuz bir eğilim oluşur ve çubuklar kırmızı veya açık kırmızı olur. Düşüş trendi çizgisi yükseliş trendi çizgisini aştıysa veya değer artıyorsa, çubuk kırmızı olacaktır. Düşüş trendi çizgisi yükseliş trendi çizgisinden büyükse, ancak değer azalıyorsa, çubuklar açık kırmızı olacaktır. Bu düşüş eğiliminin güç kaybettiği anlamına gelir. Yani düşüş trendi zayıflıyordur.
Bu algoritma @Top10Algo ile beraber hazırlanmıştır...
Linear Regression


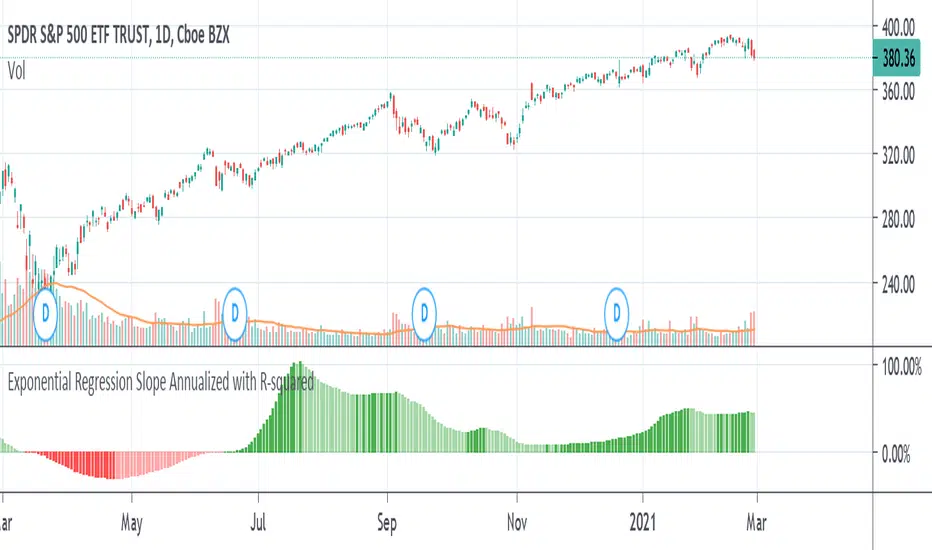
Exponential Regression Slope Annualized with R-squared HistogramMy other indicator shows the linear regression slope of the source. This one finds the exponential regression slope and optionally multiplies it by R-squared and optionally annualizes it. Multiplying by R-squared makes sure that the price movement was significant in order to avoid volatile movements that can throw off the slope value. Annualizing the exponential slope will let you see how much percentage you will make in a year if the price continues at its current pace.
The annualized number is the number of trading days in a year. This and the length might need adjusting for the extra bars that might be in futures or other markets. The number does not have to be a year. For example, it can be a month if you set the number to 20 or so trading days to find how much you would make in a month if price continues at its current pace, etc. This can also be used as an alternative to relative strength or rate of change.
Moving RegressionMoving Regression is a generalization of moving average and polynomial regression.
The procedure approximates a specified number of prior data points with a polynomial function of a user-defined degree. Then, polynomial interpolation of the last data point is used to construct a Moving Regression time series.
Application:
Moving Regression allows one to smooth noise on the analyzed chart, assess momentum, confirm trends, and establish areas of support and resistance.
In addition, it can be used as a simple stand-alone forecasting method to identify trend direction and trend reversal points. When the local polynomial is predicted to move up in the next time step, the color of the Moving Regression curve will be green. Otherwise, the color of the curve is red. This function is (de)activated using the Predict Trend Direction flag.
Selecting the model parameters:
The effects of the moving window Length and the Local Polynomial Degree are confounded. This allows for finding the optimal trade-off between noise (variance) and lag (bias). Higher Length and lower Polynomial Degree (such as 1, i.e. linear), will result in "smoother" time series but at the cost of greater lag. Increasing the Polynomial Degree to, for example, 2 (squared) while maintaining the Length will diminish the lag and thus compromise the noise-lag tradeoff.
Relation to other methods:
When the degree of the local polynomial is set to 0 (i.e., fitting data to a constant level), the Moving Regression time series exactly matches the Simple Moving Average of the same length.

Linear Regression - Reverse Up/Down StrategyFor my first foray into pine script I took the code from the generic "Consecutive up/down" and flipped the logic. I added a linear regression filter to try and stay with the overall trend. ATR added for visual, I eventually want to use it as part of the money management.
Rules to open trade or close the opposite:
IF the linear regression slope is >=0 AND the last candle closes lower, BUY
IF the linear regression slope is <=0 AND the last candle closes higher SELL
Rules to close the opposite:
IF the linear regression slope is >=0 AND the last candle closes higher, close any open SELL
IF the linear regression slope is <=0 AND the last candle closes lower, close any open BUY
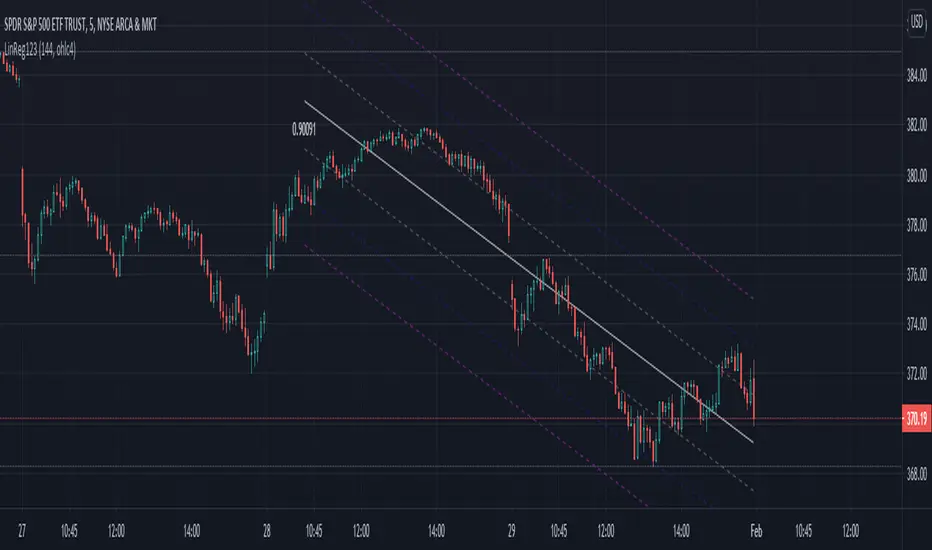
Pearsons R historic breaks ( for making strategy out of it )Pearsons R adjustments of linear regressions is a good tool to analyse visually the trend basis channeling of the market,
one of the common challenges in the scripts which i came across the tradingview community is the lack of the historic places put over the charts where the price actually crossed up/below the channel boundaries,
For me in order to do so we would have to replay the scripts over and over.
So I came up with an addon extension to a good script on the community ()
I have added the historic marks over the charts ( blue/green/red/orange Arrows which you see on the charts)
These arrows are the places where the price have crossed the channel boundaries historically
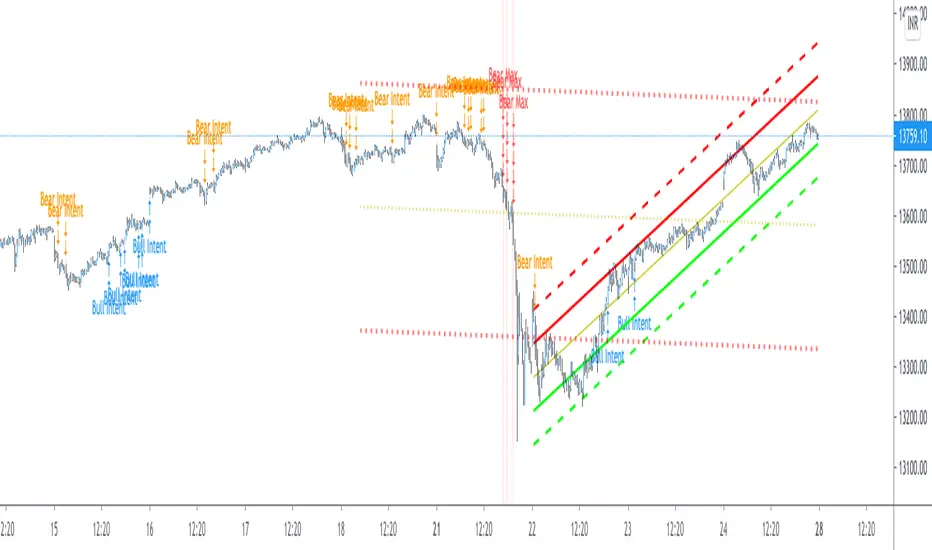
So,
Blue arrow = Bull Intent ,Place where the upper channel boundary line have been crossed
Orange arrow = Bear Intent , Place where the Lower channel boundary line have been crossed
Green arrow = Bull Max , Place where the Maximum Upper channel boundary line have been crossed
Red arrow = Bear Max , Place where the Minimum Lower channel boundary line have been crossed
For me this type of approach is good for making a strategy out of the concepts visually, in congestion to other indicators
I would suggest you guys to check this on alert basis with your setups to derive out the best from linear regressions
Lastly it would be a pleasure to give credits to the creators of Pearsons R scripts in Tradingview
@midtownsk8rguy
@TradeBoneDogs
@x11joe
Also thanking Tradingview for providing us such an awesome community and platform :)
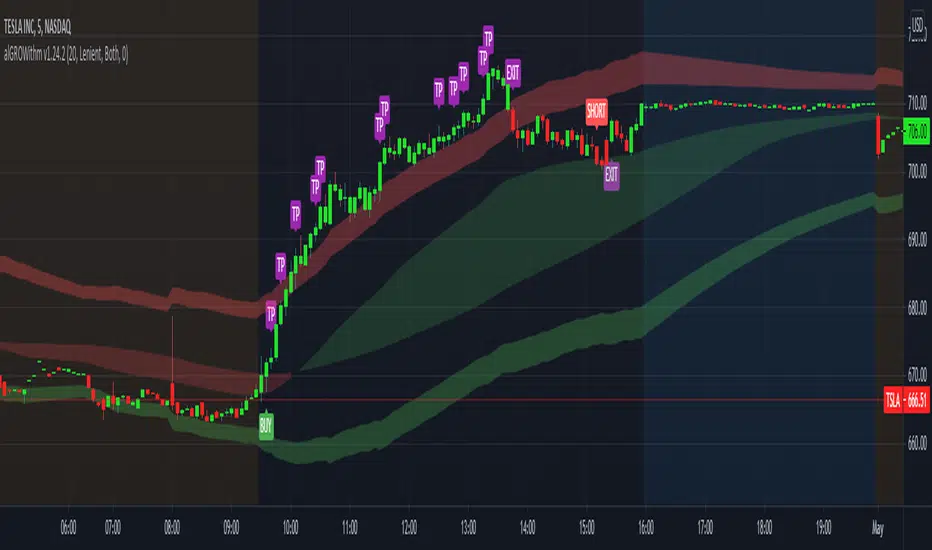
alGROWithm PremiumIntroducing the alGROWithm indicator!
Years of trading experience and endless hours of screen time has undeniably proven to me that the most fundamental rule of any market is: price moves from supply to supply and demand to demand. Specifically, this means that a breakout of a supply zone , the probability of it reaching the next supply zone before starting consolidate is very high. Similarly, a breakdown from previous demand zone will likely continue to the next demand zone . The identification method of these supply and demand channels is one of the features that sets this indicator apart from other available tools.
What separates alGROWithm from other available tools?
- Proprietary method for identifying supply & demand channels combined with a directional bias computation based on recent historical prices
- Only signaling precise entries based on supply & demand that maximize R/R
- Tracking open positions and displaying a trading plan directly on the chart immediately after signaling entry points
- Indicating precise exit levels to help you avoid exiting too early or trading by emotion
What are the features included in alGROWithm?
Trading Plan Lines : These are the Buy/Short/Take Profit/Exit lines plotted directly on the chart
Show Long Signals : These are the green "BUY" labels that appear on the chart when alGROWithm identifies a critical breakout to the next supply level
Show Short Signals : These are the red "SHORT" labels that appear on the chart when alGROWithm identifies a critical breakdown to the next demand level
Show Take Profit Signals : These are the purple "TP" labels that appear on the chart when alGROWithm identifies that the subsequent supply/ demand level has been hit
Show Exit/Stop Loss Signals : These are the purple "EXIT" labels that appear on the chart when alGROWithm identifies that the trade has run its course and it's time to exit
Show Dashboard : This is a dashboard that is displayed to the right of the latest candle, and contains the following information:
- Current Position : "Long", "Short", or "None"
- Next Profit Target : Only displays if there is an active Position
- Current Bias : alGROWithm computes a directional bias based on recent historical prices. Text will say "Long" or "Short"
- Long/Short Bias Until : alGROWithm's bias will change if this price is hit. Note that these are not BUY or SELL levels - this simply indicates whether things are looking up or down
- Enter Short/Long At : Only displays if Current Position = "None"
Note that you can enable/disable any of these chart overlays at anytime through the indicator settings.
The alGROWithm indicator works on any timeframe, any market, and standard OR Heikin Ashi candlesticks .
I have been working very hard on this indicator and I personally use it on a daily basis with options trading. I am so excited to share the wealth with you!
You can use the link below to visit our website and gain access to the script.
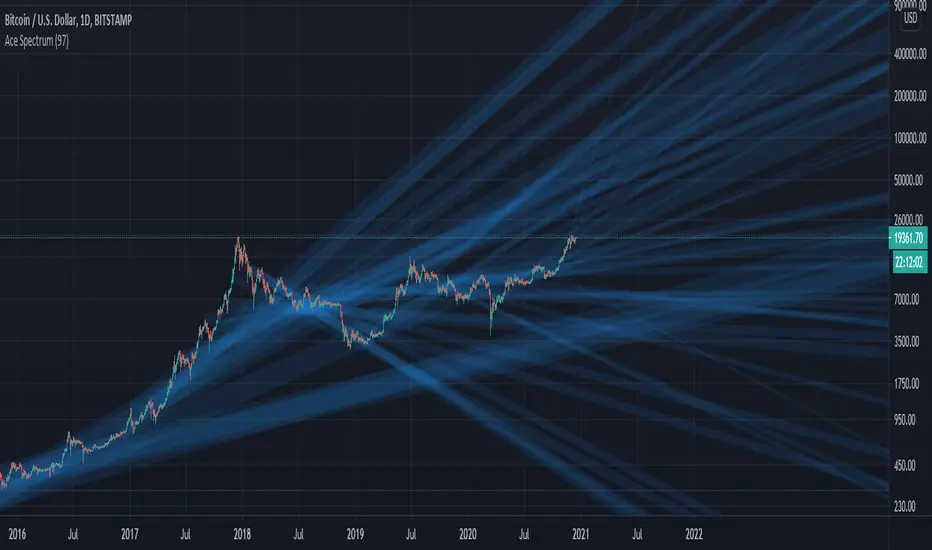
Daily Play Ace SpectrumSo the idea of the Daily Play Ace Spectrum is to extend the Ace Spectrum .
By exposing more parameters, making a variation of the Ace Spectrum which is more configurable.
The idea is this makes the Daily Play Ace Spectrum more suitable for use on shorter (hourly and minute) time scales.
These specific parameters exposed still maintain the original form of the original Ace Spectrum, but loosen up the hard coded assumptions of the original indicator.
By exposing more parameters this now makes the Daily Ace Spectrum more sensitive to input.
Meaning the parameters you choose are important and will set the characteristic reaction of the indicator to the series you give it.
This presents a trade-off, the simplicity of the original indicator is sacrificed.
But what's gained is a more comprehensive indicator that now needs more careful parameter adjustment .
Related to the Ace Spectrum:

Linear Regression ChannelHello Traders,
There are several nice Linear Regression Channel scripts in the Public Library. and I tried to make one with some extra features too. This one can check if the Price breaks the channel and it shows where is was broken. Also it checks the momentum of the channel and shows it's increasing/decreasing/equal in a label, shape of the label also changes. The line colors change according to direction.
using the options, you can;
- Set the Source (Close, HL2 etc)
- Set the Channel length
- Set Deviation
- Change Up/Down Line colors
- Show/hide broken channels
- Change line width
meaning of arrows:
⇑ : Uptrend and moment incresing
⇗ : Uptrend and moment decreasing
⇓ : Downtrend and moment incresing
⇘ : Downtrend and moment decreasing
⇒ : No trend
An example for how color of lines, arrow direction and shape of label change.
Enjoy!

Tech Primary AnalysisThe indicator consists of four main parts, the main SR/Rejection the solid black line, the Second SR, Trend channels the dashed line , and Alerts.
The Main SR/ Rejection point is used to indicate a rejection of a candlestick .
This first type of rejection is identified by a default black line to represent a low zone in the market for that trade.
The Second SR shows a pivot point on the chart; it is presented as a dotted line often near the main SR/Rejection.
When a rejection and pivot point are near each other, it indicates a strong zone.
Trend channels are moving averages, they also have 2 standard deviations that instruct you on when it is best to buy into a trade and when it is best to sell and leave the trade.
You buy low and sell higher for the maximum profit. Lastly, there are alerts;
set an alert for the main rejection line when you want to follow the trend channel, or use it for the when the second resistance is broken, or when the support is broken.
Another important technique is knowing when to trade.
Trading is best in intervals of four hours. Trading at 9am, 1pm, 5pm, 9pm, and 1am will get you into the beginning of the trade to better watch the trend channels.
Another important factor to remember is setting the stop loss which should be a previous rejection
Works on all markets : Forex, Crypto, Options Stocks
Use the link below to obtain access to this indicator or PM us to obtain access

RG+B [Intromoto]Hey folks.
This is an experimental guppy formed from regression lines, instead of the normal EMAs. There are 8 regression plots in total, starting from 25, and progressing in increments of 25, ending in 200.
I've added a bias color in the background to assist in trend directions for when price is above all regression lines or below all regression lines.
Please DM me for trial/access.
Thanks.

Linear Regression Slope HistogramThis is the slope of linear regression plotted as a histogram. It has a threshold for the slope in case there is a minimum slope amount that the user wants for it to show green or red. The color shows a dim and bright effect depending on the direction of the slope to better show its rise and fall. You can set the length of the slope in the input setting screen.
Some interesting things about linear regression slope that I found out: It kind of looks like the histogram of ADX or the directional movement lines depending on the length used for the slope. According to Tushar Chande, linear regression can be used as an alternative of finding trend direction, although it is hard to say what length to use for it, I haven't been able to figure out a good way to apply it yet. According to Bulkowski, linear regression of the volume can be used with certain chart patterns that he listed to increase their chance of success by taking trades where the linear regression line points towards, so if you use volume as a source on this indicator you can take trades in whatever said direction. Got any other ideas on how to use linear regression? Feel free to let me knows, would gladly appreciate it.

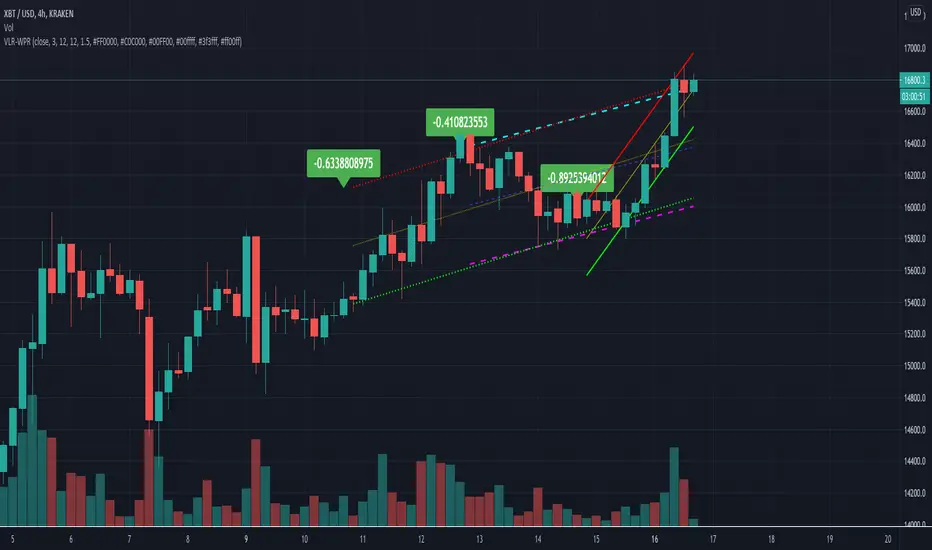
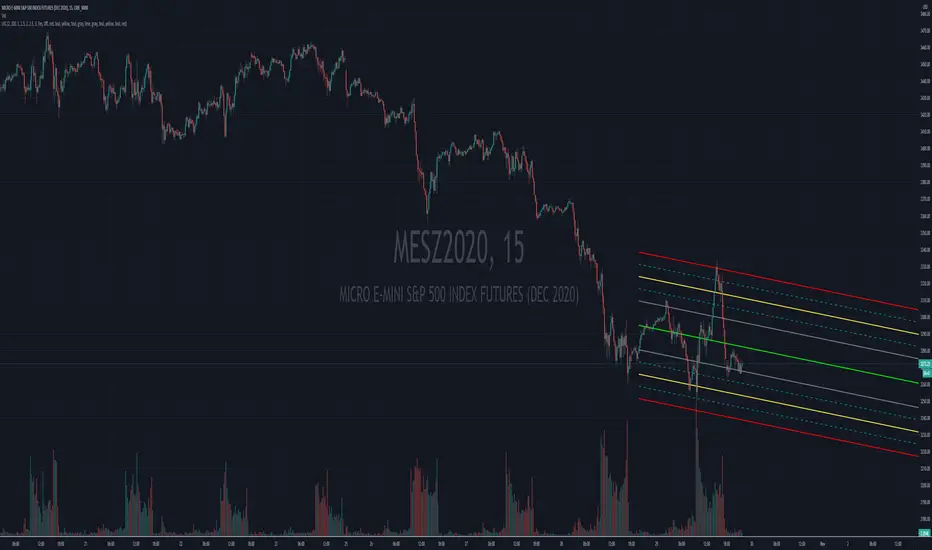
Variable Linear Regression With Pearsons R OscillatorThis is the Oscillator that is meant to go with the Variable Linear Regression With Pearsons R Script. Set this to match the settings you have on the other script.
To use this, you want to do trades something like this:
The bottom -0.80 (green line) means that the trend is very strong in the upward direction. This almost always means it's about to finish its trend soon and reverse the other direction. If you see the other linear regression lines also coincide with this result it would best to get ready to reverse your position and do a short once some other indicators show you it is turning the other direction in addition to this.
The reverse for longing would be the case after a large downtrend and the 0.80 line (red line) is touched by many of the linear regressions, usually it means the downtrend is ending and there is a good buy opportunity soon.
This is called a variable linear regression systems because you can set as many variable linear regressions as you want. I have capped it at 10 but you can modify the code to raise this if really necessary. Every color is customizable for each different linear regression trend.

Variable Linear Regression With Pearsons RThis script allows you to set a variable number of linear regressions with alternating colors you can select. It will have a partner oscillator script shortly so you can see how the different trends change and interact with each other over time.
The script is currently very slow if you set the period for the linear regression too high. I recommend not going past 100. Works very well on the high time frames for this reason.
Anyone that knows of a faster way to run these calculations please let me know!
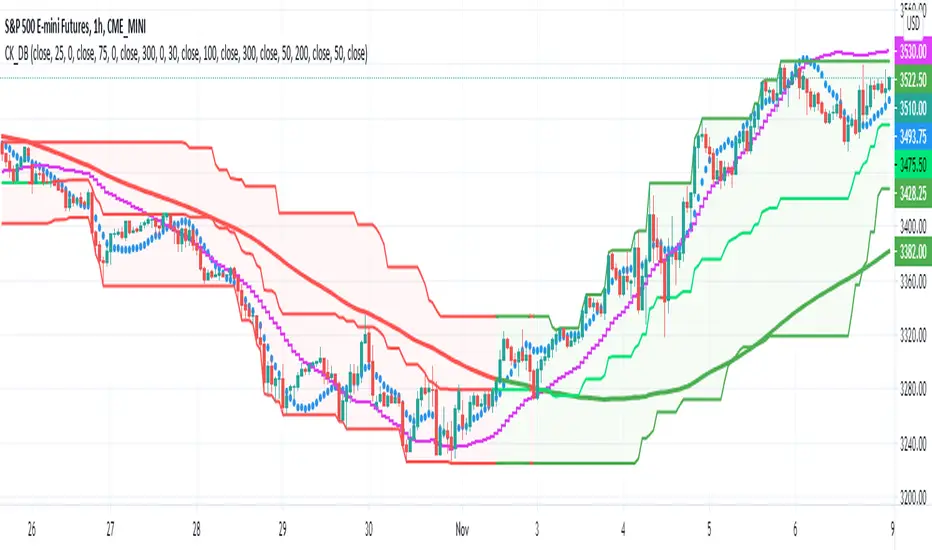
Donchian BlasterRelease Note:
Keeping in mind of getting full potential of Donchian Channels, As part of this script, Linear Regression is used as primary source to identify trend and execute the trades.
Hull Moving Average given as alternative option in place of Linear regression.
Linear Regression:
Linear regression used to identify trend, trade setup, and stop. Based on this, Color fillings on Donchian channels is updated. That will give clear idea of strength or weakness in any trading instruments.
HMA:
HMA used as alternative to identify trend, trade setup, and stop. Based on this, Color fillings on Donchian channels is updated. That will give clear idea of strength or weakness in any trading instruments.
Donchian Channels:
As it is one of the oldest trend riding system, combined here with differentiation in color will help to go with the trend.
Inputs:
Input periods can be changed by users/traders as per their understanding and observations.
//Disclaimer: Idea of publishing this script is to identify the strength of the instrument using multiple confirmation.
//Disclaimer: Using this indicator, changing inputs, and trading decisions are up to the users/traders.
//Courtesy: Thanks to Richard Donchian, Alan Hull, and author of LSMA as this indicator/script inspired by Donchian Channels, Hull Moving Average, and LSMA
Auto Linear Regression ChannelA Linear Regression Channel gives more objective potential buy and sell signals based on price volatility. It consists of three parts:
Linear Regression Line: A Linear Regression Line is a straight line that best fits the prices between a starting price point and an ending price point. A "best fit" means that a line is constructed where there is the least amount of space between the price points and the actual Linear Regression Line. The Linear Regression Line is mainly used to determine trend direction.
Traders usually view the Linear Regression Line as the fair value price for the stocks. When prices deviate above or below, traders may expect prices to go back towards the Linear Regression Line. As a consequence, when prices are below the Linear Regression Line, this could be viewed by some traders as a good time to buy, and when prices are above the Linear Regression Line, a trader might sell. Of course other technical indicators would be used to confirm these inexact buy and sell signals.
Upper Channel Line: A line that runs parallel to the Linear Regression Line and is usually one to two standard deviations above the Linear Regression Line.
Lower Channel Line: This line runs parallel to the Linear Regression Line and is usually one to two standard deviations below the Linear Regression Line.
The upper and lower channel lines contain between themselves either 68% of all prices (if 1 standard deviation is used) or 95% of all prices (if 2 standard deviations are used). When prices break outside of the channels, either: Buy or sell opportunities are present. Or the prior trend could be ending.
Linear Regression Channel Possible Buy Signal
When price falls below the lower channel line, and a trader expects a continuation of the trend, then a trader might consider it as a buy signal.
Linear Regression Channel Possible Sell Signal
An opportunity for selling might occur when prices break above the upper channel line, but a continuation of the trend is expected by the trader. Other confirmation signs like prices closing back inside the linear regression channel might be used to initiate potential buy or sell orders. Also, other technical indicators might be used to confirm.
Trend Reversals
When price closes outside of the Linear Regression Channel for long periods of time, this is often interpreted as an early signal that the past price trend may be breaking and a significant reversal might be near. Linear Regression Channels are quite useful technical analysis charting tools. In addition to identifying trends and trend direction, the use of standard deviation gives traders ideas as to when prices are becoming overbought or oversold relative to the long term trend.
Default Parameters:
Period: (100) The number of bars to use in the calculation.
This Linear Regression Channel Has 1st, 2nd, and 3rd Deviation lines also the MId Deviation Lines are added for 1.5 and 2.5 area.
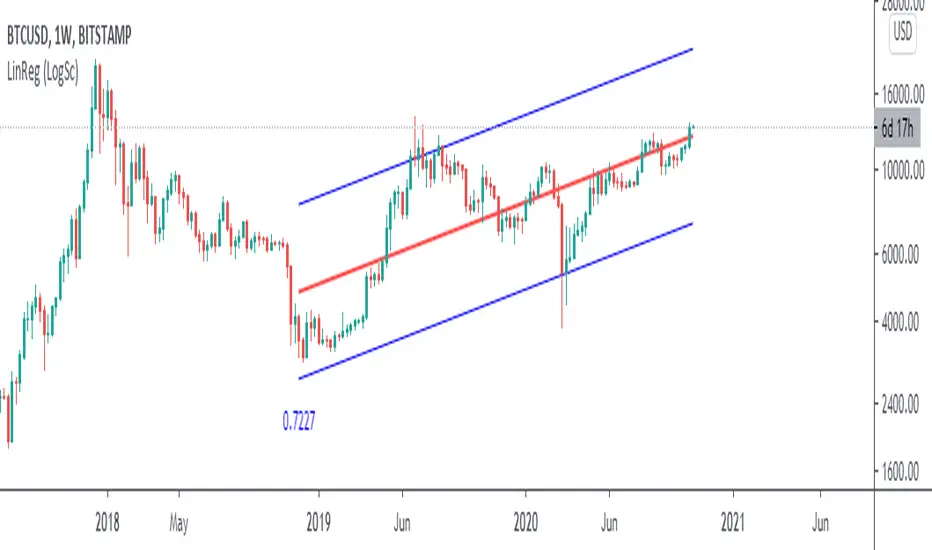
Linear Regression (Log Scale)This code is a slightly modified version of Tradingviews' built-in "linear regression" script which can be correctly plotted on logarithmic charts.
Logarithmic regressionLogarithmic regression (or known as Tseng's tunnels), is used to model data where growth or decay accelerates rapidly at first and then slows over time.
This model is for the long term series data (such as 10 years time span).
The user can consider entering the market when the price below 25% or 5% confidence and consider take profit when the price goes above 75% or 95% confidence line.
Technical issues
*The user have to pan over the chart from the beginning to the end of the study range (such as 10 years of bars) so the pine script could generate those regression lines on the chart.
*If on the chart the number of bar is less than the lookback period, it won't generate any lines as well

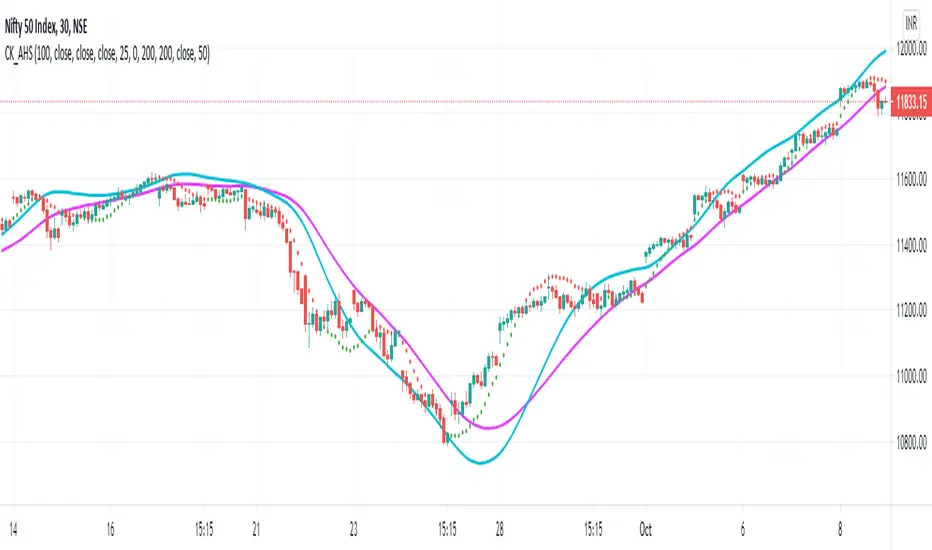
Adjacent HMA StopRelease Note:
This indicator script setup is published to identify the strength and ride the trends.
HMA:
HMA 100 period is used as default. However this can be changed as per wish. Major turning points or decisions can be made using this HMA line. Purple color is used to identify this. This can be used as the final extreme stop for any trend before it turns.
Adjacent Line:
Blue colored Adjacent line can be used to determine the trend strength or ride the trend till it slows down. When trending move happens it can be ride till the candles comes within this Adjacent line. And then sideways move or the moves between HMA & Adjacent line can be traded
Stop:
Dotted lines in Red and Green colors are used as very tight stop. This can be also used as first level of profit booking when very strong move happens.
Trend View:
There is an optional 'Trend View' which can be used to determined the trend.
Disclaimer:
//This script/indicator published with the idea of finding the strength of any instruments. Trade decisions and execution are up to the traders/users as per their understanding
//Courtesy: Thanks to Alan Hull and Richard Donchian as some of the concepts are inspired from them
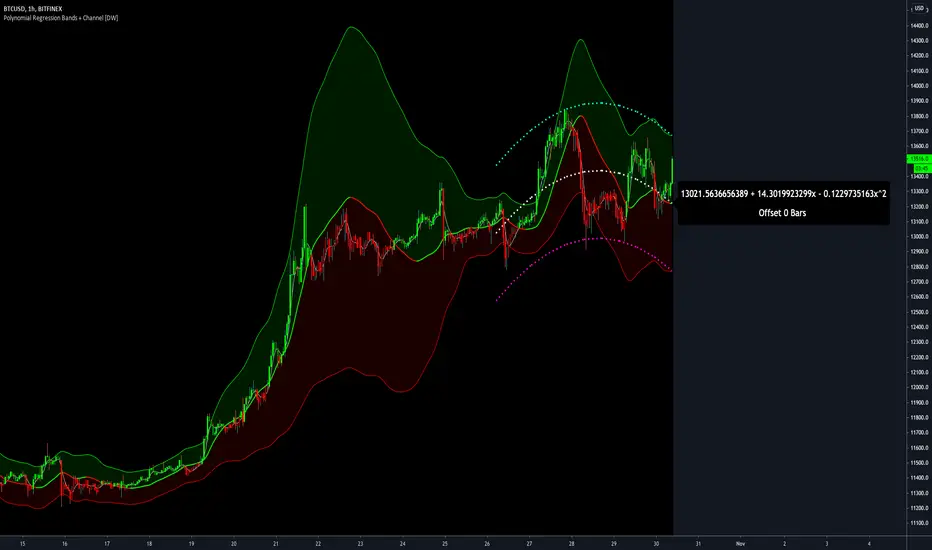
Polynomial Regression Bands + Channel [DW]This is an experimental study designed to calculate polynomial regression for any order polynomial that TV is able to support.
This study aims to educate users on polynomial curve fitting, and the derivation process of Least Squares Moving Averages (LSMAs).
I also designed this study with the intent of showcasing some of the capabilities and potential applications of TV's fantastic new array functions.
Polynomial regression is a form of regression analysis in which the relationship between the independent variable x and the dependent variable y is modeled as a polynomial of nth degree (order).
For clarification, linear regression can also be described as a first order polynomial regression. The process of deriving linear, quadratic, cubic, and higher order polynomial relationships is all the same.
In addition, although deriving a polynomial regression equation results in a nonlinear output, the process of solving for polynomials by least squares is actually a special case of multiple linear regression.
So, just like in multiple linear regression, polynomial regression can be solved in essentially the same way through a system of linear equations.
In this study, you are first given the option to smooth the input data using the 2 pole Super Smoother Filter from John Ehlers.
I chose this specific filter because I find it provides superior smoothing with low lag and fairly clean cutoff. You can, of course, implement your own filter functions to see how they compare if you feel like experimenting.
Filtering noise prior to regression calculation can be useful for providing a more stable estimation since least squares regression can be rather sensitive to noise.
This is especially true on lower sampling lengths and higher degree polynomials since the regression output becomes more "overfit" to the sample data.
Next, data arrays are populated for the x-axis and y-axis values. These are the main datasets utilized in the rest of the calculations.
To keep the calculations more numerically stable for higher periods and orders, the x array is filled with integers 1 through the sampling period rather than using current bar numbers.
This process can be thought of as shifting the origin of the x-axis as new data emerges.
This keeps the axis values significantly lower than the 10k+ bar values, thus maintaining more numerical stability at higher orders and sample lengths.
The data arrays are then used to create a pseudo 2D matrix of x power sums, and a vector of x power*y sums.
These matrices are a representation the system of equations that need to be solved in order to find the regression coefficients.
Below, you'll see some examples of the pattern of equations used to solve for our coefficients represented in augmented matrix form.
For example, the augmented matrix for the system equations required to solve a second order (quadratic) polynomial regression by least squares is formed like this:
(∑x^0 ∑x^1 ∑x^2 | ∑(x^0)y)
(∑x^1 ∑x^2 ∑x^3 | ∑(x^1)y)
(∑x^2 ∑x^3 ∑x^4 | ∑(x^2)y)
The augmented matrix for the third order (cubic) system is formed like this:
(∑x^0 ∑x^1 ∑x^2 ∑x^3 | ∑(x^0)y)
(∑x^1 ∑x^2 ∑x^3 ∑x^4 | ∑(x^1)y)
(∑x^2 ∑x^3 ∑x^4 ∑x^5 | ∑(x^2)y)
(∑x^3 ∑x^4 ∑x^5 ∑x^6 | ∑(x^3)y)
This pattern continues for any n ordered polynomial regression, in which the coefficient matrix is a n + 1 wide square matrix with the last term being ∑x^2n, and the last term of the result vector being ∑(x^n)y.
Thanks to this pattern, it's rather convenient to solve the for our regression coefficients of any nth degree polynomial by a number of different methods.
In this script, I utilize a process known as LU Decomposition to solve for the regression coefficients.
Lower-upper (LU) Decomposition is a neat form of matrix manipulation that expresses a 2D matrix as the product of lower and upper triangular matrices.
This decomposition method is incredibly handy for solving systems of equations, calculating determinants, and inverting matrices.
For a linear system Ax=b, where A is our coefficient matrix, x is our vector of unknowns, and b is our vector of results, LU Decomposition turns our system into LUx=b.
We can then factor this into two separate matrix equations and solve the system using these two simple steps:
1. Solve Ly=b for y, where y is a new vector of unknowns that satisfies the equation, using forward substitution.
2. Solve Ux=y for x using backward substitution. This gives us the values of our original unknowns - in this case, the coefficients for our regression equation.
After solving for the regression coefficients, the values are then plugged into our regression equation:
Y = a0 + a1*x + a1*x^2 + ... + an*x^n, where a() is the ()th coefficient in ascending order and n is the polynomial degree.
From here, an array of curve values for the period based on the current equation is populated, and standard deviation is added to and subtracted from the equation to calculate the channel high and low levels.
The calculated curve values can also be shifted to the left or right using the "Regression Offset" input
Changing the offset parameter will move the curve left for negative values, and right for positive values.
This offset parameter shifts the curve points within our window while using the same equation, allowing you to use offset datapoints on the regression curve to calculate the LSMA and bands.
The curve and channel's appearance is optionally approximated using Pine's v4 line tools to draw segments.
Since there is a limitation on how many lines can be displayed per script, each curve consists of 10 segments with lengths determined by a user defined step size. In total, there are 30 lines displayed at once when active.
By default, the step size is 10, meaning each segment is 10 bars long. This is because the default sampling period is 100, so this step size will show the approximate curve for the entire period.
When adjusting your sampling period, be sure to adjust your step size accordingly when curve drawing is active if you want to see the full approximate curve for the period.
Note that when you have a larger step size, you will see more seemingly "sharp" turning points on the polynomial curve, especially on higher degree polynomials.
The polynomial functions that are calculated are continuous and differentiable across all points. The perceived sharpness is simply due to our limitation on available lines to draw them.
The approximate channel drawings also come equipped with style inputs, so you can control the type, color, and width of the regression, channel high, and channel low curves.
I also included an input to determine if the curves are updated continuously, or only upon the closing of a bar for reduced runtime demands. More about why this is important in the notes below.
For additional reference, I also included the option to display the current regression equation.
This allows you to easily track the polynomial function you're using, and to confirm that the polynomial is properly supported within Pine.
There are some cases that aren't supported properly due to Pine's limitations. More about this in the notes on the bottom.
In addition, I included a line of text beneath the equation to indicate how many bars left or right the calculated curve data is currently shifted.
The display label comes equipped with style editing inputs, so you can control the size, background color, and text color of the equation display.
The Polynomial LSMA, high band, and low band in this script are generated by tracking the current endpoints of the regression, channel high, and channel low curves respectively.
The output of these bands is similar in nature to Bollinger Bands, but with an obviously different derivation process.
By displaying the LSMA and bands in tandem with the polynomial channel, it's easy to visualize how LSMAs are derived, and how the process that goes into them is drastically different from a typical moving average.
The main difference between LSMA and other MAs is that LSMA is showing the value of the regression curve on the current bar, which is the result of a modelled relationship between x and the expected value of y.
With other MA / filter types, they are typically just averaging or frequency filtering the samples. This is an important distinction in interpretation. However, both can be applied similarly when trading.
An important distinction with the LSMA in this script is that since we can model higher degree polynomial relationships, the LSMA here is not limited to only linear as it is in TV's built in LSMA.
Bar colors are also included in this script. The color scheme is based on disparity between source and the LSMA.
This script is a great study for educating yourself on the process that goes into polynomial regression, as well as one of the many processes computers utilize to solve systems of equations.
Also, the Polynomial LSMA and bands are great components to try implementing into your own analysis setup.
I hope you all enjoy it!
--------------------------------------------------------
NOTES:
- Even though the algorithm used in this script can be implemented to find any order polynomial relationship, TV has a limit on the significant figures for its floating point outputs.
This means that as you increase your sampling period and / or polynomial order, some higher order coefficients will be output as 0 due to floating point round-off.
There is currently no viable workaround for this issue since there isn't a way to calculate more significant figures than the limit.
However, in my humble opinion, fitting a polynomial higher than cubic to most time series data is "overkill" due to bias-variance tradeoff.
Although, this tradeoff is also dependent on the sampling period. Keep that in mind. A good rule of thumb is to aim for a nice "middle ground" between bias and variance.
If TV ever chooses to expand its significant figure limits, then it will be possible to accurately calculate even higher order polynomials and periods if you feel the desire to do so.
To test if your polynomial is properly supported within Pine's constraints, check the equation label.
If you see a coefficient value of 0 in front of any of the x values, reduce your period and / or polynomial order.
- Although this algorithm has less computational complexity than most other linear system solving methods, this script itself can still be rather demanding on runtime resources - especially when drawing the curves.
In the event you find your current configuration is throwing back an error saying that the calculation takes too long, there are a few things you can try:
-> Refresh your chart or hide and unhide the indicator.
The runtime environment on TV is very dynamic and the allocation of available memory varies with collective server usage.
By refreshing, you can often get it to process since you're basically just waiting for your allotment to increase. This method works well in a lot of cases.
-> Change the curve update frequency to "Close Only".
If you've tried refreshing multiple times and still have the error, your configuration may simply be too demanding of resources.
v4 drawing objects, most notably lines, can be highly taxing on the servers. That's why Pine has a limit on how many can be displayed in the first place.
By limiting the curve updates to only bar closes, this will significantly reduce the runtime needs of the lines since they will only be calculated once per bar.
Note that doing this will only limit the visual output of the curve segments. It has no impact on regression calculation, equation display, or LSMA and band displays.
-> Uncheck the display boxes for the drawing objects.
If you still have troubles after trying the above options, then simply stop displaying the curve - unless it's important to you.
As I mentioned, v4 drawing objects can be rather resource intensive. So a simple fix that often works when other things fail is to just stop them from being displayed.
-> Reduce sampling period, polynomial order, or curve drawing step size.
If you're having runtime errors and don't want to sacrifice the curve drawings, then you'll need to reduce the calculation complexity.
If you're using a large sampling period, or high order polynomial, the operational complexity becomes significantly higher than lower periods and orders.
When you have larger step sizes, more historical referencing is used for x-axis locations, which does have an impact as well.
By reducing these parameters, the runtime issue will often be solved.
Another important detail to note with this is that you may have configurations that work just fine in real time, but struggle to load properly in replay mode.
This is because the replay framework also requires its own allotment of runtime, so that must be taken into consideration as well.
- Please note that the line and label objects are reprinted as new data emerges. That's simply the nature of drawing objects vs standard plots.
I do not recommend or endorse basing your trading decisions based on the drawn curve. That component is merely to serve as a visual reference of the current polynomial relationship.
No repainting occurs with the Polynomial LSMA and bands though. Once the bar is closed, that bar's calculated values are set.
So when using the LSMA and bands for trading purposes, you can rest easy knowing that history won't change on you when you come back to view them.
- For those who intend on utilizing or modifying the functions and calculations in this script for their own scripts, I included debug dialogues in the script for all of the arrays to make the process easier.
To use the debugs, see the "Debugs" section at the bottom. All dialogues are commented out by default.
The debugs are displayed using label objects. By default, I have them all located to the right of current price.
If you wish to display multiple debugs at once, it will be up to you to decide on display locations at your leisure.
When using the debugs, I recommend commenting out the other drawing objects (or even all plots) in the script to prevent runtime issues and overlapping displays.
RSI with Self-Adjusting Linear Regression Bands (Expo)RSI with Self-Adjusting Linear Regression Bands (Expo) makes use of RSI and Linear Regression to create an RSI that follows the current trend. The indicator has an upper and lower self-adjusting Linear Regression Band that act as RSI boundaries.
HOW TO USE
The indicator can be used in multiple ways, for instance, to find overbought and oversold areas. Or to identify trends as well as pullbacks in trends.
INDICATOR IN ACTION
This indicator is a modification of RafaelZioni's work "Linear Regression Trend bands"
Credit to: RafaelZioni
I hope you find this indicator useful , and please comment or contact me if you like the script or have any questions/suggestions for future improvements. Thanks!
I will continually work on this indicator, so please share your experience and feedback as it will enable me to make even better improvements. Thanks to everyone that has already contacted me regarding my scripts. Your feedback is valuable for future developments!
-----------------
Disclaimer
Copyright by Zeiierman.
The information contained in my scripts/indicators/ideas does not constitute financial advice or a solicitation to buy or sell any securities of any type. I will not accept liability for any loss or damage, including without limitation any loss of profit, which may arise directly or indirectly from the use of or reliance on such information.
All investments involve risk, and the past performance of a security, industry, sector, market, financial product, trading strategy, or individual’s trading does not guarantee future results or returns. Investors are fully responsible for any investment decisions they make. Such decisions should be based solely on an evaluation of their financial circumstances, investment objectives, risk tolerance, and liquidity needs.
My scripts/indicators/ideas are only for educational purposes!
