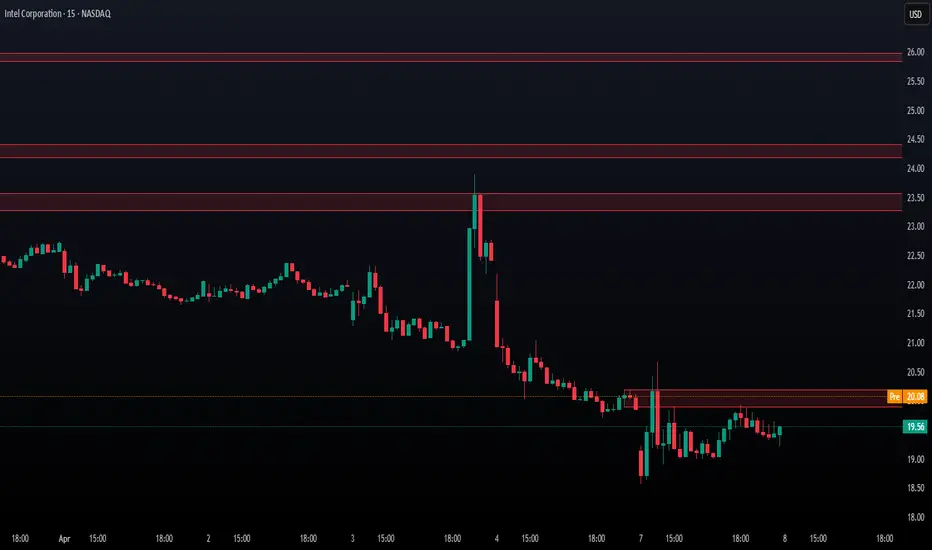
Liquidity Levels.OVERVIEW
This indicator marks resting liquidity on the chart by drawing horizontal lines at confirmed swing highs and swing lows. In price-action and Smart Money concepts, swing highs tend to hold buy-side liquidity (buy stops from breakout buyers and short-sellers' protective stops), while swing lows tend to hold sell-side liquidity (sell stops). Visualising these levels helps traders see where orders are likely resting and where price may be drawn before continuing or reversing.
HOW IT WORKS
Indicator