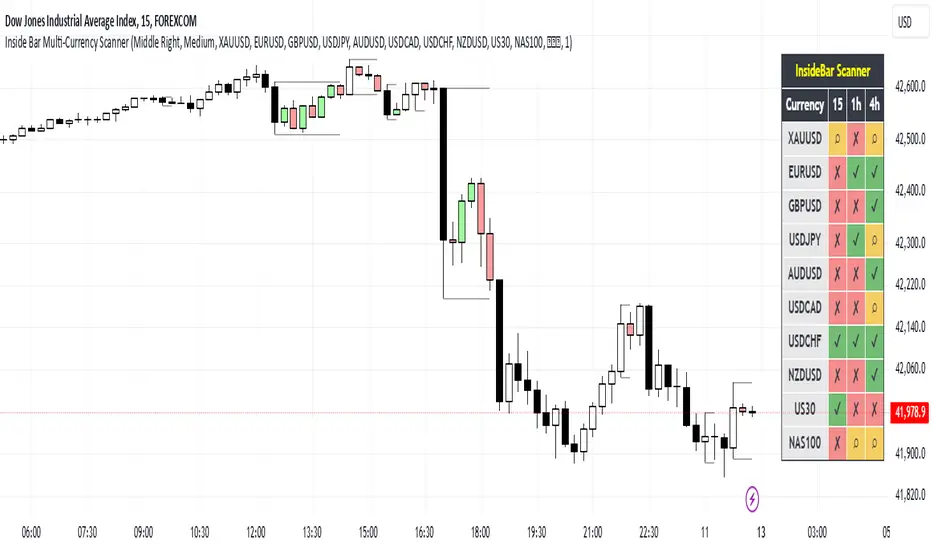
Multi-Symbol Trend MatrixMulti-Symbol Trend Matrix shows the trend of up to 8 symbols across 4 timeframes in one table, so you can see at a glance what is trending, what is weak, and whether the overall market is risk-on or risk-off.
How it works:
Each symbol and timeframe is classified with the same rules as MTF Trend Dashboard:
- Bullish (▲): price above the fast EMA, fast EMA above the slow EMA, and RSI above 50
- Bearish (▼): price below the fast EMA, fast EMA below the slow EMA, and RSI below 50
- Neutral (•): any
Indicator