CPR by NKDCentral Pivot Range (CPR) Trading Strategy:
The Central Pivot Range (CPR) is a widely-used tool in technical analysis, helping traders pinpoint potential support and resistance levels in the market. By using the CPR effectively, traders can better gauge market trends and determine favorable entry and exit points. This guide explores how the CPR works, outlines its calculation, and describes how traders can enhance their strategies using an extended 10-line version of CPR.
What Really Central Pivot Range (CPR) is?
At its core, the CPR consists of three key lines:
Pivot Point (PP) – The central line, calculated as the average of the previous day’s high, low, and closing prices.
Upper Range (R1) – Positioned above the Pivot Point, acting as a potential ceiling where price may face resistance.
Lower Range (S1) – Found below the Pivot Point, serving as a potential floor where price might find support.
Advanced traders often expand on the traditional three-line CPR by adding extra levels above and below the pivot, creating up to a 10-line system. This extended CPR allows for a more nuanced understanding of the market and helps identify more detailed trading opportunities.
Applying CPR for Trading Success
1. How CPR is Calculation
The CPR relies on the previous day's high (H), low (L), and close (C) prices to create its structure:
Pivot Point (PP) = (H + L + C) / 3
First Resistance (R1) = (2 * PP) - L
First Support (S1) = (2 * PP) - H
Additional resistance levels (R2, R3) and support levels (S2, S3) are calculated by adding or subtracting multiples of the previous day’s price range (H - L) from the Pivot Point.
2. Recognizing the Market Trend
To effectively trade using CPR, it’s essential to first determine whether the market is trending up (bullish) or down (bearish). In an upward-trending market, traders focus on buying at support levels, while in a downward market, they look to sell near resistance.
3. Finding Ideal Entry Points
Traders often look to enter trades when price approaches key levels within the CPR range. Support levels (S1, S2) offer buying opportunities, while resistance levels (R1, R2) provide selling opportunities. These points are considered potential reversal zones, where price may bounce or reverse direction.
4. Managing Risk with Stop-Loss Orders
Proper risk management is crucial in any trading strategy. A stop-loss should be set slightly beyond the support level for buy positions and above the resistance level for sell positions, ensuring that losses are contained if the market moves against the trader’s position.
5. Determining Profit Targets
Profit targets are typically set based on the distance between entry points and the next support or resistance level. Many traders apply a risk-reward ratio, aiming for larger potential profits compared to the potential losses. However, if the next resistance and support level is far then middle levels are used for targets (i.e. 50% of R1 and R2)
6. Confirmation Through Other Indicators
While CPR provides strong support and resistance levels, traders often use additional indicators to confirm potential trade setups. Indicators such as moving averages can
help validate the signals provided by the CPR.
7. Monitoring Price Action At CPR Levels
Constantly monitoring price movement near CPR levels is essential. If the price fails to break through a resistance level (R1) or holds firm at support (S1), it can offer cues on when to exit or adjust a trade. However, a strong price break past these levels often signals a continued trend.
8. Trading Breakouts with CPR
When the price breaks above resistance or below support with strong momentum, it may signal a potential breakout. Traders can capitalize on these movements by entering positions in the direction of the breakout, ideally confirmed by volume or other technical indicators.
9. Adapting to Changing Market Conditions
CPR should be used in the context of broader market influences, such as economic reports, news events, or geopolitical shifts. These factors can dramatically affect market direction and how price reacts to CPR levels, making it important to stay informed about external market conditions.
10. Practice and Backtesting for Improvements
Like any trading tool, the CPR requires practice. Traders are encouraged to backtest their strategies on historical price data to get a better sense of how CPR works in different market environments. Continuous analysis and practice help improve decision-making and strategy refinement.
The Advantages of Using a 10-Line CPR System
An extended 10-line CPR system—comprising up to five resistance and five support levels—provides more granular control and insight into market movements. This expanded view helps traders better gauge trends and identify more opportunities for entry and exit. Key benefits include:
R2, S2 Levels: These act as secondary resistance or support zones, giving traders additional opportunities to refine their trade entries and exits.
R3, S3 Levels: Provide an even wider range for identifying reversals or trend continuations in more volatile markets.
Flexibility: The broader range of levels allows traders to adapt to changing market conditions and make more precise decisions based on market momentum.
So in Essential:
The Central Pivot Range is a valuable tool for traders looking to identify critical price levels in the market. By providing a clear framework for identifying potential support and resistance zones, it helps traders make informed decisions about entering and exiting trades. However, it’s important to combine CPR with sound risk management and additional confirmation through other technical indicators for the best results.
Although no trading tool guarantees success, the CPR, when used effectively and combined with practice, can significantly enhance a trader’s ability to navigate market fluctuations.
Multi

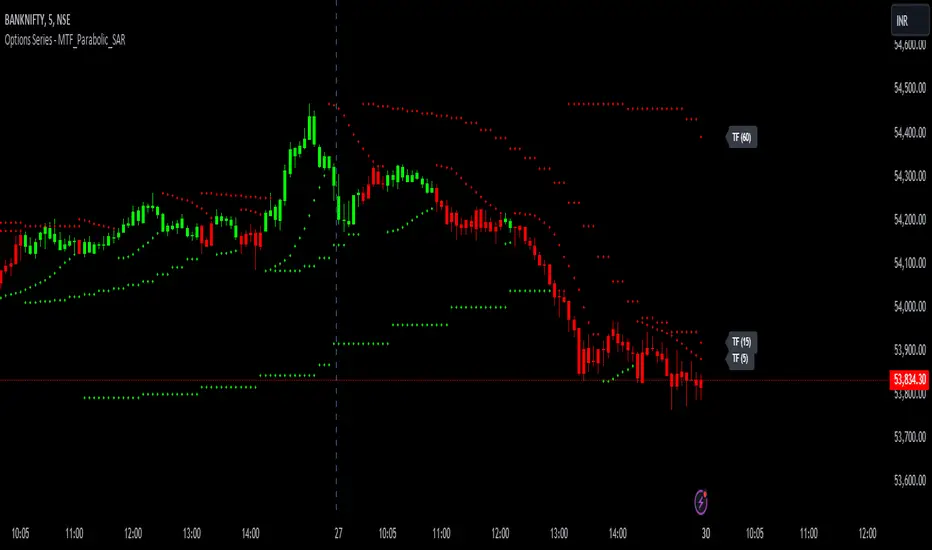
Options Series - MTF_Parabolic_SAR
⭐ Purpose of the Script
This script, titled "Options Series - MTF_Parabolic_SAR," is designed for analyzing price trends using the Parabolic SAR (Stop and Reverse) indicator across multiple timeframes (MTF). It dynamically highlights bullish and bearish conditions, helping traders identify trends with improved accuracy. The script uses the Parabolic SAR across three customizable timeframes (default: 5, 15, and 60 minutes) to gauge the market sentiment.
⭐ Key Features and Insights:
Multi-Timeframe Parabolic SAR: The script calculates the Parabolic SAR for three different timeframes ( input_tf_1 , input_tf_2 , and input_tf_3 ). Traders can configure these timeframes to match their trading style (e.g., intraday, swing).
The SAR plots adapt to the selected timeframe, helping traders see different perspectives of price movement, such as short-term and long-term trends.
Bullish and Bearish Conditions: The script determines bullish and bearish conditions by comparing the close price against the Parabolic SAR in each timeframe.
If at least one timeframe indicates a bullish condition (close price above SAR), the bars are colored green . Conversely, if one timeframe signals bearish conditions (close below SAR), the bars turn red .
This provides an at-a-glance view of the price trend across multiple timeframes, offering insights into the market's strength and direction.
Visual Enhancements: Bar Coloring: Bars are visually enhanced with a color scheme: green for bullish , red for bearish , and gray for neutral conditions. This makes it easy to spot market trends and reversals directly on the chart. Candle Plotting: The current candle is plotted with the corresponding color and labeled with the SAR values for each timeframe. This aids traders in tracking real-time price action.
Labeling of SAR Values: The script displays SAR values for each timeframe as floating labels next to the chart. These labels contain the timeframe and the exact SAR value, making it easier to reference without cluttering the chart.
⭐ Trading Advantages: Customizable and Adaptive: The customizable timeframes and SAR settings allow traders to adapt the script to various market conditions and their specific trading strategies. This flexibility provides a powerful tool for identifying entry and exit points. Multi-Timeframe Insights: By considering multiple timeframes, the script offers a comprehensive market view, making it easier to confirm strong trends and avoid false signals.
⭐ How It Helps Traders: Trend Identification: By visualizing Parabolic SAR across multiple timeframes, traders can quickly assess trend strength and direction. Reversal Detection: The script's color changes (green to red or vice versa) signal potential trend reversals, offering critical information for managing trades and reducing risk.
🚀 Conclusion:
This script provides traders with a multi-timeframe analysis tool for identifying trends and potential reversals using the Parabolic SAR. By offering customizable timeframes, clear visual cues, and SAR value labeling, it simplifies decision-making and enhances market insights.
MENTFX AVERAGES MULTI TIMEFRAMEThe MENTFX AVERAGES MULTIME TIMEFRAME indicator is designed to provide traders with the ability to visualize multiple moving averages (MAs) from higher timeframes on their current chart, regardless of the chart's timeframe. It combines the power of exponential moving averages (EMAs) to help traders identify trends, spot potential reversal points, and make more informed trading decisions.
Key Features:
Multi-Timeframe Moving Averages: This indicator plots moving averages from daily timeframes directly on your chart, helping you keep track of higher timeframe trends while trading in any timeframe.
Customizable Moving Averages: You can adjust the length and visibility of up to three EMAs (default settings are 5, 10, and 20-period EMAs) to suit your trading style.
Overlay on Price: The indicator is designed to be overlaid on your price chart, seamlessly integrating with your existing analysis.
Simple but Effective: By offering a clear visual guide to where price is trading relative to important higher timeframe levels, this indicator helps traders avoid trading against major trends.
Why It’s Unique:
Validation Timeframe Flexibility: Unlike traditional moving average indicators that only work within the same chart's timeframe, the MENTFX AVERAGES M indicator allows you to pull moving averages from higher timeframes (default: Daily) and overlay them on any chart you're currently viewing, whether it's intraday (minutes) or even weekly. This cross-timeframe visibility is critical in determining the true market trend, adding context to your trades.
Customizability: Although the default settings focus on daily EMAs (5, 10, and 20 periods), traders can modify the parameters, including the type of moving average (Simple, Weighted, etc.), making it adaptable for any strategy. Whether you want shorter-term or longer-term averages, this indicator covers your needs.
Trend Confirmation Tool: The use of multiple EMAs helps traders confirm trend direction and potential price breakouts or reversals. For example, when the shorter-term 5 EMA crosses above the 20 EMA, it can signal a potential bullish trend, while the opposite could indicate bearish pressure.
How This Indicator Helps:
Identify Key Support and Resistance Levels: Higher timeframe moving averages often act as dynamic support and resistance. This indicator helps you stay aware of those critical levels, even when trading lower timeframes.
Trend Identification: Knowing where the market is relative to the 5, 10, and 20 EMAs from a higher timeframe gives you a clearer picture of whether you're trading with or against the prevailing trend.
Improved Decision Making: By aligning your trades with the direction of higher timeframe trends, you can increase your confidence in trade entries and exits, avoiding low-probability setups.
Multi-Market Use: This indicator works well across various asset classes—stocks, forex, crypto, and commodities—making it versatile for any trader.
How to Use:
Intraday Trading: Use the daily EMAs as a guide to see if intraday price movements align with longer-term trends.
Swing Trading: Plot daily EMAs to track the strength of a larger trend, using pullbacks to the moving averages as potential entry points.
Trend Trading: Monitor crossovers between the moving averages to signal potential changes in trend direction.
Default Settings:
5 EMA (Daily) – Blue Line
10 EMA (Daily) – Black Line
20 EMA (Daily) – Red Line
These lines will plot on your chart with a subtle opacity (33%) to ensure they don’t obstruct price action, while still providing crucial visual guidance on market trends.
This indicator is perfect for traders who want to blend technical analysis with multi-timeframe insights, helping you stay in sync with broader market movements while executing trades on any timeframe.

H-Infinity Volatility Filter [QuantAlgo]Introducing the H-Infinity Volatility Filter by QuantAlgo 📈💫
Enhance your trading/investing strategy with the H-Infinity Volatility Filter , a powerful tool designed to filter out market noise and identify clear trend signals in volatile conditions. By applying an advanced H∞ filtering process, this indicator assists traders and investors in navigating uncertain market conditions with improved clarity and precision.
🌟 Key Features:
🛠 Customizable Noise Parameters: Adjust worst-case noise and disturbance settings to tailor the filter to various market conditions. This flexibility helps you adapt the indicator to handle different levels of market volatility and disruptions.
⚡️ Dynamic Trend Detection: The filter identifies uptrends and downtrends based on the filtered price data, allowing you to quickly spot potential shifts in the market direction.
🎨 Color-Coded Visuals: Easily differentiate between bullish and bearish trends with customizable color settings. The indicator colors the chart’s candles according to the detected trend for immediate clarity.
🔔 Custom Alerts: Set alerts for trend changes, so you’re instantly informed when the market transitions from bullish to bearish or vice versa. Stay updated without constantly monitoring the charts.
📈 How to Use:
✅ Add the Indicator: Add the H-Infinity Volatility Filter to your favourites and apply it to your chart. Customize the noise and disturbance parameters to match the volatility of the asset you are trading/investing. This allows you to optimize the filter for your specific strategy.
👀 Monitor Trend Shifts: Watch for clear visual signals as the filter detects uptrends or downtrends. The color-coded candles and line plots help you quickly assess market conditions and potential reversals.
🔔 Set Alerts: Configure alerts to notify you when the trend changes, allowing you to react quickly to potential market shifts without needing to manually track price movements.
🌟 How It Works and Academic Background:
The H-Infinity Volatility Filter is built on the foundations of H∞ (H-infinity) control theory , a mathematical framework originating from the field of engineering and control systems. Developed in the 1980s by notable engineers such as George Zames and John C. Doyle , this theory was designed to help systems perform optimally under uncertain and noisy conditions. H∞ control focuses on minimizing the worst-case effects of disturbances and noise, making it a powerful tool for managing uncertainty in complex environments.
In financial markets, where unpredictable price fluctuations and noise often obscure meaningful trends, this same concept can be applied to price data to filter out short-term volatility. The H-Infinity Volatility Filter adopts this approach, allowing traders and investors to better identify potential trends by reducing the impact of random price movements. Instead of focusing on precise market predictions, the filter increases the probability of highlighting significant trends by smoothing out market noise.
This indicator works by processing historical price data through an H∞ filter that continuously adjusts based on worst-case noise levels and disturbances. By considering several past states, it estimates the current price trend while accounting for potential external disruptions that might influence price behavior. Parameters like "worst-case noise" and "disturbance" are user-configurable, allowing traders to adapt the filter to different market conditions. For example, in highly volatile markets, these parameters can be adjusted to manage larger price swings, while in more stable markets, they can be fine-tuned for smoother trend detection.
The H-Infinity Volatility Filter also incorporates a dynamic trend detection system that classifies price movements as bullish or bearish. It uses color-coded candles and plots—green for bullish trends and red for bearish trends—to provide clear visual cues for market direction. This helps traders and investors quickly interpret the trend and act on potential signals. While the indicator doesn’t guarantee accuracy in trend prediction, it significantly reduces the likelihood of false signals by focusing on meaningful price changes rather than random fluctuations.
How It Can Be Applied to Trading/Investing:
By applying the principles of H∞ control theory to financial markets, the H-Infinity Volatility Filter provides traders and investors with a sophisticated tool that manages uncertainty more effectively. Its design makes it suitable for use in a wide range of markets—whether in fast-moving, volatile environments or calmer conditions.
The indicator is versatile and can be used in both short-term trading and medium to long-term investing strategies. Traders can tune the filter to align with their specific risk tolerance, asset class, and market conditions, making it an ideal tool for reducing the effects of market noise while increasing the probability of detecting reliable trend signals.
For investors, the filter can help in identifying medium to long-term trends by filtering out short-term price swings and focusing on the broader market direction. Whether applied to stocks, forex, commodities, or cryptocurrencies, the H-Infinity Volatility Filter helps traders and investors interpret market behavior with more confidence by offering a more refined view of price movements through its noise reduction techniques.
Disclaimer:
The H-Infinity Volatility Filter is designed to assist in market analysis by filtering out noise and volatility. It should not be used as the sole tool for making trading or investment decisions. Always incorporate other forms of analysis and risk management strategies. No statements or signals from this indicator or us should be considered financial advice. Past performance is not indicative of future results.

Multi-Asset Cross Timeframe Divergence Ind. (MACDI) // AlgoFyreThe Multi-Asset Cross Timeframe Divergence Indicator (MACDI) identifies divergences in momentum like RSI across multiple assets and timeframes. It visually highlights lagging correlated asset momentum divergences, helping traders spot inefficiencies and potential trade opportunities in the following asset.
🔶 KEY FEATURES
🔸Average Momentum Trendline for Each Timeframe
The Average Momentum Trendline feature calculates the average momentum of multiple assets over specified timeframes. It uses smoothed values to determine the momentum trend for each timeframe on the average aggregated momentum of both assets. This trendline helps traders identify the overall direction of the market momentum, providing a clearer picture of potential price movements.
🔸Real-time Divergence Indication and Alert Table
The Real-time Divergence Indications and Alert Table feature visualizes detected divergences between the momentum values of the two assets across different timeframes. It identifies both bullish and bearish divergences, signaling lagging reversals in the the following asset and potential trading opportunities. When a divergence is detected, the system generates real-time visual indications on the chart and in an overview table for traders to act promptly. The alert table provides a comprehensive overview of all detected divergences, making it easier for traders to monitor and respond to market changes.
🔸Color and Size Based Labels on Price Chart based on Divergence Type
The Color and Size Based Labels feature visually represents divergences directly on the price chart. Bullish and bearish divergences are marked with distinct colors and sizes, making them easily identifiable at a glance. Larger labels indicate higher timeframes and thus generally more significance.
🔶 INSTRUCTION GUIDELINES
🔸Identify Divergence Clusters
The more divergences align, the higher the probability of a potential trend reversal in the asset. When multiple multi-timeframe divergences occur in both lower and higher timeframes within a local cluster, the probability of a reversal increases. This is valid for both for bullish and bearish divergences.
🔸Spot Low Probability Divergences
To further increase the probability, analyze the current state of the average momentum trendline. For a bullish reversal, a relatively low level of the average momentum trendline is preferred, whereas for a bearish reversal, a relatively high level is preferred.
🔶 INDIVIDUAL CONFIGURATION
🔸Leading Asset
This input allows the user to select the leading asset for the divergence analysis.
🔸Following Asset
This input allows the user to select the following asset for the divergence analysis.
🔸Higher Timeframe
This input sets the higher timeframe for the analysis.
🔸Lower Timeframe
This input sets the lower timeframe for the analysis.
🔸Show RSI Divergence
This input enables or disables the display of RSI divergence signals.
🔸RSI Length
This input sets the length of the RSI calculation.
🔸RSI Source
This input sets the source data for the RSI calculation (e.g., close price).
🔸RSI Smoothing Length
This input sets the length of the smoothing applied to the RSI values.
🔸Smoothing Method
This input sets the method used for smoothing the RSI values.
🔶 CONCLUSION
The Multi-Asset Cross Timeframe Divergence Indicator (MACDI) is a powerful tool for identifying momentum divergences across multiple assets and timeframes. Its visual cues and customizable table make it easy to use and interpret, providing valuable insights for trading decisions.

Custom EMA Multi-Timeframe Indicator [Pineify]
This innovative indicator combines Exponential Moving Averages (EMAs) across multiple timeframes to provide traders with a comprehensive view of market trends and potential trading opportunities. By analyzing short, medium, and long-term EMAs simultaneously, this indicator offers valuable insights into market dynamics and helps identify high-probability entry and exit points.
Key Features
Multi-timeframe analysis using customizable EMAs
Visual representation of trend alignment across different timeframes
Customizable EMA lengths and sources for each timeframe
Buy and sell signals based on EMA crossovers
Alert functionality for real-time trade notifications
How It Works
The Custom EMA Multi-Timeframe Indicator calculates three separate EMAs:
1. Short-term EMA: Represents immediate market sentiment
2. Medium-term EMA: Captures intermediate trend direction
3. Long-term EMA: Reflects the overall market trend
These EMAs are plotted on the chart using different colors for easy identification. The indicator generates buy and sell signals based on the relative positions of these EMAs, providing traders with clear visual cues for potential trade entries and exits.
Trading Ideas and Insights
This indicator offers several powerful trading concepts:
Trend Alignment: When all three EMAs are aligned (short above medium above long), it indicates a strong trend. Traders can look for pullbacks to enter in the direction of the trend.
Trend Reversal: When the short-term EMA crosses above or below both the medium and long-term EMAs, it may signal a potential trend reversal. This can be used to exit existing positions or enter new trades in the opposite direction.
Range-bound Markets: When the EMAs are tightly grouped together, it suggests a consolidation phase. Traders can wait for a breakout or use range-trading strategies.
Momentum Confirmation: The speed at which the short-term EMA diverges from or converges with the longer-term EMAs can indicate the strength of the current move.
Unique Aspects
What sets this indicator apart is its ability to synthesize information from multiple timeframes into a single, easy-to-interpret visual display. Unlike traditional single-timeframe EMAs, this indicator provides a more holistic view of market trends, reducing false signals and improving trade timing.
The customizable nature of the indicator allows traders to adapt it to various trading styles and market conditions. By adjusting the EMA lengths and sources, traders can fine-tune the indicator to their specific needs and preferences.
How to Use
1. Apply the indicator to your chart
2. Customize the timeframes and EMA settings as desired
3. Look for buy signals when the short and medium EMAs cross above the long EMA
4. Look for sell signals when the short and medium EMAs cross below the long EMA
5. Use the relative positions of the EMAs to gauge overall trend strength and direction
6. Combine with other technical analysis tools for confirmation
Customization
The indicator offers extensive customization options:
Short, medium, and long timeframes can be adjusted
EMA lengths for each timeframe are customizable
EMA source (close, open, high, low, etc.) can be selected for each timeframe
Colors and line styles can be modified to suit personal preferences
Alert settings can be configured for automated trade notifications
Conclusion
The Custom EMA Multi-Timeframe Indicator is a powerful tool for traders seeking to gain a comprehensive understanding of market trends across different time horizons. By combining multiple EMAs and timeframes, it provides a unique perspective on market dynamics, helping traders make more informed decisions and potentially improve their trading results.
Whether you're a day trader looking for short-term opportunities or a swing trader focusing on longer-term trends, this indicator offers valuable insights that can enhance your trading strategy. Its flexibility and customization options make it suitable for a wide range of trading styles and market conditions.
Remember: While this indicator can be a valuable tool in your trading arsenal, it should not be used in isolation. Always combine it with other forms

Multi-Timeframe EMA Distance & % Change TableDescription of Multi-Timeframe EMA Distance & % Change Table
The Multi-Timeframe EMA Distance & % Change Table indicator is designed to display the distance and percentage change between the current price and the Exponential Moving Averages (EMAs) on multiple timeframes. It creates a table to show these values, with customizable options for decimal precision .
Key Features:
Inputs:
- Timeframes (tf1, tf2, tf3, tf4): User-defined timeframes for EMA calculations (e.g., 1 minute, 15 minutes, daily, etc.).
- EMA Levels (emaLevel, emaLevel2, emaLevel3): User-defined periods for three different EMAs.
EMA Calculations:
- Computes EMAs for the specified levels (50, 100, 200) on each of the user-selected timeframes.
Plotting:
- Plots the EMAs on the chart with distinct colors: Orange, Teal, and Green for different EMAs.
Display Options:
- Checkbox (displayAsPercentage): Allows the user to toggle between displaying distances or percentage changes.
- Decimal Precision:
- decimalPlacesDistance: Specifies the number of decimal places for rounded distance values.
- decimalPlacesPercentage: Specifies the number of decimal places for rounded percentage values.
Table Creation:
- Location: Table is placed in the top-right corner of the chart.
- Headers: Includes columns for each timeframe and EMA distance/percentage.
Distance and Percentage Calculations:
- Distances: Calculated as the difference between the current price and the EMA values for each timeframe.
- Percentages: Calculated as the distance divided by the EMA value, converted to a percentage.
Decimal Rounding:
- Custom Rounding Function: Ensures that distance and percentage values are displayed with the user-specified number of decimal places.
Color Coding:
- Distance Values: Colored green if positive, red if negative.
- Table Entries: Display either the rounded distance or percentage, based on user selection.
Table Update:
- The table is dynamically updated with either distance or percentage values based on the user's choice and rounded to the specified number of decimal places.
This indicator provides a comprehensive overview of EMA distances and percentage changes across multiple timeframes, with detailed control over the precision of the displayed values.

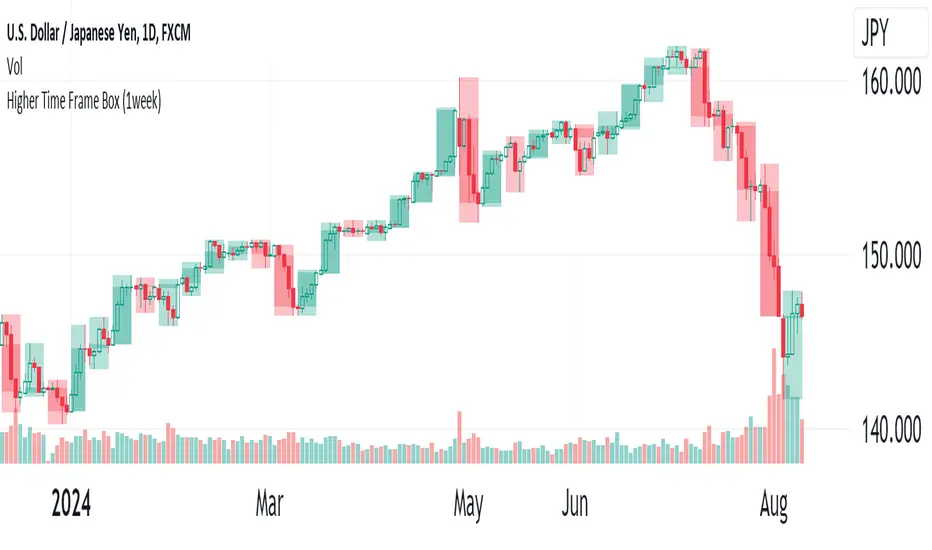
Higher Time Frame(HTF)The Higher Time Frame (HTF) will be displayed in a box. You can choose HTF periods from: 15min, 30min, 1hour, 2hour, 3hour, 4hour, 6hour, 8hour, 12hour, 1day, 1week, 2week, 4week, 1month, 2month, 3month, 4month, 6month, and 1year.
An error will occur if you set a period longer than the current candlestick period being displayed. The HTF Box can display a maximum of 500 boxes. There is no guarantee that all combinations of periods will work correctly.
----
上位足(Higher Time Frame, HTF) をボックスで表示します。
上位足の期間は、15分 30分 1時間 2時間 3時間 4時間 6時間 8時間 12時間 1日 1週 2週 4週 1月 2月 3月 4月 6月 1年から選べます。
表示しているローソク足の期間より長い期間を設定しないとエラーとなります。
上位足ボックスは最大500個表示することができます。
全ての期間の組み合わせで正しく動くことを保証するものではありません。
Custom Supertrend Multi-Timeframe Indicator [Pineify]Supertrend Multi-Timeframe Indicator
Introduction
The Supertrend Multi-Timeframe Indicator is an advanced trading tool designed to help traders identify trend directions and potential buy/sell signals by combining Supertrend indicators from multiple timeframes. This script is original in its approach to integrating Supertrend calculations across different timeframes, providing a more comprehensive view of market trends.
Concepts and Calculations
The indicator utilizes the Supertrend algorithm, which is based on the Average True Range (ATR). The Supertrend is a popular tool for trend-following strategies, and this script enhances its capabilities by incorporating data from a larger timeframe.
Supertrend Factor: Determines the sensitivity of the Supertrend line.
ATR Length: Defines the period for calculating the Average True Range.
Larger Supertrend Factor and ATR Length: Applied to the larger timeframe for a broader trend perspective.
Larger Timeframe: The higher timeframe from which the secondary Supertrend data is sourced.
How It Works
The script calculates the Supertrend for the current timeframe using the specified factor and ATR length.
Simultaneously, it requests Supertrend data from a larger timeframe.
Buy and sell signals are generated based on crossovers and crossunders of the Supertrend lines from both timeframes.
Visual cues (up and down arrows) are plotted on the chart to indicate buy and sell signals.
Background colors change to reflect the trend direction: green for an uptrend and red for a downtrend.
Usage
Add the indicator to your TradingView chart.
Customize the Supertrend factors, ATR lengths, and larger timeframe according to your trading strategy.
Enable or disable buy and sell alerts as needed.
Monitor the chart for visual signals and background color changes to make informed trading decisions.
Note: The indicator is best used in conjunction with other technical analysis tools and should not be relied upon as the sole basis for trading decisions.
Conclusion
The Supertrend Multi-Timeframe Indicator offers a unique and powerful way to analyze market trends by leveraging the strengths of the Supertrend algorithm across multiple timeframes. Its customizable settings and clear visual signals make it a valuable addition to any trader's toolkit.

Six PillarsGeneral Overview
The "Six Pillars" indicator is a comprehensive trading tool that combines six different technical analysis methods to provide a holistic view of market conditions.
These six pillars are:
Trend
Momentum
Directional Movement (DM)
Stochastic
Fractal
On-Balance Volume (OBV)
The indicator calculates the state of each pillar and presents them in an easy-to-read table format. It also compares the current timeframe with a user-defined comparison timeframe to offer a multi-timeframe analysis.
A key feature of this indicator is the Confluence Strength meter. This unique metric quantifies the overall agreement between the six pillars across both timeframes, providing a score out of 100. A higher score indicates stronger agreement among the pillars, suggesting a more reliable trading signal.
I also included a visual cue in the form of candle coloring. When all six pillars agree on a bullish or bearish direction, the candle is colored green or red, respectively. This feature allows traders to quickly identify potential high-probability trade setups.
The Six Pillars indicator is designed to work across multiple timeframes, offering a comparison between the current timeframe and a user-defined comparison timeframe. This multi-timeframe analysis provides traders with a more comprehensive understanding of market dynamics.
Origin and Inspiration
The Six Pillars indicator was inspired by the work of Dr. Barry Burns, author of "Trend Trading for Dummies" and his concept of "5 energies." (Trend, Momentum, Cycle, Support/Resistance, Scale) I was intrigued by Dr. Burns' approach to analyzing market dynamics and decided to put my own twist upon his ideas.
Comparing the Six Pillars to Dr. Burns' 5 energies, you'll notice I kept Trend and Momentum, but I swapped out Cycle, Support/Resistance, and Scale for Directional Movement, Stochastic, Fractal, and On-Balance Volume. These changes give you a more dynamic view of market strength, potential reversals, and volume confirmation all in one package.
What Makes This Indicator Unique
The standout feature of the Six Pillars indicator is its Confluence Strength meter. This feature calculates the overall agreement between the six pillars, providing traders with a clear, numerical representation of signal strength.
The strength is calculated by considering the state of each pillar in both the current and comparison timeframes, resulting in a score out of 100.
Here's how it calculates the strength:
It considers the state of each pillar in both the current timeframe and the comparison timeframe.
For each pillar, the absolute value of its state is taken. This means that both strongly bullish (2) and strongly bearish (-2) states contribute equally to the strength.
The absolute values for all six pillars are summed up for both timeframes, resulting in two sums: current_sum and alternate_sum.
These sums are then added together to get a total_sum.
The total_sum is divided by 24 (the maximum possible sum if all pillars were at their strongest states in both timeframes) and multiplied by 100 to get a percentage.
The result is rounded to the nearest integer and capped at a minimum of 1.
This calculation method ensures that the Confluence Strength meter takes into account not only the current timeframe but also the comparison timeframe, providing a more robust measure of overall market sentiment. The resulting score, ranging from 1 to 100, gives traders a clear and intuitive measure of how strongly the pillars agree, with higher scores indicating stronger potential signals.
This approach to measuring signal strength is unique in that it doesn't just rely on a single aspect of price action or volume. Instead, it takes into account multiple factors, providing a more robust and reliable indication of potential market moves. The higher the Confluence Strength score, the more confident traders can be in the signal.
The Confluence Strength meter helps traders in several ways:
It provides a quick and easy way to gauge the overall market sentiment.
It helps prioritize potential trades by identifying the strongest signals.
It can be used as a filter to avoid weaker setups and focus on high-probability trades.
It offers an additional layer of confirmation for other trading strategies or indicators.
By combining the Six Pillars analysis with the Confluence Strength meter, I've created a powerful tool that not only identifies potential trading opportunities but also quantifies their strength, giving traders a significant edge in their decision-making process.
How the Pillars Work (What Determines Bullish or Bearish)
While developing this indicator, I selected and configured six key components that work together to provide a comprehensive view of market conditions. Each pillar is set up to complement the others, creating a synergistic effect that offers traders a more nuanced understanding of price action and volume.
Trend Pillar: Based on two Exponential Moving Averages (EMAs) - a fast EMA (8 period) and a slow EMA (21 period). It determines the trend by comparing these EMAs, with stronger trends indicated when the fast EMA is significantly above or below the slow EMA.
Directional Movement (DM) Pillar: Utilizes the Average Directional Index (ADX) with a default period of 14. It measures trend strength, with values above 25 indicating a strong trend. It also considers the Positive and Negative Directional Indicators (DI+ and DI-) to determine trend direction.
Momentum Pillar: Uses the Moving Average Convergence Divergence (MACD) with customizable fast (12), slow (26), and signal (9) lengths. It compares the MACD line to the signal line to determine momentum strength and direction.
Stochastic Pillar: Employs the Stochastic oscillator with a default period of 13. It identifies overbought conditions (above 80) and oversold conditions (below 20), with intermediate zones between 60-80 and 20-40.
Fractal Pillar: Uses Williams' Fractal indicator with a default period of 3. It identifies potential reversal points by looking for specific high and low patterns over the given period.
On-Balance Volume (OBV) Pillar: Incorporates On-Balance Volume with three EMAs - short (3), medium (13), and long (21) periods. It assesses volume trends by comparing these EMAs.
Each pillar outputs a state ranging from -2 (strongly bearish) to 2 (strongly bullish), with 0 indicating a neutral state. This standardized output allows for easy comparison and aggregation of signals across all pillars.
Users can customize various parameters for each pillar, allowing them to fine-tune the indicator to their specific trading style and market conditions. The multi-timeframe comparison feature also allows users to compare pillar states between the current timeframe and a user-defined comparison timeframe, providing additional context for decision-making.
Design
From a design standpoint, I've put considerable effort into making the Six Pillars indicator visually appealing and user-friendly. The clean and minimalistic design is a key feature that sets this indicator apart.
I've implemented a sleek table layout that displays all the essential information in a compact and organized manner. The use of a dark background (#030712) for the table creates a sleek look that's easy on the eyes, especially during extended trading sessions.
The overall design philosophy focuses on presenting complex information in a simple, intuitive format, allowing traders to make informed decisions quickly and efficiently.
The color scheme is carefully chosen to provide clear visual cues:
White text for headers ensures readability
Green (#22C55E) for bullish signals
Blue (#3B82F6) for neutral states
Red (#EF4444) for bearish signals
This color coding extends to the candle coloring, making it easy to spot when all pillars agree on a bullish or bearish outlook.
I've also incorporated intuitive symbols (↑↑, ↑, →, ↓, ↓↓) to represent the different states of each pillar, allowing for quick interpretation at a glance.
The table layout is thoughtfully organized, with clear sections for the current and comparison timeframes. The Confluence Strength meter is prominently displayed, providing traders with an immediate sense of signal strength.
To enhance usability, I've added tooltips to various elements, offering additional information and explanations when users hover over different parts of the indicator.
How to Use This Indicator
The Six Pillars indicator is a versatile tool that can be used for various trading strategies. Here are some general usage guidelines and specific scenarios:
General Usage Guidelines:
Pay attention to the Confluence Strength meter. Higher values indicate stronger agreement among the pillars and potentially more reliable signals.
Use the multi-timeframe comparison to confirm signals across different time horizons.
Look for alignment between the current timeframe and comparison timeframe pillars for stronger signals.
One of the strengths of this indicator is it can let you know when markets are sideways – so in general you can know to avoid entering when the Confluence Strength is low, indicating disagreement among the pillars.
Customization Options
The Six Pillars indicator offers a wide range of customization options, allowing traders to tailor the tool to their specific needs and trading style. Here are the key customizable elements:
Comparison Timeframe:
Users can select any timeframe for comparison with the current timeframe, providing flexibility in multi-timeframe analysis.
Trend Pillar:
Fast EMA Period: Adjustable for quicker or slower trend identification
Slow EMA Period: Can be modified to capture longer-term trends
Momentum Pillar:
MACD Fast Length
MACD Slow Length
MACD Signal Length These can be adjusted to fine-tune momentum sensitivity
DM Pillar:
ADX Period: Customizable to change the lookback period for trend strength measurement
ADX Threshold: Adjustable to define what constitutes a strong trend
Stochastic Pillar:
Stochastic Period: Can be modified to change the sensitivity of overbought/oversold readings
Fractal Pillar:
Fractal Period: Adjustable to identify potential reversal points over different timeframes
OBV Pillar:
Short OBV EMA
Medium OBV EMA
Long OBV EMA These periods can be customized to analyze volume trends over different timeframes
These customization options allow traders to experiment with different settings to find the optimal configuration for their trading strategy and market conditions. The flexibility of the Six Pillars indicator makes it adaptable to various trading styles and market environments.

TechniTrend RSI (11TF)Multi-Timeframe RSI Indicator
Overview
The Multi-Timeframe RSI Indicator is a sophisticated tool designed to provide comprehensive insights into the Relative Strength Index (RSI) across 11 different timeframes simultaneously. This indicator is essential for traders who wish to monitor RSI trends and their moving averages (MA) to make informed trading decisions.
Features
Multiple Timeframes: Displays RSI and RSI MA values for 11 different timeframes, allowing traders to have a holistic view of the market conditions.
RSI vs. MA Comparison: Indicates whether the RSI value is above or below its moving average for each timeframe, helping traders to identify bullish or bearish momentum.
Overbought/Oversold Signals:
Marks "OS" (OverSell) when RSI falls below 25, indicating a potential oversold condition.
Marks "OB" (OverBuy) when RSI exceeds 75, signaling a potential overbought condition.
Real-Time Updates: Continuously updates in real-time to provide the most current market information.
Usage
This indicator is invaluable for traders who utilize RSI as part of their technical analysis strategy. By monitoring multiple timeframes, traders can:
Identify key overbought and oversold levels to make entry and exit decisions.
Observe the momentum shifts indicated by RSI crossing above or below its moving average.
Enhance their trading strategy by integrating multi-timeframe analysis for better accuracy and confirmation.
How to Interpret the Indicator
RSI Above MA: Indicates a potential bullish trend. Traders may consider looking for long positions.
RSI Below MA: Suggests a potential bearish trend. Traders may look for short positions.
OS (OverSell): When RSI < 25, the market may be oversold, presenting potential buying opportunities.
OB (OverBuy): When RSI > 75, the market may be overbought, indicating potential selling opportunities.

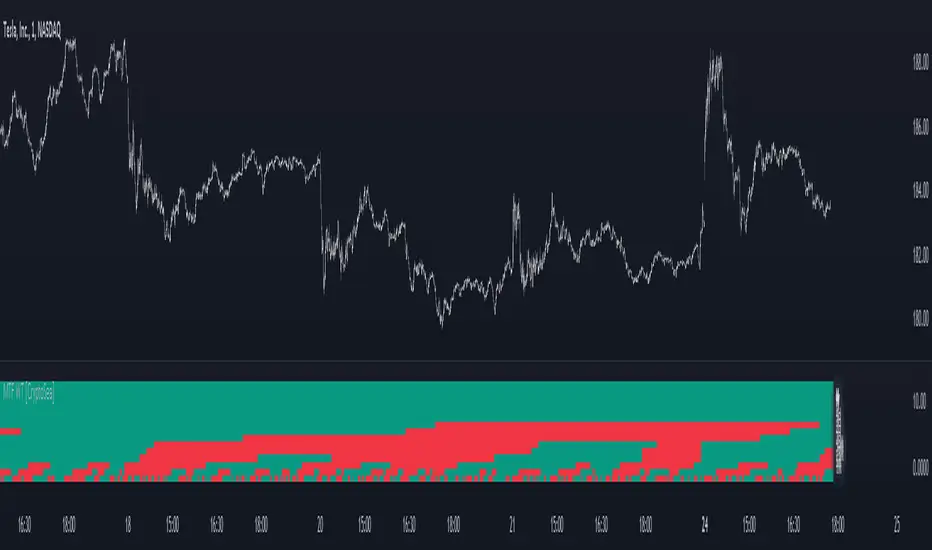
MTF WaveTrend [CryptoSea]The MTF WaveTrend Indicator is a sophisticated tool designed to enhance market analysis through multi-timeframe WaveTrend calculations. This tool is built for traders who seek to identify market momentum and potential reversals with higher accuracy.
In the example below, we can see all the choosen timeframes agree on bearish momentum.
Key Features
Multi-Timeframe WaveTrend Analysis: Tracks WaveTrend values across multiple timeframes to provide a comprehensive view of market momentum.
Customizable Colour Rules: Offers three different colour rules (Traditional, WT1 0 Rule, WT1 & WT2 0 Rule) to suit various trading strategies.
Timeframe Visibility Control: Allows users to enable or disable specific timeframes, providing flexibility in analysis.
Clear Visual Indicators: Uses color-coded squares and labels to clearly display WaveTrend status across different timeframes.
Candle Colouring Option: Includes a setting for neutral candle coloring to enhance chart readability.
This example shows what can happen when all timeframes start alligning with eachother.
How it Works
WaveTrend Calculation: Computes the WaveTrend oscillator by applying a series of exponential moving averages and scaling calculations.
Multi-Timeframe Data Aggregation: Utilizes the `request.security` function to gather and display WaveTrend values from various timeframes without repainting issues.
Conditional Plotting: Displays visual cues only when higher timeframes align with the selected timeframe, ensuring relevant and reliable signals.
Dynamic Colour Rules: Adjusts the indicator colors based on the chosen rule, whether it's a traditional crossover, WT1 crossing zero, or both WT1 & WT2 crossing zero.
Traditional: Colors are determined by the relationship between WT1 and WT2. If WT1 is greater than WT2, it is bullish (bullColour), otherwise bearish (bearColour).
WT1 0 Rule: Colors are based on whether WT1 is above or below zero. WT1 above zero is bullish (bullColour), below zero is bearish (bearColour).
WT1 & WT2 0 Rule: A more complex rule where both WT1 and WT2 need to be above zero for a bullish signal (bullColour) or both below zero for a bearish signal (bearColour). If WT1 and WT2 are not in agreement, a neutral color (neutralColour) is displayed.
This indicator will make sure that the lowest timeframe you can see data from will be the timeframe you are on. This is to avoid false signals as you cannot display 3 x 5 minute candles whilst looking at the 15 minute candle.
Application
Strategic Decision-Making: Assists traders in making informed decisions by providing detailed analysis of WaveTrend movements across different timeframes.
Trend Confirmation: Reinforces trading strategies by confirming potential reversals with multi-timeframe WaveTrend analysis.
Customized Analysis: Adapts to various trading styles with extensive input settings that control the display and sensitivity of WaveTrend data.
The MTF WaveTrend Indicator by is an invaluable addition to a trader's toolkit, offering depth and precision in market trend analysis to navigate complex market conditions effectively.
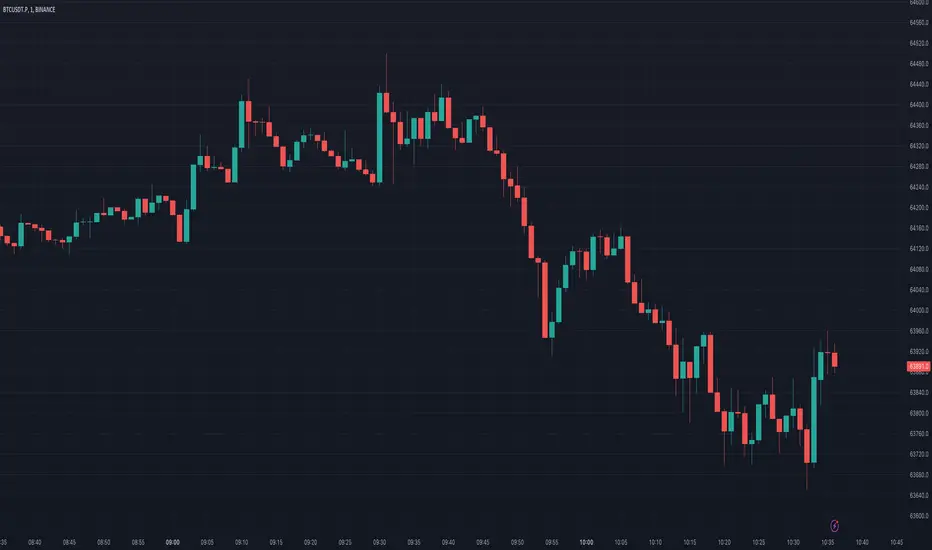
Lower Timeframe Volume BarsDescription:
The Lower Timeframe Volume Bars indicator enhances your TradingView experience by allowing you to visualize volume data from lower timeframes on your current chart. This powerful tool helps you gain deeper insights into volume trends and activity that are not immediately visible on higher timeframe charts. Specifically, it shows the volume data from the last bar of the selected lower timeframe.
Key Features:
Volume Bars from Lower Timeframes:
Display volume data from 1-minute or 1-second timeframes directly on higher timeframe charts, such as 15 minutes or 1 hour.
Each volume bar represents the aggregated volume from the lower timeframe within the selected higher timeframe period.
Enhanced Volume Analysis:
Gain a more detailed understanding of volume spikes and troughs that may be hidden in higher timeframe charts.
Identify potential market turning points and confirm trends with precise volume data.
Customizable Display:
Adjust the appearance of volume bars to fit your chart style and preferences.
Configure settings such as color, size, and positioning of volume bars for optimal visibility and clarity.
Seamless Integration:
Easily add the indicator to any chart in TradingView with a few clicks.
Works in conjunction with other technical indicators and tools to provide a comprehensive analysis environment.
How to Use:
Add the Lower Timeframe Volume Bars indicator to your chart.
Select the lower timeframe you wish to fetch volume data from (e.g., 1-minute or 1-second).
Customize the display settings to match your charting style.
Observe the volume bars overlaying your current chart to analyze volume activity across different timeframes, specifically showing the last bar's volume.
Use the detailed volume information to make informed trading decisions and enhance your market analysis.
Benefits:
Increased Clarity: See detailed volume activity that is often lost in higher timeframe aggregation.
Better Decision Making: Make more informed trading decisions with a clear view of volume trends and spikes.
Improved Trend Confirmation: Use lower timeframe volume data to confirm the strength and sustainability of market trends.
Enhance your trading strategy and gain a deeper understanding of market dynamics with the Lower Timeframe Volume Bars indicator. Visualize, analyze, and trade with confidence by leveraging detailed volume insights from lower timeframes.

TMB LevelsDescription:
Improved "Hourly Midline" indicator. It displays high, middle and low levels of every candle with specified timeframe (can be hourly, daily, or any other timeframe). You can change the source for the levels (either high and low of candle, or open and close of candle). Additionally, you can turn on the "Line chart", which essentially connects every midline, making a line chart of middle prices.
Parameters:
- Timeframe -> use data from this timeframe ("30" would mean 30 minutes, "60" would mean 1 hour, etc.)
- Source -> source for calculating the middle level
- Top -> parameters of the top level lines
- Middle -> parameters of the middle level lines
- Bottom -> parameters of the bottom level lines
- Line chart -> connect every midline, making a line chart

Price alert multi symbols (Miu)This indicator won't plot anything to the chart.
Please follow steps below to set your alarms based on multiple symbols' prices:
1) Add indicator to the chart
2) Go to settings
3) Check symbols you want to receive alerts (choose up to 8 different symbols)
4) Set price for each symbol
5) Once all is set go back to the chart and click on 3 dots to set alert in this indicator, rename your alert and confirm
6) You can remove indicator after alert is set and it'll keep working as expected
What does this indicator do?
This indicator will generate alerts based on following conditions:
- If price set is met for any symbol
Once condition is met it will send an alert with the following information:
- Symbol name (e.g: BTC, ETH, LTC)
- Price reached
This script requests current price for each symbol through request.security() built-in function. It also requests amount of digits (mintick) for each symbol to send alerts with correct value.
This script was developed to attend a demand from a comment in other published script.
Feel free to give feedbacks on comments section below.
Enjoy!
Fibonacci Timeframe Adaptive EMAThe "Fibonacci Timeframe Adaptive EMA" is a sophisticated trading indicator designed for the TradingView platform, leveraging the power of Exponential Moving Averages (EMAs) determined by Fibonacci sequence lengths to provide traders with dynamic market insights. This indicator overlays directly on the price chart, offering a unique blend of trend analysis, smoothing techniques, and timeframe adaptability, making it an invaluable tool for traders looking to enhance their technical analysis strategy.
Key Features
1. Fibonacci-Based EMA Lengths: Utilizes the Fibonacci sequence to select EMA lengths, incorporating natural mathematical ratios believed to be significant in financial markets. The available lengths range from 1 to 987, allowing for detailed trend analysis over various periods.
2. Multiple Smoothing Methods: Offers the choice between several smoothing techniques, including Simple Moving Average (SMA), Exponential Moving Average (EMA), Smoothed Moving Average (SMMA or RMA), Weighted Moving Average (WMA), and Volume Weighted Moving Average (VWMA). This versatility ensures that users can tailor the indicator to suit their analytical preferences.
3. Timeframe Adaptability: Features the ability to fetch and calculate EMAs from different timeframes, providing a multi-timeframe analysis within a single chart view. This adaptability gives traders a broader perspective on market trends, enabling more informed decision-making.
4. Dynamic Visualization Options: Traders can customize the display to suit their analysis needs, including toggling the visibility of Fibonacci EMA lines, EMA prices, and smoothed EMA lines. Additionally, forecast lines can be projected into the future, offering speculative insights based on current trends.
5. Ema Tail Visualization: An innovative feature allowing for the visualization of the 'tail' or the continuation of EMA lines, which can be particularly useful for identifying trend persistence or reversal points.
6. User-friendly Customization: Through a series of input options, traders can easily adjust the source data, Fibonacci lengths, smoothing method, and visual aspects such as line colors and transparency, ensuring a seamless integration into any trading strategy.
Application and Use Cases
The "Fibonacci Timeframe Adaptive EMA" indicator is designed for traders who appreciate the significance of Fibonacci numbers in market analysis and seek a flexible tool to analyze trends across different timeframes. Whether it's for scalping, day trading, or long-term investing, this indicator can provide valuable insights into price dynamics, trend strengths, and potential reversal points. Its adaptability makes it suitable for various asset classes, including stocks, forex, commodities, and cryptocurrencies.

EMA Cross Dashboard | Flux Charts💎 GENERAL OVERVIEW
Introducing our new Exponential Moving Average (EMA) Cross Dashboard! This dashboard let's you select a source for the calculation of the EMA of it, then let's you enter 2 lengths for up to 5 timeframes, plotting their crosses in the chart.
Features of the new EMA Cross Dashboard :
Shows EMA Crosses Across Up To 5 Different Timeframes.
Select Any Source, Including Other Indicators.
Customizable Dashboard.
📌 HOW DOES IT WORK ?
EMA is a widely used indicator within trading community, it is similar to a Simple Moving Average (SMA) but places more weight on recent prices, making it more reactive to current trends. Crosses of EMA lines can be helpful to determine strong bullish & bearish movements of an asset. This indicator shows finds crosses across 5 different timeframes in a dashboard and plots them in your chart for ease of use.
🚩UNIQUENESS
This dashboard cuts through the hassle of manual EMA cross calculations and plotting. It offers flexibility by allowing various data sources (even custom indicators) and customization through enabling / disabling individual timeframes. The clear visualization lets you see EMA crosses efficiently.
⚙️SETTINGS
1. Timeframes
You can set up to 5 timeframes & 2 lenghts to detect crosses for each timeframe here. You can also enable / disable them.
2. General Configuration
EMA Source -> You can select the source for the calculation of the EMA here. You can select sources from other indicators as well as more general sources like close, high and low price.

Multi Pivot (S/R) & Previous Period (OHLC)█ Multi Pivot (Support/Resistance) & Previous Period (Open/High/Low/Close)
The previous script was deleted because of a copyrighted word.
From JayRogers description.
█ Multi Pivot Selector
Allows you to set up to 3 distinct sets of pivots, each with their own resolution settings and the ability to select how many support|resistance levels are shown.
The maximum amount of S|R levels available varies with different pivot types, the options available are:
Traditional
Fibonacci
Woodie
Classic
Copyrighted word
Camarilla
Fibonacci Extended
█ Previous Period Levels
A simple but highly customisable display of previous higher time-frame OHLC values.
Customised resolution input which excludes time frames lower than 1 hour while extending the common higher reference inputs.
This script is based on JayRogers script, I only added some features so please check out his script.
I added the timeframe in the labels, in order to make it easier to differentiate when using multiple pivot set.
As well as making it possible to change the lines color of each pivot set separately.
Labels can now be displayed on each side (right, left and both) or just disabled.
The type of pivot can be shown on the right side.
Lines extension can be disabled and lines width value can be changed.
I also added another one of his script to display OHLC levels, I made similar changes.
Converted to Pine Script v5.
Previous Period Levels - X Alerts
Pivotal - Multi Pivot Selector (which was also deleted because of the copyrighted word)

[KVA] Custom Sessions Custom Sessions: Multi-Timeframe Analysis & Key Level Insights
Introduction:
Introducing " Custom Sessions," an innovative Pine Script indicator meticulously crafted to empower traders by offering an advanced level of analysis on various global trading sessions. This tool is designed not just to highlight trading sessions but to delve deeper into the nuances of market movements by analyzing candlestick behavior within those sessions, offering a nuanced view of market trends, liquidity, and potential turning points.
Core Features :
Session Customization : Tailor trading sessions to align with your strategy, focusing on the markets that matter most to you. Whether it's London, New York, Tokyo, Sydney, or Frankfurt, you have the control.
Enhanced Market Insight : Beyond session timing, gain a refined understanding of market dynamics through detailed candlestick analysis within each session, providing a granular view of price action.
Comprehensive Analysis Tools : Alongside session analysis, the indicator includes features like VWAP (Volume Weighted Average Price) and Fibonacci retracement levels, offering a multifaceted approach to market analysis across chosen timeframes.
VWAP : Gain insights into the market's trend and liquidity by viewing the Volume Weighted Average Price calculated for the custom timeframe.
Fibonacci Retracement Levels : Easily identify potential reversal points with automatically plotted Fibonacci levels at 0.236, 0.382, 0.5, 0.618, and 0.782for each candle
Real-Time Updates : As the market moves, so does " Custom Sessions," offering real-time insights that adapt to the unfolding market conditions.
Utilization Guide :
Configure Your Sessions : Begin by setting up the sessions that are most relevant to your trading approach, customizing their times as needed.
Select the Desired Timeframe : Input your preferred higher timeframe to analyze data that is most relevant to your trading strategy.
Dive into the Details : Use the detailed candlestick analysis within sessions to pinpoint potential entry and exit points, supported by VWAP and Fibonacci levels for deeper market insight.
Customize Your View : Adjust the visual aspects of the indicator, including session color coding and which elements to display, tailoring the tool to your preferences.
Acknowledgements :
A special thanks to Aurocks_AIF for their foundational work on "Sessions on Chart" . This project has been an invaluable resource, inspiring the development of " Custom Sessions" and pushing the boundaries of traditional session analysis.
Final Thoughts :
" Custom Sessions" is more than just an indicator; it's a comprehensive analysis tool that brings a new depth to the understanding of market sessions. By offering detailed insights into the behavior of candles within these sessions, along with essential analysis features, this indicator is a must-have for traders seeking to enhance their technical analysis arsenal.
Whether you're a day trader looking to capture short-term movements or a long-term investor seeking broader market insights, this indicator offers valuable data visualization to enhance your trading decisions. By integrating highs, lows, VWAP, and Fibonacci levels into your analysis, you gain a comprehensive view of market behavior across different timeframes and sessions

Scalper's Volatility Filter [QuantraSystems]Scalpers Volatility Filter
Introduction
The 𝒮𝒸𝒶𝓁𝓅𝑒𝓇'𝓈 𝒱𝑜𝓁𝒶𝓉𝒾𝓁𝒾𝓉𝓎 𝐹𝒾𝓁𝓉𝑒𝓇 (𝒮𝒱𝐹) is a sophisticated technical indicator, designed to increase the profitability of lower timeframe trading.
Due to the inherent decrease in the signal-to-noise ratio when trading on lower timeframes, it is critical to develop analysis methods to inform traders of the optimal market periods to trade - and more importantly, when you shouldn’t trade.
The 𝒮𝒱𝐹 uses a blend of volatility and momentum measurements, to signal the dominant market condition - trending or ranging.
Legend
The 𝒮𝒱𝐹 consists of a signal line that moves above and below a central zero line, serving as the indication of market regime.
When the signal line is positioned above zero, it indicates a period of elevated volatility. These periods are more profitable for trading, as an asset will experience larger price swings, and by design, trend-following indicators will give less false signals.
Conversely, when the signal line moves below zero, a low volatility or mean-reverting market regime dominates.
This distinction is critical for traders in order to align strategies with the prevailing market behaviors - leveraging trends in volatile markets and exercising caution or implementing mean-reversion systems in periods of lower volatility.
Case Study
Here we can see the indicator's unique edge in action.
Out of the four potential long entries seen on the chart - displayed via bar coloring, two would result in losses.
However, with the power of the 𝒮𝒱𝐹 a trader can effectively filter false signals by only entering momentum-trades when the signal line is above zero.
In this small sample of four trades, the 𝒮𝒱𝐹 increased the win rate from 50% to 100%
Methodology
The methodology behind the 𝒮𝒱𝐹 is based upon three components:
By calculating and contrasting two ATR’s, the immediate market momentum relative to the broader, established trend is calculated. The original method for this can be credited to the user @xinolia
A modified and smoothed ADX indicator is calculated to further assess the strength and sustainability of trends.
The ‘Linear Regression Dispersion’ measures price deviations from a fitted regression line, adding further confluence to the signals representation of market conditions.
Together, these components synthesize a robust, balanced view of market conditions, enabling traders to help align strategies with the prevailing market environment, in order to potentially increase expected value and win rates.

Trend Channels (MTF) | Flux Charts💎 GENERAL OVERVIEW
Introducing our new Trend Channels (MTF) indicator! Latest trends play an important role for traders and sometimes it can be hard to spot trends in other timeframes. This indicator can plot latest trend channels across different timeframes, so you can spot trends and their channels easier. More info about the process in the "How Does It Work" section.
Features of the new Trend Channels (MTF) indicator :
Plot Trend Channels Across Up To 3 Different Timeframes
Broad Customizability Of Trend Detection
Variety Of Trend Invalidation Options
High Visual Customizability
🚩UNIQUENESS
While the detection of trend channels is a common concept among traders, trend channels across different timeframes can be as crucial as the ones in the current timeframe. This indicator can find them from up to 3 different timeframes. While the general settings will perform well enough most of the time, the indicator also provides fine-tuning options for trend detection and trend invalidation for more experienced traders.
📌 HOW DOES IT WORK ?
Trend channels occur when the price of an asset starts making a strong movement in a bullish or a bearish direction. This indicator detects trend channels using the Simple Moving Average (SMA). When the slope of the SMA line exceeds the user-defined size, a trend channel will occur.
To understand how individual settings work, you can check the "⚙️SETTINGS" section.
⚙️SETTINGS
1. General Configuration
SMA Length -> Determines the length used in the SMA function. Higher values mean that an average of a longer timespan will be taken into account when spotting trends.
Slope Length -> Used while finding the slope of the trend channel. Check this example for slope length :
ATR Size -> This setting is taken into calculation while checking if a trend channel is worth plotting. The higher this setting is, the higher the slope of the trend channel must be to get rendered. You can take a look at the chart provided above for a visual explanation.
Channel Expander -> When a trend channel occurs, the top and the bottom of the channel are initally determined by the latest highest highs / lowest lows. This setting expands the channel vertically by X times Average True Range (ATR). Check this example :
Trend Invalidation -> The trend channel gets invalidated when the bar closes / wicks above the top of the channel, or below the bottom of the channel. With this setting, you can switch the behaviour between bar close / bar wick.
Avoid False Invalidation -> This setting makes it harder for trend channels to get invalidated to prevent false invalidations.
Retries : The trend channel will have 5 chances for invalidation. First 4 invalidations will not invalidate the channel. The trend channel will only invalidate once the 5th invalidation occur.
Volume : The bar that invalidates the trend channel must have a volume higher than 1.5x the average bar volume of the current chart. Otherwise the trend channel will not be invalidated.
None : The trend channel will invalidate at the first invalidation.

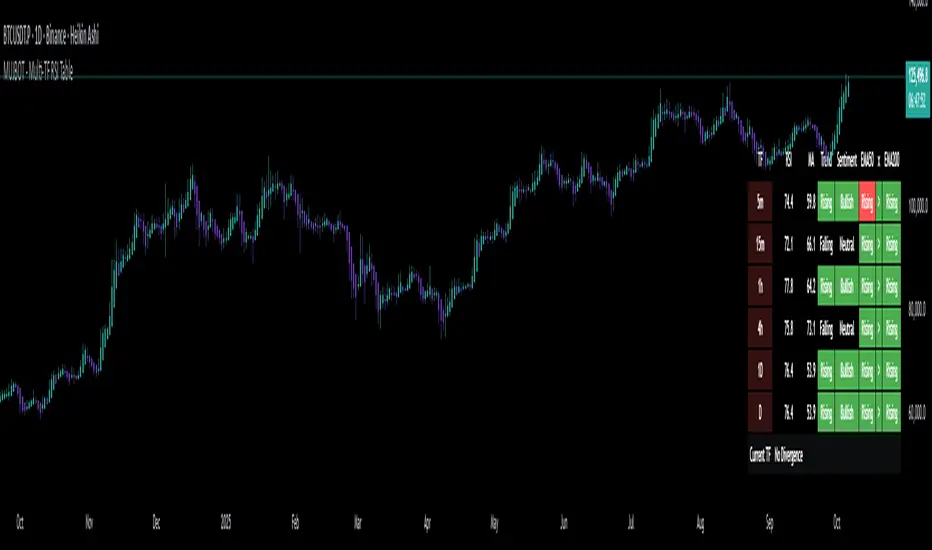
MUJBOT - Multi-TF RSI Table
The "Multi-TF RSI Table" indicator is a comprehensive tool designed to present traders with a quick visual summary of the Relative Strength Index (RSI) across multiple timeframes, all within a single glance. It is crafted for traders who incorporate multi-timeframe analysis into their trading strategy, aiming to enhance decision-making by identifying overall market sentiment and trend direction. Here's a rundown of its features:
User Inputs: The indicator includes customizable inputs for the RSI and Moving Average (MA) lengths, allowing users to tailor the calculations to their specific trading needs. Additionally, there is an option to display or hide the RSI & MA table as well as to position it in various places on the chart for optimal visibility.
Multi-Timeframe RSI & MA Calculations: It fetches RSI and MA values from different timeframes, such as 1 minute (1m), 5 minutes (5m), 15 minutes (15m), 1 hour (1h), 4 hours (4h), and 1 day (1D). This multi-timeframe approach provides a thorough perspective of the momentum and trend across different market phases.
Trend and Sentiment Analysis: For each timeframe, the script determines whether the average RSI is above or below the MA, categorizing the trend as "Rising", "Falling", or "Neutral". Moreover, it infers market sentiment as "Bullish" or "Bearish", based on the relationship between the RSI and its MA.
Dynamic Color-Coding: The indicator uses color-coding to convey information quickly. It highlights the trend and sentiment cells in the table with green for "Bullish" and red for "Bearish" conditions. It also shades the timeframe cells based on the RSI value, with varying intensities of green for "Oversold" conditions and red for "Overbought" conditions, providing an immediate visual cue of extreme market conditions.
Customization and Adaptability: The script is designed with customization in mind, enabling users to adjust the RSI and MA lengths according to their trading strategy. Its adaptable interface, which offers the option to display or hide the RSI & MA table, ensures that the tool fits into different trading setups without cluttering the chart.
Ease of Use: By consolidating critical information into a simple table, the "Multi-TF RSI Table" indicator saves time and simplifies the analysis process for traders. It eliminates the need to switch between multiple charts or timeframes, thus streamlining the trading workflow.
In essence, the "Multi-TF RSI Table" is a powerful indicator for Pine Script users on TradingView, offering a multi-dimensional view of market dynamics. It is ideal for both novice and experienced traders who seek to enhance their technical analysis with an at-a-glance summary of RSI trends and market sentiment across various timeframes.
Multi MAs mit LabelA MA (Moving Average) is useful to identify a trend of an assets. The TradingView builtin indicator "Exponential Moving Average" is useful, but limited in some aspects:
Bound to the active timeframe (e.g. h1)
One MA per indicator instance. Makes it confusing when using multiple
In reality to want to have multiple MAs with different types (EMA, SMA), length and timeframes on your chart to identify trading opportunities. As an example you can use the daily EMA12 and EMA21 to identify the trend and EMA200 on the h4 to enter a trade. That's what this script is used for.
The provided script is an extension to the indicator powered by chipmonk (link to profile below). The original script let you add up to 8 EMAs that can be bound to any timeframe and length. The timeframe and length is displayed on the chart next to EMA.
Unfortunately you can only add EMAs (Exponential Moving Averages) and no SMAs (Simple Moving Averages). That's why the script was extended. You can now choose the type (EMA or SMA) for up to 8 MAs.
Links
Profile of chipmonk
Indicator by chipmonk
