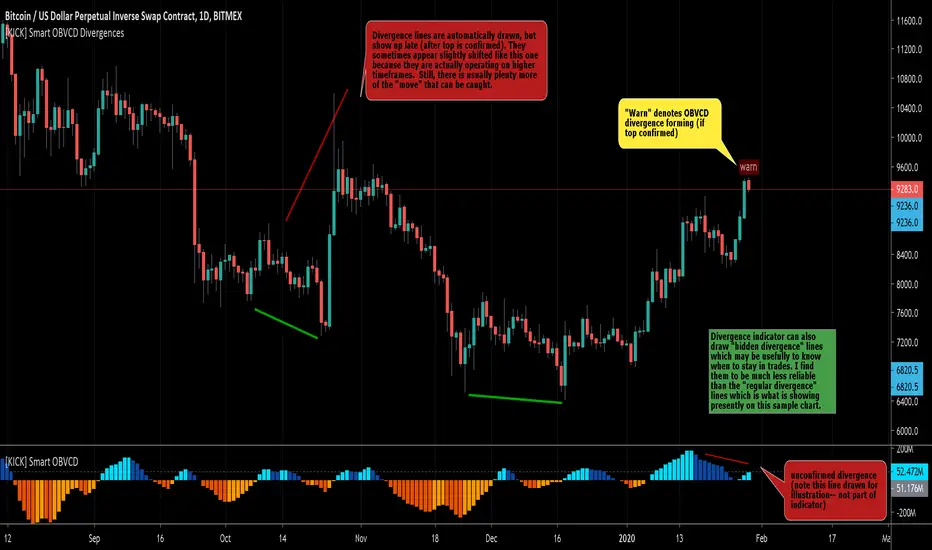
[KICK] Smart OBVCD DivergencesThis indicator is part of a pair of indicators that make it easier to spot divergences in On Balance Volume , but make the calculations using a unique method. THIS ONE IS IN THE UPPER (PRICE ACTION) PANE OF THE SAMPLE CHART.
Volume is segmented into buy or sell volume by analyzing smaller timeframes (down to 1 minute)
The sell vs. buy volume is calculated as a running total (as per normal OBV calculations)
The Convergence/Divergence of the OBV Buy and Sell volumes are calculated and smoothed with 3rd generation averaging methods
The Smart OBVCD indicator (THE RELATED INDICATOR) visualizes the above calculation on a histogram to make it easier to see the values and how they relate to the price action.
The Smart OBVCD Divergence indicator (THIS ONE) plots Regular and Hidden Bullish and Bearish divergence on higher timeframes based on the calculations and also provides early “warnings” for unconfirmed divergences forming (note: these are unconfirmed because the higher high or lower low have now yet been confirmed on the higher timeframe).
Use the link below to watch a tutorial video, request a trial, or purchase for access.
On Balance Volume (OBV)

[KICK] Smart OBVCDThis indicator is part of a pair of indicators that make it easier to spot divergences in On Balance Volume, but make the calculations using a unique method. THIS ONE IS IN THE LOWER PANE OF THE SAMPLE CHART.
Volume is segmented into buy or sell volume by analyzing smaller timeframes (down to 1 minute)
The sell vs. buy volume is calculated as a running total (as per normal OBV calculations)
The Convergence/Divergence of the OBV Buy and Sell volumes are calculated and smoothed with 3rd generation averaging methods
The Smart OBVCD indicator (THIS ONE) visualizes the above calculation on a histogram to make it easier to see the values and how they relate to the price action.
The Smart OBVCD Divergence indicator (THE RELATED INDICATOR) plots Regular and Hidden Bullish and Bearish divergence on higher timeframes based on the calculations and also provides early “warnings” for unconfirmed divergences forming (note: these are unconfirmed because the higher high or lower low have now yet been confirmed on the higher timeframe).
Use the link below to watch a tutorial video, request a trial, or purchase for access.
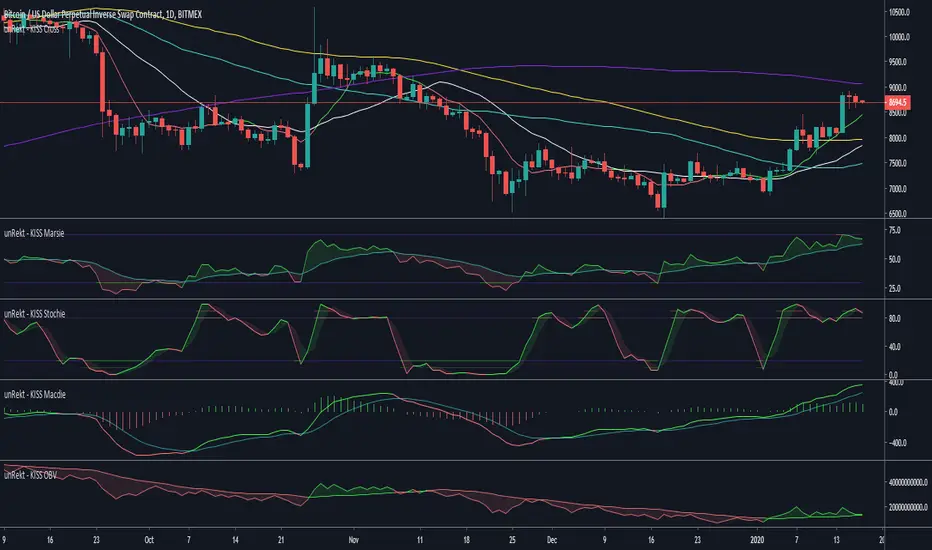
unRekt - KISS OBVOBV is the 'On Balance Volume' indicator and is part of the 'keeping it simple' series that have a similar color scheme. the OBV measures buying and selling pressure as a cumulative indicator, adding volume on up days and subtracting it on down days. The OBV can show divergences or confirm trend.
CMF Osc - Chaikin Money Flow Oscillator [UTS]The well known Chaikin Money Flow Indicator as oscillator version.
General Usage
The indicator runs both above and below zero, made to denote whether an asset is in a bullish (above zero) or bearish (below zero) trend.
It can be used to confirm trends, as well as spot possible trading signals due to divergences.
A benefit of the oscillator version is that it can produce LONG or SHORT signals on zero line cross.
Moving Averages
4 different Moving Averages are available:
EMA (Exponential Moving Average)
SMA (Simple Moving Average)
VWMA (Volume Weighted Moving Average)
WMA (Weighted Moving Average)

PVT Osc - Price Volume Trend Oscillator [UTS]The oscillator version of the Price Volume Trend indicator (PVT) can be considered as a leading indicator of future price movements. The PVT Indicator is similar to the On Balance Volume indicator as it is also used to measure the strength of a trend.
The difference between the OBV and the PVT is that where the OBV adds all volumes when price achieves higher daily closes and subtracts them when price registers a lower daily close, the PVT adds or subtracts only a portion of the volume from the cumulative total in relation to a percentage change in price.
The general market consensus is that this difference enables the PVT to more accurately represent money flow volumes in and out of a stock or commodity.
The PVT has been designed so that it is capable of forecasting directional changes in price. For instance, if the price of a stock is rising and the PVT begins to fall, then this is indicative that a price reversal could occur very soon.
The general consensus is that the PVT is more accurate at detecting new trading opportunities than the OBV because of the differences in their construction. The OBV is designed so that it adds the same amount of volume whether the price closes upwards by just a small fraction or by multiples of its day opening value. On the other hand, the PVT adds volume proportional to the amount the price closed higher.
General Usage
Plain old PVT can be used to confirm trends, as well as spot possible trading signals due to divergences.
A benefit of the oscillator version is that it can produce LONG or SHORT signals on zero line cross.
Or controversy, disallow LONG trades in bearish territory and disallow SHORT trades in bullish territory.
Moving Averages
4 different Moving Averages are available:
EMA (Exponential Moving Average)
SMA (Simple Moving Average)
VWMA (Volume Weighted Moving Average)
WMA (Weighted Moving Average)

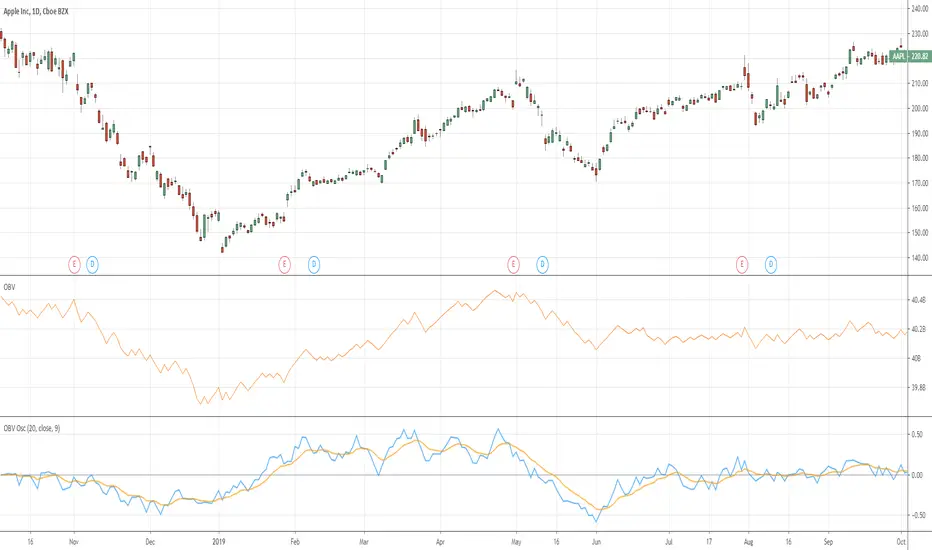
OBV Osc - On Balance Volume Oscillator [UTS]The oscillator version of the well known On Balance Volume Indicator (OBV).
General Usage
Plain old OBV can be used to confirm trends, as well as spot possible trading signals due to divergences.
A benefit of the oscillator version is that it can produce LONG or SHORT signals on zero line cross.
Moving Averages
4 different Moving Averages are available:
EMA (Exponential Moving Average)
SMA (Simple Moving Average)
VWMA (Volume Weighted Moving Average)
WMA (Weighted Moving Average)
MFI - Money Flow Index [UTS]Money Flow Index (MFI) is the technical indicator, which indicates the rate at which money is invested into a security and then withdrawn from it.
Construction and interpretation of the indicator is similar to Relative Strength Index with the only difference that volume is important to MFI.
Usage:
When analyzing the money flow index one needs to take into consideration the following points:
divergences between the indicator and price movement. If prices grow while MFI falls (or vice versa), there is a great probability of a price turn;
Money Flow Index value, which is over 80 or under 20, signals correspondingly of a potential peak or bottom of the market.
Common known variants of this type of indicator are the On Balance Volume, Chaikin Oscillator or Chaikin Money Flow.
Based on www.metatrader5.com

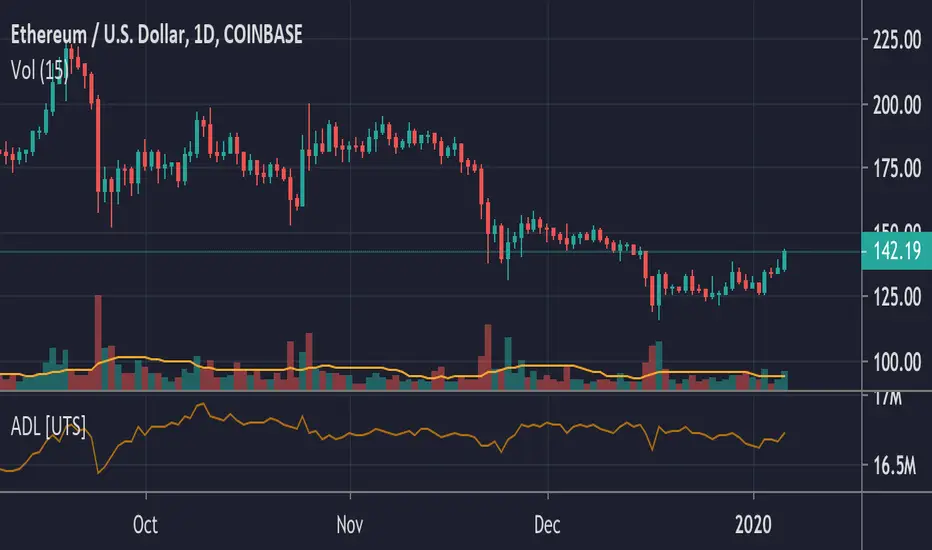
ADL - Accumulation Distribution Line [UTS]an underlying asset.
It is determined by the changes in price and volume. The volume acts as a weighting coefficient at the change of price — the higher the coefficient (the volume) is the greater the contribution of the price change (for this period of time) will be in the value of the indicator. The indicator is also known as Accumulation / Distribution Index.
Common known variants of this type of indicator are the On Balance Volume, Chaikin Oscillator or Chaikin Money Flow.
Based on www.metatrader5.com
Multi EX OBV [by coral1213]Multi Exchanges OBV
Use the security function to call volume information from 10 exchanges. So there is a slight delay when loading.

Hashem OBV (V2)HASHEM OBV (V2)
The OBV is one of the most powerful indicators for spotting divergences and local highs and lows.
This OBV is trapped in a channel between -100 and 100. the Fast OBV is smoothed by 2 (Default) and the Slow OBV is smoothed by 4 (Editable) .
The Idea is when the Fast OBV crosses the Slow it's a setup. when this cross happens on the Top and Bottom Zones it'll have more weight.
The Difference between the Fast and Slow is shown on the Zero Line. when the slope of it is positive it means the previous setup is being played. But when it comes to 0 or/and Reverse, it means the previous setup is either played or it'll not be played.
Also, an EMA and SMA (source form Slow OBV ) are included. the EMA is used for Support/Resistance and the SMA is used for its Slope and the position in the Zones .
NOTE THAT THIS IS NOT A SIGNALING INDICATOR, YOU MUST CONFIRM THEM WITH YOUR OWN TA.

Divergence Detector v1This indicator looks for divergences between price (close) and the indicator of your choice. You can see which indicators are supported further down. I discovered that there are 2 slight variations on how to calculate divergences in Pinescript, so I used both in this script.
Benefit : The accuracy of divergence detection becomes much higher.
Tradeoff : Some of the labels will overlap each other, not looking too pretty. I know how to fix this, but I didn't prioritize it with this version.
Supported indicators:
RSI (Relative Strength Index) - www.investopedia.com
ROC (Rate of Change) - www.investopedia.com
CCI (Commodity Channel Index) - www.investopedia.com
OBV (On Balance Volume) - www.investopedia.com
You can switch between them in the settings display of the indicator. Default is set to RSI.

[astropark] Renko OBV divergencesDear Followers,
today a new great Scalper Tool , based on Ob Balance Volume (OBV) oscillator, which works from 1 minute timeframe Renko chart , which is the best and more secure timeframe to use on a Renko chart. But of course it works great on all timeframes (included the 1D timeframe), both on FOREX and on Cryptocurrencies!
This tool has some cool features:
it works on all timeframes , starting from 1 minute: so you can enjoy high-frequency trading by using a 24/7 running bot and a proper money and risk management strategy
it shows you both bullish and bearish divergences with a triangle up or down respectively
when it finds a strong bullish/bearish divergence , a flag will be displayed instead of a triangle
This script will let you set all notifications you may need in order to be alerted on each triggered divergence.
You may like to use it together with my Renko Scalper V2
and my Renko RSI Divergences indicator
On Bitmex/ByBit/Binance Bitcoin/USD chart best settings is Traditional Renko chart with 10$ box size, while 0.5$ box size is suggested on Ethereum/USD pair.
This is a premium indicator , so send me a private message in order to get access to this script.

Hashem OBV+EMA/MAThe On Balance Volume indicator (OBV) is used to measure buying and selling pressure.
It is a cumulative indicator meaning that on days where price went up, that day's volume is added to the cumulative OBV total. If price went down, then that day's volume is subtracted from the OBV total.
The OBV value is then plotted as a line for easy interpretation. OBV is primarily used to confirm or identify overall price Trends or to anticipate price movements after Divergences .
In addition to OBV, EMA and SMA are included. the EMA is used for Support and Resistances for the OBV. and the SMA is used by its Slope (can be S/R as well).

On Balance Volume Oscillator Strategy [QuantNomad]Looking for the way to use OBV Oscillator in a strategy.
Here is my first try. I just enter to position of a cross of 2 emas based on OBV.
Here is my original oscillator indicator:

QuantNomad - On Balance Volume OscillatorCreated an oscillator from OBV - On Balance Volume. This way I think it is more responsive.
I just took OBV over a period and divided it by the total volume for the same period. So now it's an oscillator from -1 to 1.
You can also add EMA to this script.
Any feedback will be appreciated.

OBV Divergence PointerThis script points regular and optionally hidden types of bullish and bearish OBV divergences on the chart by drawing the divergence lines and optionally labels.
Hidden divergence is disabled by default, it can be enabled over settings window.
Regular divergence is enabled by default, it can be disabled over settings window.
There is an option to display the price channel additionally.
Added alerts for all types of divergences.

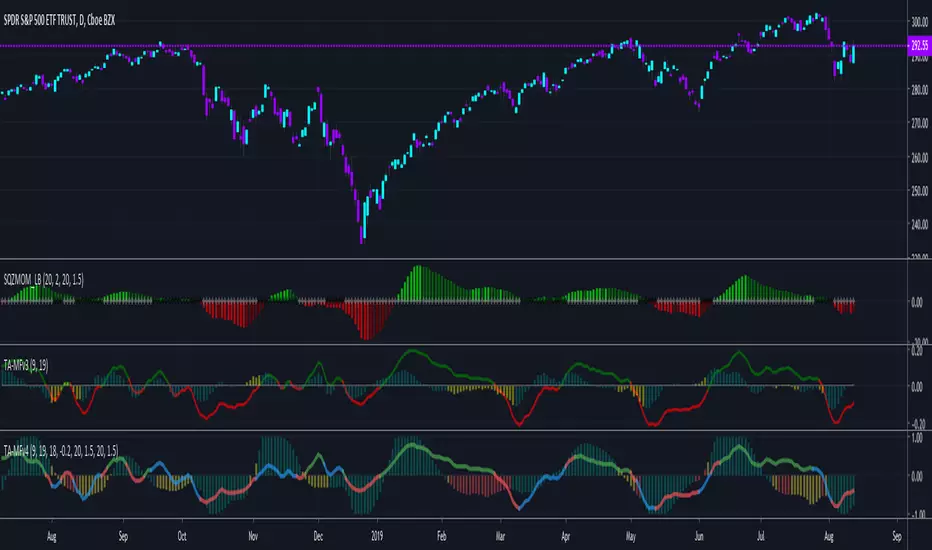
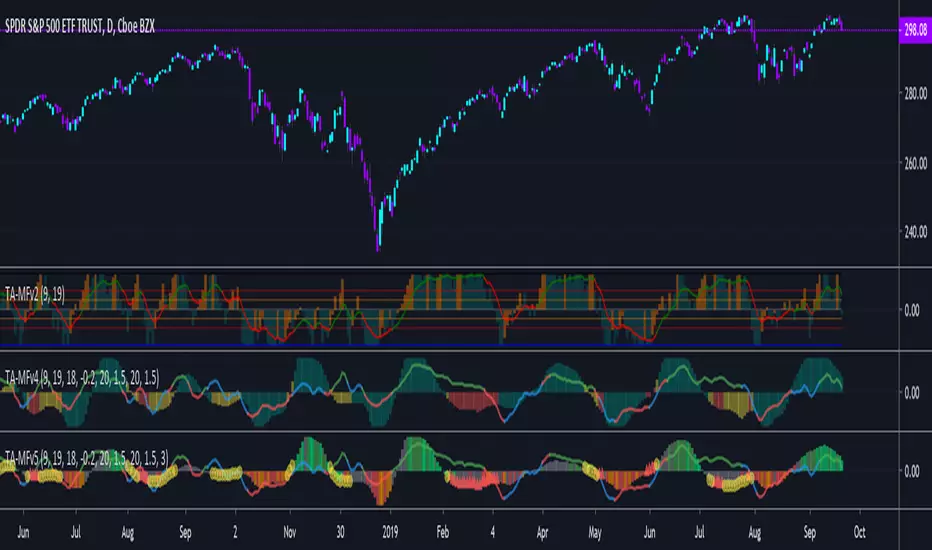
TA-Money Flow-Version5This is the MACD of a stochastic OBV movement indicator, Squeeze Momentum Indicator, and addition coloring for Market Direction Indicator . It is good (right) to work with both price and volume.
In this version we've moved the divergence highlighting to symbols at the ends of the histograms. Same coloring scheme as previous, yellow is divergence of either OBV or SQZ , red is both divergence. In the previous version we added in the "squeeze on - blue" highlighting to show follow through of divergence (or just squeeze/stall). We also added in another old script, but colors so well, Lazybears (Market Direction Indicator, linked below). Also incorporated a 3 color or 5 color scheme from the MDI script as a bool. It works great on any time frame, but you need to have volume data. Not sure where I originally got this (stoch-OBV, somewhere off Tradingview several years ago, thanks to the person who shared), Squeeze/MDI is Lazybear, links below.
Enjoy.
Version 5:
Moved divergence highlighting to symbols on histogram
Added coloring based on MDI
TA-Money-Flow-Version4
TA-Money-Flow-Version3
TA-Money-Flow-Version2
Squeeze-Momentum-Indicator-LazyBear
Market-Direction-Indicator-LazyBear
Trend Confirmation Indicator - Triple OBVDear all, you might wonder is there a confirmation indicator that has a high hit rate, is dependable, and could rely on the information it gives you when making a decision?
Here I present an indicator I developed specifically for cryptocurrency, in the minds of eliminating fakeouts and traps.
Trend is always invalid then there is a lack of volume, so by tracking the momentum of price direction & volume, we can have a ballpark about where the market is moving to.
On balance volume
obvshort = ema3
obvmedium = ema9
obvlong = ema26
This is a lagging indicator, which means it's not good at predicting reversal.
This is also the reason why
long signal = obvshort > obvmedium and obvshort > obvlong
shortsignal = obvshort < obvmedium and obvshort < obvlong
both without obvmedium >< obvlong
This indicator will not lie to you.
At last
Save Hong Kong, the revolution of our time.

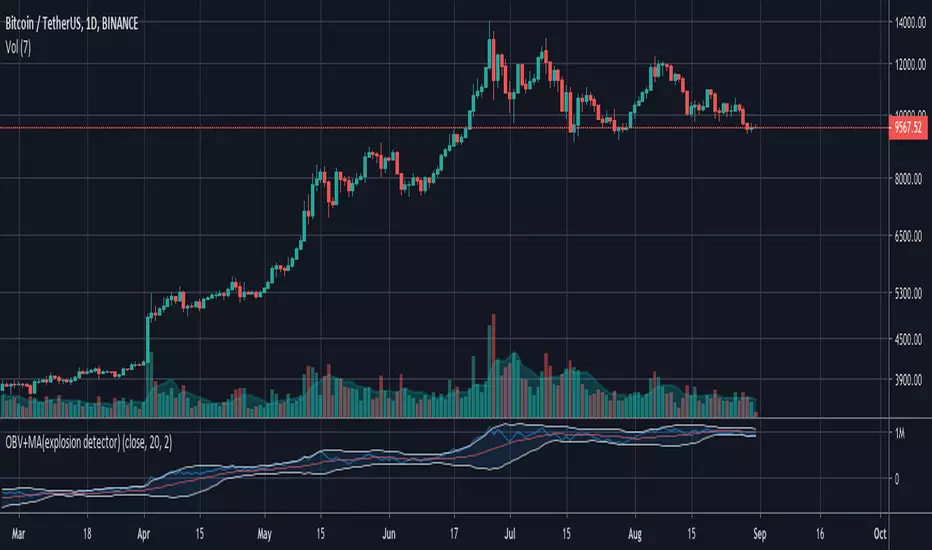
explosion detector (OBV+MA+BB)In this indicator you can find the market trends, investing time and market readiness for an explosion.
enjoy...


TA-Money Flow-Version4Updated for TV-Pine V4
This is the MACD of a stochastic OBV movement indicator and now the MACD of the Squeeze Momentum Indicator. It is good (right) to work with both price and volume...it is also good to utilize the most popular indicator ever in TV (Lazybear).
I've included highlighting based on price divergence, yellow is divergence of either OBV or SQZ, red is both divergence, and then I've also built in the "squeeze on - blue" highlighting to show follow through of divergence. It works great on any time frame, but you need to have volume data. Not sure where I originally got this (stoch-OBV, somewhere off Tradingview several years ago, thanks to the person who shared), Squeeze is Lazybear, links below.
Enjoy.
Version 4:
Updated OBV equation because TV-Pine V3 broke in V4
Included MACD of Squeeze for histogram
Included "squeeze on" highlighting
TA-Money-Flow-Version3
TA-Money-Flow-Version2
Squeeze-Momentum-Indicator-LazyBear