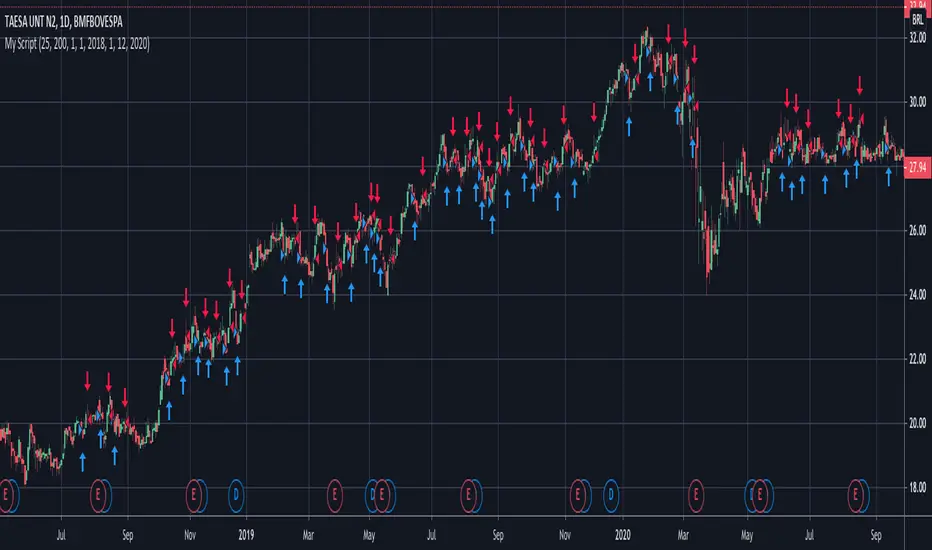
Vortex and RSI ts 2020* System long only (for shares).
* Enter if Vortex up crosses up vortex down and there is the classical second test of a close higher than previous' high
* Exit if
a) RSI crosses under 70 OR
b) on the contrary, Vortex down crosses up vortex up and there is the classical second test of a close lower than previous' low
* fixed money management to be optimized added.
Oscillators

Combo Backtest 123 Reversal & Key Reversal Down This is combo strategies for get a cumulative signal.
First strategy
This System was created from the Book "How I Tripled My Money In The
Futures Market" by Ulf Jensen, Page 183. This is reverse type of strategies.
The strategy buys at market, if close price is higher than the previous close
during 2 days and the meaning of 9-days Stochastic Slow Oscillator is lower than 50.
The strategy sells at market, if close price is lower than the previous close price
during 2 days and the meaning of 9-days Stochastic Fast Oscillator is higher than 50.
Second strategy
A key reversal is a one-day trading pattern that may signal the reversal of a trend.
Other frequently-used names for key reversal include "one-day reversal" and "reversal day."
How Does a Key Reversal Work?
Depending on which way the stock is trending, a key reversal day occurs when:
In an uptrend -- prices hit a new high and then close near the previous day's lows.
In a downtrend -- prices hit a new low, but close near the previous day's highs
WARNING:
- For purpose educate only
- This script to change bars colors.

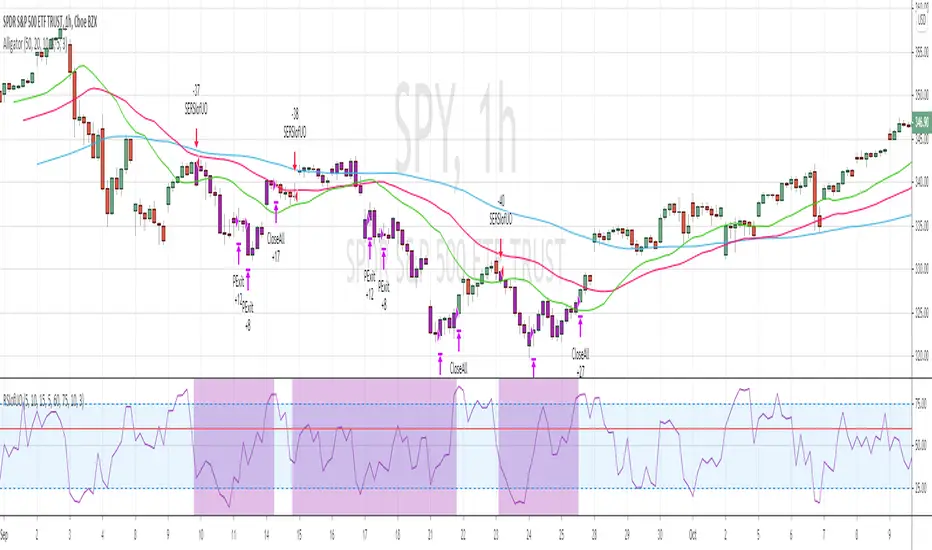
RSI of Ultimate Oscillator [SHORT Selling] StrategyThis is SHORT selling strategy with Ultimate Oscillator. Instead of drectly using the UO oscillator , I have used RSI on UO (as I did in my previous strategies )
Ultimator Oscillator settings are 5, 10 and 15
RSI of UO setting is 5
Short Sell
==========
I have used moving averages from WilliamAlligator indicator --- settings are 10(Lips), 20(teeth) and 50 (Jaw)
when Lips , Teeth and Jaw are aligned to downtrend (that means Lips < Teeth < Jaw )
Look for RSIofUO dropping below 60 ( setting parameter is Sell Line )
Partial Exit
==========
When RSIofUO crossing up Oversold line i.e 30
Cover Short / Exit
=================
When RSIofUO crosisng above overbought line i.e 70
StopLoss
========
StopLoss defaulted to 3 % , Though it is mentioned in settings , it has not been not used to calcuate and StopLoss Exit... Reason is, when RSIofUO already crossed 60 line (for SHORTING) , then it would take more efforts go up beynd 60. There is saying price takes stairs to climb up but it takes elevator to go down. I have not purely depend on this to exit stop loss, however noticed the trades in this stratgey did not get out with loss higher than when RSIofUO reaching 70 level.
Note
======
Williams Alligator is not drawn from the script. It is manually added to chart for illustration purpose. Please add it when you are using this strategy , whch woould give an idea how the strategy is taking Short Trades.
This is tested on Hourly chart for SPY
Bar color changes to purple when the strategy is in SHORT trade
Warning
========
For the eductional purposes only
Escaping of Rate from Avarage By Mustafa OZVER StrategyI simulated the EoRfA indicator with the gold price
For details about the indicator, visit my profile on tradingview
For Simulation, with default settings, we order
if Eorfa > 1 and change(eorfa) < 0
sell
if Eorfa < -1 and change(eorfa) > 0
buy
And we got
- 2.49 % profit
- 74 % profittable order from all
But only this value can not guarantee good results for trading. BE CAREFUL

Optimized RSI Strategy - Buy The Dips (by Coinrule)Buy low and sell high is every trader's mantra. While this approach looks straightforward in theory, it's sometimes challenging to put into practice. That requires stress-management to buy when price drops and resolution in selling when the price is rising. RSI is a useful tool to implement long-term and effective trading strategies. The script presents an optimized RSI trading strategy that uses a Moving average to spot the best time to buy the dip.
The strategy buys when the RSI is lower than 35, and at the same time, the price is below the MA100. In this way, the approach helps avoid catching early dips, increasing buying when the bottom approaches.
The position closes when the RSI value is above 65 . Depending on the volatility of the coins that the strategy will trade, it's possible to adjust the RSI exit value to chase larger profits.
The setup is optimized on a 15-minutes time frame and trading cryptocurrencies versus USD or stable coins.
The strategies was backtested over 150 times with multiple setups and coin to assess the best long-term system.
The strategy assumes each order to trade 30% of the available capital. A trading fee of 0.1% is taken into account. The fee is aligned to the base fee applied on Binance, which is the largest cryptocurrency exchange.

Combo Backtest 123 Reversal & Keltner Channel This is combo strategies for get a cumulative signal.
First strategy
This System was created from the Book "How I Tripled My Money In The
Futures Market" by Ulf Jensen, Page 183. This is reverse type of strategies.
The strategy buys at market, if close price is higher than the previous close
during 2 days and the meaning of 9-days Stochastic Slow Oscillator is lower than 50.
The strategy sells at market, if close price is lower than the previous close price
during 2 days and the meaning of 9-days Stochastic Fast Oscillator is higher than 50.
Second strategy
The Keltner Channel, a classic indicator
of technical analysis developed by Chester Keltner in 1960.
The indicator is a bit like Bollinger Bands and Envelopes.
WARNING:
- For purpose educate only
- This script to change bars colors.
Combo Backtest 123 Reversal & Kaufman Moving Average Adaptive// This is combo strategies for get a cumulative signal.
//
First strategy
This System was created from the Book "How I Tripled My Money In The
Futures Market" by Ulf Jensen, Page 183. This is reverse type of strategies.
The strategy buys at market, if close price is higher than the previous close
during 2 days and the meaning of 9-days Stochastic Slow Oscillator is lower than 50.
The strategy sells at market, if close price is lower than the previous close price
during 2 days and the meaning of 9-days Stochastic Fast Oscillator is higher than 50.
Second strategy
Everyone wants a short-term, fast trading trend that works without large
losses. That combination does not exist. But it is possible to have fast
trading trends in which one must get in or out of the market quickly, but
these have the distinct disadvantage of being whipsawed by market noise
when the market is volatile in a sideways trending market. During these
periods, the trader is jumping in and out of positions with no profit-making
trend in sight. In an attempt to overcome the problem of noise and still be
able to get closer to the actual change of the trend, Kaufman developed an
indicator that adapts to market movement. This indicator, an adaptive moving
average (AMA), moves very slowly when markets are moving sideways but moves
swiftly when the markets also move swiftly, change directions or break out of
a trading range.
WARNING:
- For purpose educate only
- This script to change bars colors.
Combo Backtest 123 Reversal & Kase Dev Stops This is combo strategies for get a cumulative signal.
First strategy
This System was created from the Book "How I Tripled My Money In The
Futures Market" by Ulf Jensen, Page 183. This is reverse type of strategies.
The strategy buys at market, if close price is higher than the previous close
during 2 days and the meaning of 9-days Stochastic Slow Oscillator is lower than 50.
The strategy sells at market, if close price is lower than the previous close price
during 2 days and the meaning of 9-days Stochastic Fast Oscillator is higher than 50.
Second strategy
The Kase Dev Stops system finds the optimal statistical balance between letting profits run,
while cutting losses. Kase DevStop seeks an ideal stop level by accounting for volatility (risk),
the variance in volatility (the change in volatility from bar to bar), and volatility skew
(the propensity for volatility to occasionally spike incorrectly).
Kase Dev Stops are set at points at which there is an increasing probability of reversal against
the trend being statistically significant based on the log normal shape of the range curve.
Setting stops will help you take as much risk as necessary to stay in a good position, but not more.
You can change long to short in the Input Settings
Please, use it only for learning or paper trading. Do not for real trading.
WARNING:
- For purpose educate only
- This script to change bars colors.

Crypto BOT lower timeframesThis is a crypto bot designed for lower time frames.
Its made of 2 EMA, one fast and one slower . They are combined together with Stochastic, MACD and price action patterns.
For entries we have multiple conditions :
First we check if one of our last 4 closed candles crossed above or below the faster EMA. After that for long, we check that last close is above the fast EMA, that the fast ema is above the slower EMA, at the same time that the histogram from MACD is positive and that we have crossover with the oversold line on stochastic. For the short , the opposite of long.
For exit we have TP/SL mechanic based on price % movement, in this example if the price moved 10% from the initial position it will exit.

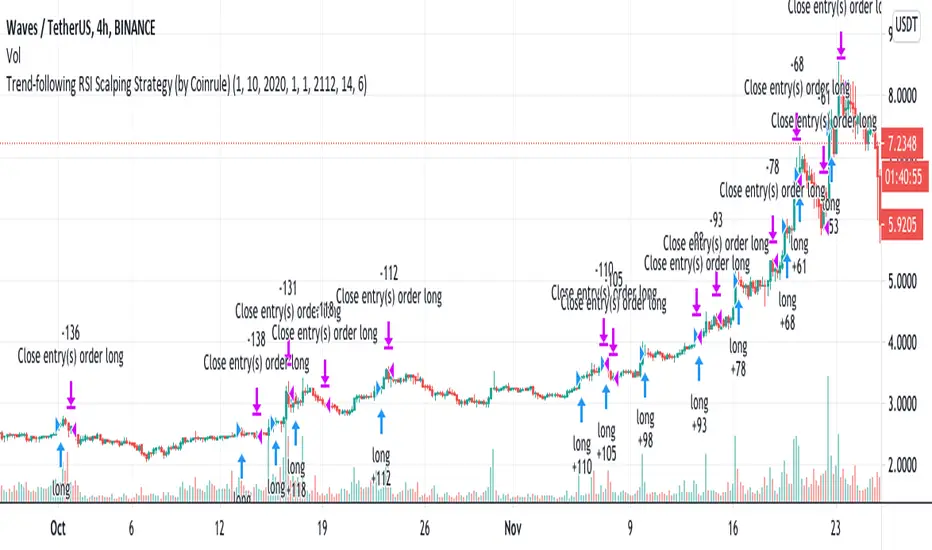
Trend-following RSI Strategy According to classical technical analysis, an RSI above 70 should signal overbought conditions and, thus, a sell-signal. Cryptocurrencies represent a whole new asset class, and they reshape the classical concepts of technical analysis. FOMO-buying can be very powerful, and coins can remain in overbought conditions enough to provide excellent opportunities for scalping trades on the upside.
Building a trend-following trading strategy based on the RSI, which is generally considered a contrarian indicator, may sound counter-intuitive. Over 200 backtests prove that this is a very interesting long-term setup.
The setup is optimized on a 4-hours time frame and trading cryptocurrencies versus USD or stable coins.
The strategy tries to catch coins on sustained uptrends to take advantage of further upside.
The strategy's buy-signal triggers when a coin has an RSI above 70 on a 4-hours time frame.
The strategy sells the coin if a profit of 6% is achieved. Alternatively, it closes the position if the RSI drops below 55, indicating a possible weakening of the trend.
The strategy assumes each order to trade 30% of the available capital. A trading fee of 0.1% is taken into account. The fee is aligned to the base fee applied on Binance, which is the largest cryptocurrency exchange.
IFR2 - RSI2When the price is over the EMA and RSI 2 is less then 25 so an open order is going to be made and the strike is the high of the antepenultimate price
Momentum Explosion 2CCI RSI"Momentum Explosion Template for Mobile Metatrader", that is a trading system trend momentum based on two Commodity Channel Index (CCI) , RSI and two Moving Averages.The trading signals are generated by the crossing of the moving averages confirmed by the agreement of the two CCIs and the RSI.
Two Moving averages Filtered by double CCI and RSI
Credit is to Dimitri Author Beejay (Forex Factory)
Trading Rules Momentum Explosion
Buy
EMA 8 crosses upward SMA 26.
CCI 34 periods > 0
CCI 55 periods > 0
RSI 26 > 48.
Sell
EMA 8 crosses downward SMA 26.
CCI 34 periods < 0
CCI 55 periods < 0
RSI 26 < 48.

Combo Backtest 123 Reversal & Inertia Strategy This is combo strategies for get a cumulative signal.
First strategy
This System was created from the Book "How I Tripled My Money In The
Futures Market" by Ulf Jensen, Page 183. This is reverse type of strategies.
The strategy buys at market, if close price is higher than the previous close
during 2 days and the meaning of 9-days Stochastic Slow Oscillator is lower than 50.
The strategy sells at market, if close price is lower than the previous close price
during 2 days and the meaning of 9-days Stochastic Fast Oscillator is higher than 50.
Second strategy
The inertia indicator measures the market, stock or currency pair momentum and
trend by measuring the security smoothed RVI (Relative Volatility Index).
The RVI is a technical indicator that estimates the general direction of the
volatility of an asset.
The inertia indicator returns a value that is comprised between 0 and 100.
Positive inertia occurs when the indicator value is higher than 50. As long as
the inertia value is above 50, the long-term trend of the security is up. The inertia
is negative when its value is lower than 50, in this case the long-term trend is
down and should stay down if the inertia stays below 50.
WARNING:
- For purpose educate only
- This script to change bars colors.

Combo Backtest 123 Reversal & Ichimoku2c This is combo strategies for get a cumulative signal.
First strategy
This System was created from the Book "How I Tripled My Money In The
Futures Market" by Ulf Jensen, Page 183. This is reverse type of strategies.
The strategy buys at market, if close price is higher than the previous close
during 2 days and the meaning of 9-days Stochastic Slow Oscillator is lower than 50.
The strategy sells at market, if close price is lower than the previous close price
during 2 days and the meaning of 9-days Stochastic Fast Oscillator is higher than 50.
Second strategy
Ichimoku Strategy
WARNING:
- For purpose educate only
- This script to change bars colors.
Combo Backtest 123 Reversal & High and Low Levels This is combo strategies for get a cumulative signal.
First strategy
This System was created from the Book "How I Tripled My Money In The
Futures Market" by Ulf Jensen, Page 183. This is reverse type of strategies.
The strategy buys at market, if close price is higher than the previous close
during 2 days and the meaning of 9-days Stochastic Slow Oscillator is lower than 50.
The strategy sells at market, if close price is lower than the previous close price
during 2 days and the meaning of 9-days Stochastic Fast Oscillator is higher than 50.
Second strategy
This script shows a high and low period value.
Width - width of lines
SelectPeriod - Day or Week or Month and etc.
LookBack - Shift levels 0 - current period, 1 - previous and etc.
WARNING:
- For purpose educate only
- This script to change bars colors.
Guerilla Fear/Greed Index StrategyThis strategy combines NAAIM Exposure Index and the Equity Put/Call Ratio into Fear/Greed Index that oscillates between 0 and 100.
It smooths all of these values and enters a trade when Fear reaches a certain threshold and exits when Greed reaches a certain threshold.
I don't really know if this is a great indicator or not, but the results on various indexes are pretty good, especially NASDAQ:TQQQ .
Was inspired by the knowledge gained following RolandoSantos .

Combo Backtest 123 Reversal & High Low Bands This is combo strategies for get a cumulative signal.
First strategy
This System was created from the Book "How I Tripled My Money In The
Futures Market" by Ulf Jensen, Page 183. This is reverse type of strategies.
The strategy buys at market, if close price is higher than the previous close
during 2 days and the meaning of 9-days Stochastic Slow Oscillator is lower than 50.
The strategy sells at market, if close price is lower than the previous close price
during 2 days and the meaning of 9-days Stochastic Fast Oscillator is higher than 50.
Second strategy
As the name suggests, High low bands are two bands surrounding the underlying’s
price. These bands are generated from the triangular moving averages calculated
from the underlying’s price. The triangular moving average is, in turn, shifted
up and down by a fixed percentage. The bands, thus formed, are termed as High
low bands. The main theme and concept of High low bands is based upon the triangular
moving average.
WARNING:
- For purpose educate only
- This script to change bars colors.

Combo Backtest 123 Reversal & High - EMA Strategy This is combo strategies for get a cumulative signal.
First strategy
This System was created from the Book "How I Tripled My Money In The
Futures Market" by Ulf Jensen, Page 183. This is reverse type of strategies.
The strategy buys at market, if close price is higher than the previous close
during 2 days and the meaning of 9-days Stochastic Slow Oscillator is lower than 50.
The strategy sells at market, if close price is lower than the previous close price
during 2 days and the meaning of 9-days Stochastic Fast Oscillator is higher than 50.
Second strategy
This indicator plots the difference between the High (of the previous period)
and an exponential moving average (13 period) of the Close (of the previous period).
You can use in the xPrice any series: Open, High, Low, Close, HL2, HLC3, OHLC4 and ect...
It buy if indicator above 0 and sell if below.
WARNING:
- For purpose educate only
- This script to change bars colors.
888 BOT #backtest█ 888 BOT #backtest (open source)
This is an Expert Advisor 'EA' or Automated trading script for ‘longs’ and ‘shorts’, which uses only a Take Profit or, in the worst case, a Stop Loss to close the trade.
It's a much improved version of the previous ‘Repanocha’. It doesn`t use 'Trailing Stop' or 'security()' functions (although using a security function doesn`t mean that the script repaints) and all signals are confirmed, therefore the script doesn`t repaint in alert mode and is accurate in backtest mode.
Apart from the previous indicators, some more and other functions have been added for Stop-Loss, re-entry and leverage.
It uses 8 indicators, (many of you already know what they are, but in case there is someone new), these are the following:
1. Jurik Moving Average
It's a moving average created by Mark Jurik for professionals which eliminates the 'lag' or delay of the signal. It's better than other moving averages like EMA , DEMA , AMA or T3.
There are two ways to decrease noise using JMA . Increasing the 'LENGTH' parameter will cause JMA to move more slowly and therefore reduce noise at the expense of adding 'lag'
The 'JMA LENGTH', 'PHASE' and 'POWER' parameters offer a way to select the optimal balance between 'lag' and over boost.
Green: Bullish , Red: Bearish .
2. Range filter
Created by Donovan Wall, its function is to filter or eliminate noise and to better determine the price trend in the short term.
First, a uniform average price range 'SAMPLING PERIOD' is calculated for the filter base and multiplied by a specific quantity 'RANGE MULTIPLIER'.
The filter is then calculated by adjusting price movements that do not exceed the specified range.
Finally, the target ranges are plotted to show the prices that will trigger the filter movement.
Green: Bullish , Red: Bearish .
3. Average Directional Index ( ADX Classic) and ( ADX Masanakamura)
It's an indicator designed by Welles Wilder to measure the strength and direction of the market trend. The price movement is strong when the ADX has a positive slope and is above a certain minimum level 'ADX THRESHOLD' and for a given period 'ADX LENGTH'.
The green color of the bars indicates that the trend is bullish and that the ADX is above the level established by the threshold.
The red color of the bars indicates that the trend is down and that the ADX is above the threshold level.
The orange color of the bars indicates that the price is not strong and will surely lateralize.
You can choose between the classic option and the one created by a certain 'Masanakamura'. The main difference between the two is that in the first it uses RMA () and in the second SMA () in its calculation.
4. Parabolic SAR
This indicator, also created by Welles Wilder, places points that help define a trend. The Parabolic SAR can follow the price above or below, the peculiarity that it offers is that when the price touches the indicator, it jumps to the other side of the price (if the Parabolic SAR was below the price it jumps up and vice versa) to a distance predetermined by the indicator. At this time the indicator continues to follow the price, reducing the distance with each candle until it is finally touched again by the price and the process starts again. This procedure explains the name of the indicator: the Parabolic SAR follows the price generating a characteristic parabolic shape, when the price touches it, stops and turns ( SAR is the acronym for 'stop and reverse'), giving rise to a new cycle. When the points are below the price, the trend is up, while the points above the price indicate a downward trend.
5. RSI with Volume
This indicator was created by LazyBear from the popular RSI .
The RSI is an oscillator-type indicator used in technical analysis and also created by Welles Wilder that shows the strength of the price by comparing individual movements up or down in successive closing prices.
LazyBear added a volume parameter that makes it more accurate to the market movement.
A good way to use RSI is by considering the 50 'RSI CENTER LINE' centerline. When the oscillator is above, the trend is bullish and when it is below, the trend is bearish .
6. Moving Average Convergence Divergence ( MACD ) and ( MAC-Z )
It was created by Gerald Appel. Subsequently, the histogram was added to anticipate the crossing of MA. Broadly speaking, we can say that the MACD is an oscillator consisting of two moving averages that rotate around the zero line. The MACD line is the difference between a short moving average 'MACD FAST MA LENGTH' and a long moving average 'MACD SLOW MA LENGTH'. It's an indicator that allows us to have a reference on the trend of the asset on which it is operating, thus generating market entry and exit signals.
We can talk about a bull market when the MACD histogram is above the zero line, along with the signal line, while we are talking about a bear market when the MACD histogram is below the zero line.
There is the option of using the MAC-Z indicator created by LazyBear, which according to its author is more effective, by using the parameter VWAP ( volume weighted average price ) 'Z-VWAP LENGTH' together with a standard deviation 'STDEV LENGTH' in its calculation.
7. Volume Condition
Volume indicates the number of participants in this war between bulls and bears, the more volume the more likely the price will move in favor of the trend. A low trading volume indicates a lower number of participants and interest in the instrument in question. Low volumes may reveal weakness behind a price movement.
With this condition, those signals whose volume is less than the volume SMA for a period 'SMA VOLUME LENGTH' multiplied by a factor 'VOLUME FACTOR' are filtered. In addition, it determines the leverage used, the more volume , the more participants, the more probability that the price will move in our favor, that is, we can use more leverage. The leverage in this script is determined by how many times the volume is above the SMA line.
The maximum leverage is 8.
8. Bollinger Bands
This indicator was created by John Bollinger and consists of three bands that are drawn superimposed on the price evolution graph.
The central band is a moving average, normally a simple moving average calculated with 20 periods is used. ('BB LENGTH' Number of periods of the moving average)
The upper band is calculated by adding the value of the simple moving average X times the standard deviation of the moving average. ('BB MULTIPLIER' Number of times the standard deviation of the moving average)
The lower band is calculated by subtracting the simple moving average X times the standard deviation of the moving average.
the band between the upper and lower bands contains, statistically, almost 90% of the possible price variations, which means that any movement of the price outside the bands has special relevance.
In practical terms, Bollinger bands behave as if they were an elastic band so that, if the price touches them, it has a high probability of bouncing.
Sometimes, after the entry order is filled, the price is returned to the opposite side. If price touch the Bollinger band in the same previous conditions, another order is filled in the same direction of the position to improve the average entry price, (% MINIMUM BETTER PRICE ': Minimum price for the re-entry to be executed and that is better than the price of the previous position in a given %) in this way we give the trade a chance that the Take Profit is executed before. The downside is that the position is doubled in size. 'ACTIVATE DIVIDE TP': Divide the size of the TP in half. More probability of the trade closing but less profit.
█ STOP LOSS and RISK MANAGEMENT.
A good risk management is what can make your equity go up or be liquidated.
The % risk is the percentage of our capital that we are willing to lose by operation. This is recommended to be between 1-5%.
% Risk: (% Stop Loss x % Equity per trade x Leverage) / 100
First the strategy is calculated with Stop Loss, then the risk per operation is determined and from there, the amount per operation is calculated and not vice versa.
In this script you can use a normal Stop Loss or one according to the ATR. Also activate the option to trigger it earlier if the risk percentage is reached. '% RISK ALLOWED'
'STOP LOSS CONFIRMED': The Stop Loss is only activated if the closing of the previous bar is in the loss limit condition. It's useful to prevent the SL from triggering when they do a ‘pump’ to sweep Stops and then return the price to the previous state.
█ BACKTEST
The objective of the Backtest is to evaluate the effectiveness of our strategy. A good Backtest is determined by some parameters such as:
- RECOVERY FACTOR: It consists of dividing the 'net profit' by the 'drawdown’. An excellent trading system has a recovery factor of 10 or more; that is, it generates 10 times more net profit than drawdown.
- PROFIT FACTOR: The ‘Profit Factor’ is another popular measure of system performance. It's as simple as dividing what win trades earn by what loser trades lose. If the strategy is profitable then by definition the 'Profit Factor' is going to be greater than 1. Strategies that are not profitable produce profit factors less than one. A good system has a profit factor of 2 or more. The good thing about the ‘Profit Factor’ is that it tells us what we are going to earn for each dollar we lose. A profit factor of 2.5 tells us that for every dollar we lose operating we will earn 2.5.
- SHARPE: (Return system - Return without risk) / Deviation of returns.
When the variations of gains and losses are very high, the deviation is very high and that leads to a very poor ‘Sharpe’ ratio. If the operations are very close to the average (little deviation) the result is a fairly high 'Sharpe' ratio. If a strategy has a 'Sharpe' ratio greater than 1 it is a good strategy. If it has a 'Sharpe' ratio greater than 2, it is excellent. If it has a ‘Sharpe’ ratio less than 1 then we don't know if it is good or bad, we have to look at other parameters.
- MATHEMATICAL EXPECTATION: (% winning trades X average profit) + (% losing trades X average loss).
To earn money with a Trading system, it is not necessary to win all the operations, what is really important is the final result of the operation. A Trading system has to have positive mathematical expectation as is the case with this script: ME = (0.87 x 30.74$) - (0.13 x 56.16$) = (26.74 - 7.30) = 19.44$ > 0
The game of roulette, for example, has negative mathematical expectation for the player, it can have positive winning streaks, but in the long term, if you continue playing you will end up losing, and casinos know this very well.
PARAMETERS
'BACKTEST DAYS': Number of days back of historical data for the calculation of the Backtest.
'ENTRY TYPE': For '% EQUITY' if you have $ 10,000 of capital and select 7.5%, for example, your entry would be $ 750 without leverage. If you select CONTRACTS for the 'BTCUSDT' pair, for example, it would be the amount in 'Bitcoins' and if you select 'CASH' it would be the amount in $ dollars.
'QUANTITY (LEVERAGE 1X)': The amount for an entry with X1 leverage according to the previous section.
'MAXIMUM LEVERAGE': It's the maximum allowed multiplier of the quantity entered in the previous section according to the volume condition.
The settings are for Bitcoin at Binance Futures (BTC: USDTPERP) in 15 minutes.
For other pairs and other timeframes, the settings have to be adjusted again. And within a month, the settings will be different because we all know the market and the trend are changing.

Crypto ZigZag RSI strategy 15minThis strategy is designed for crypto markets like ETHUSD/T, BTCUSD/T and so on.
It works amazingly with 15 min time frames.
Its idea consists in :
We have the RSI indicator, and with it we check for the crossover with overbought and oversold levels. At the same time we have the zigzag which is made from the higher highs and the lower lows between a specific price movement in %.
For entries, they are going to be based on the crossover of rsi with overbought or oversold levels , combined together with cross over 0 line from the the zigzag.
At the same time the strategy has the posibility to go only long, only short or both.
Let me know if you have any questions.

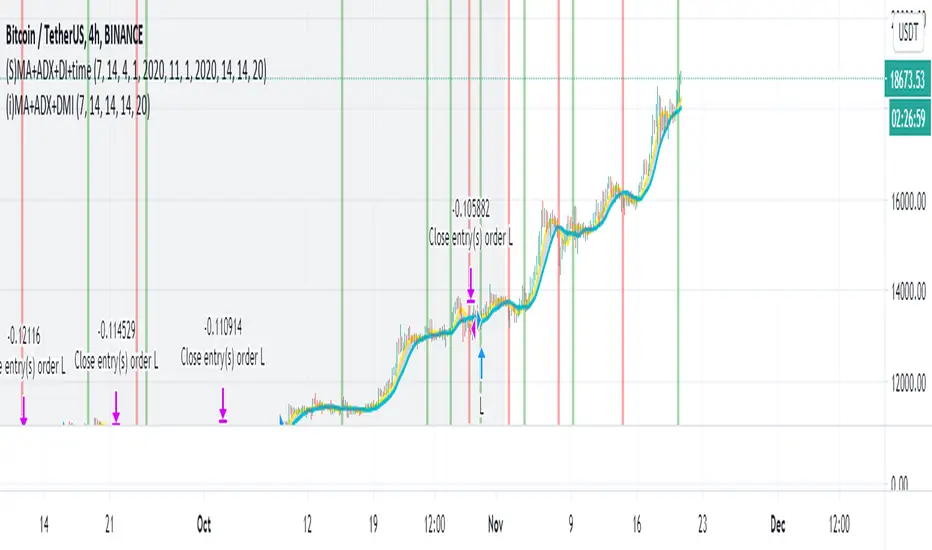
Simple Moving Average + ADX + DMI + Time Range Test
Use long and short moving average to look for a potential price in/out. (default as 14 and 7, bases on the history experience)
ADX and DMI to prevent the small volatility and tangling MA.
This script allows you to set the beginning & end time to test the bullish & bearish market.
If you want an indicator version, here is it.
Thanks.
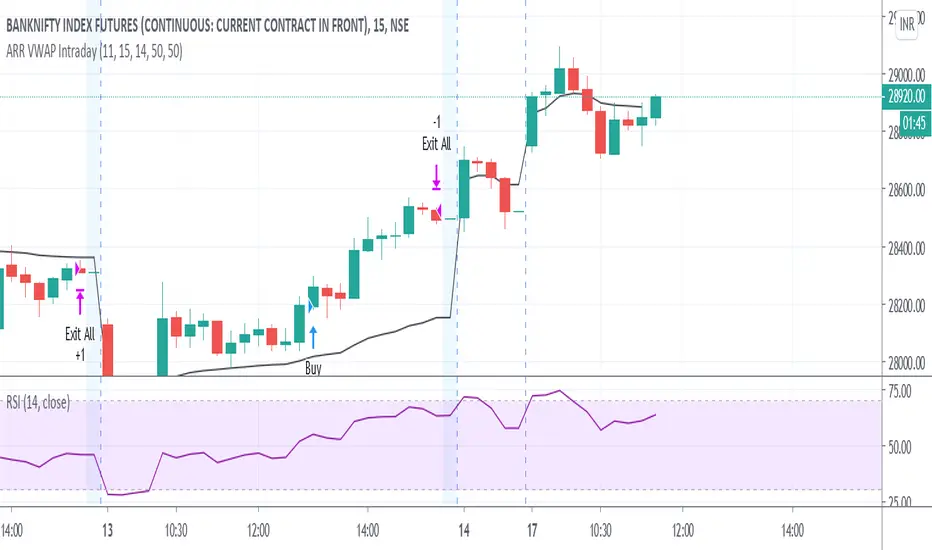
ARR VWAP IntradayIntra day VWAP Strategy
Strategy is
Buy when vwap goes up and RSI above 50 (Can be modified) .
Sell wehn vwap goes down and rsi bellow 50 (Can be modified)
Exit all at market close hour specified
Combo Backtest 123 Reversal & Volume SMA This is combo strategies for get a cumulative signal.
First strategy
This System was created from the Book "How I Tripled My Money In The
Futures Market" by Ulf Jensen, Page 183. This is reverse type of strategies.
The strategy buys at market, if close price is higher than the previous close
during 2 days and the meaning of 9-days Stochastic Slow Oscillator is lower than 50.
The strategy sells at market, if close price is lower than the previous close price
during 2 days and the meaning of 9-days Stochastic Fast Oscillator is higher than 50.
Second strategy
Volume and SMA
WARNING:
- For purpose educate only
- This script to change bars colors.
