Moving Gain Loss PercentTracks the percentage gain/loss in three ranges:
single candle (can be turned on or off)
custom range of candles
custom range of candles
For example, with a range of 3 candles, and the serie:
1 - close 10
2 - close 5
3 - close 20
The moving gain would be:
1 - close 10 - gain 10, infinite%
2 - close 5 - gain 5, infinite%
3 - close 18 - gain 8, 80%
Or, for example if the range is 12 candles on a monthly chart, then the result is the Year-To-Date gain/loss plotted as a percentage.
Percent

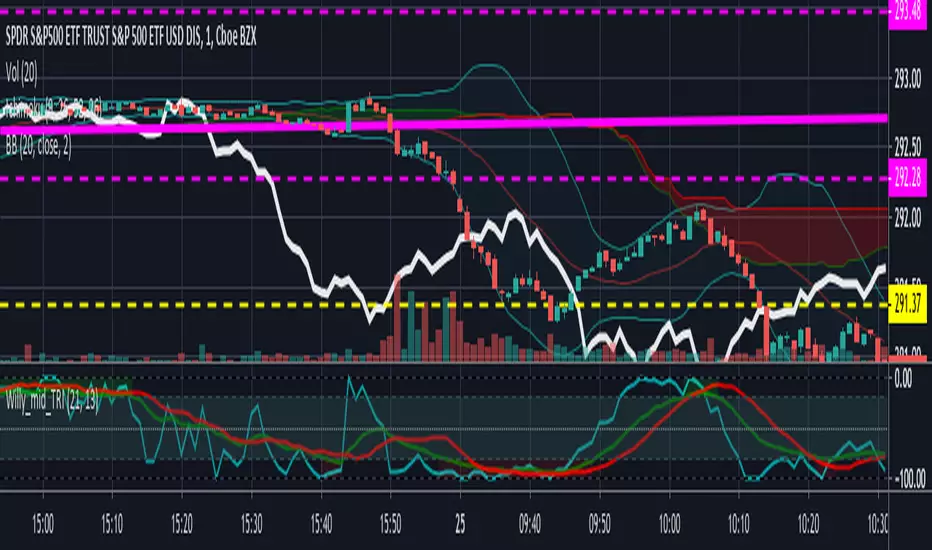
Willams %R with 13 EMA and 13 SMAThis is standard Williams %R originally written by another user that I modified. Credit to him whose name escapes me at the moment. The green line is 13EMA and red line is 13SMA (offset by 2 for timing trades). Great for very quick trades/day trades. Green over red = long. Red over Green = short.
Beware: this is still a choppy indicator. You'll need to use it with the Ichimoku lagging span, chop indiicator, adx, or some other method of avoiding getting chopped to death trying to take every signal.
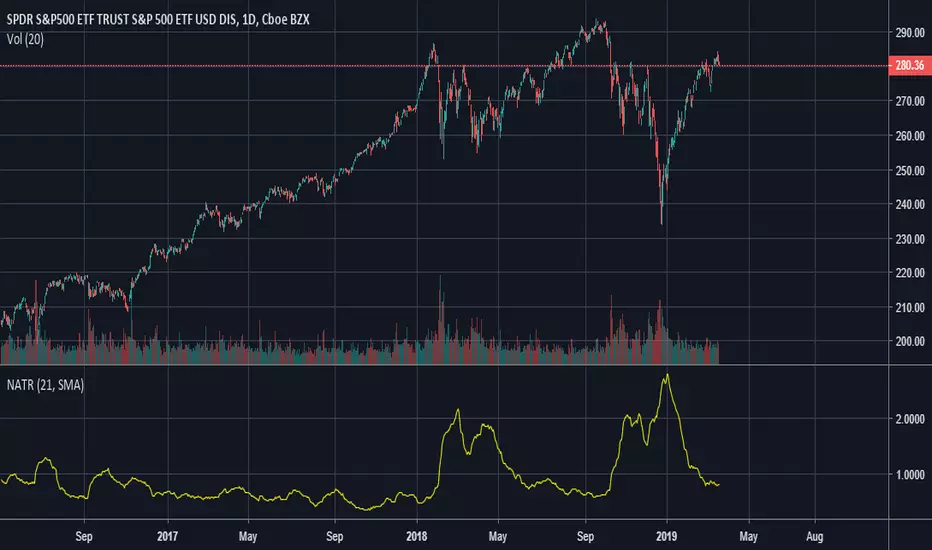
Normalized Average True RangeThis is a Normalized ATR, which means it displays ATR as a percentage instead of absolute price. For example, a value of 1 indicates a true range of 1% in a given period.
This indicator creates a moving average of the volatility of a product going back X number of periods and is useful for deciding what to trade. For example, if used on a daily chart, one product displays a value of 4 you can reasonably expect it to have larger price swings and movement compared to another product that displays 1.
It does not predict direction, rather the size of moves.
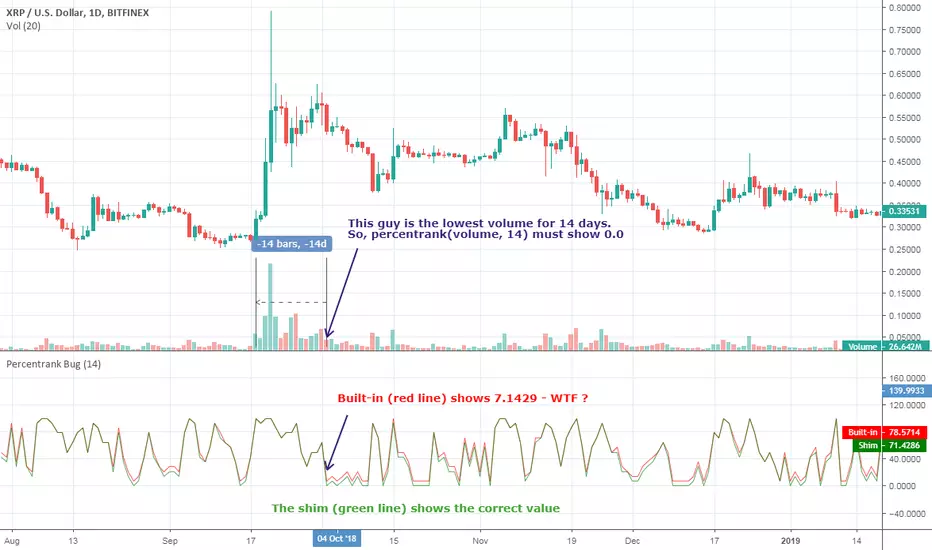
[RESEARCH] Percentrank BugI found a bug with built-in percentrank function. Sometimes it gives unexpected and incorrect results. You can see a one of them on the chart.
ALL scripts which use percentrank function are affected. No matter which version they use, no matter who is their author - ALL scripts which use this built-in function can work incorrectly.
If you want to avoid this bug use _percentrank function (the "shim" ) - you can find it in the script.
NOTE: Don't push on TradingView Support or Pine Core Team because they already know about this issue and work on the fix. I publish it to warn you.
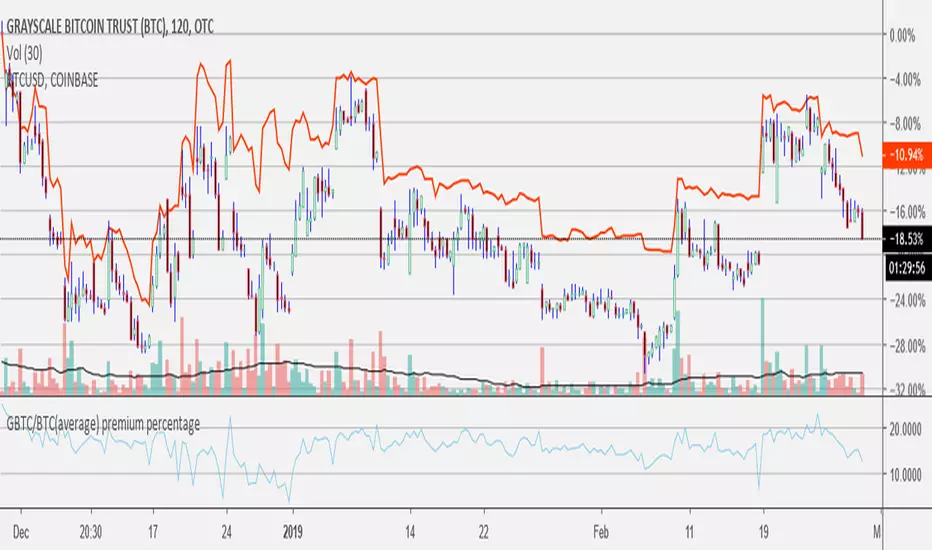
GBTC/BTC(average) premium percentageaverage bitcoin price used (average between bitfinex, coinbase, bitstamp, bittrex, and gemini).
find current amount of bitcoin per share here: grayscale.co
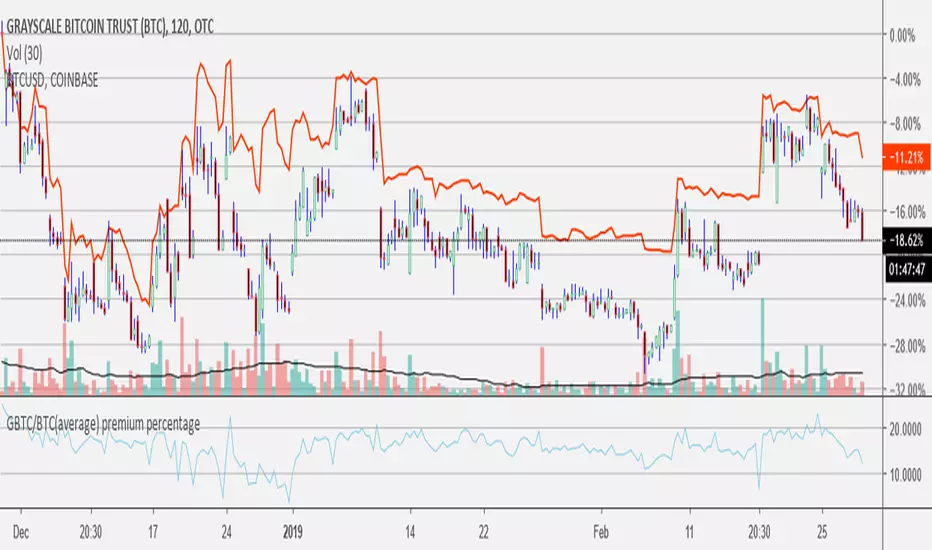
GBTC/BTC(average) premium percentageI updated the GBTC premium percentage indicator to the average bitcoin price (average between bitfinex, coinbase, bitstamp, bittrex, and gemini). I also left this new script open so you can update the amount of bitcoin per share because it is always changing. you can find the amount of bitcoin per share at grayscale.co half way down on the left.
% Volume (%V)Read about it in the book of Buff Pelz Dormeier "Investing with Volume Analysis: Identify, Follow, and Profit from Trends" .
Normalized volume ( %V ) is a concept that uses an average of volume to plot volume. The volume total for the current bar is divided by the average volume (over the last n bars) to form a ratio. This ratio is multiplied by 100 and plotted in the same way that traditional volume is plotted as vertical bars on the horizontal plane, which creates a normalized volume scale of 0 to 100 . This allows for easy interpretation of volume’s relative movements, with 50 being typical or average volume, numbers below 50 being light volume, and numbers above 50 being heavier volume.
Good luck!

Average True Range (ATR %) Stop Loss CalculatorThis indicator takes the average of a series of ATR to calculate what I would consider an optimum stop loss placement represented in percentage (read below for full overview).
While the data is plotted what is most helpful are the actual numbers presented and for my charts I remove most of the plotting.
This indicator is most helpful on the daily timeframe but can be used for all timeframes such as the 4HR, 1HR or even 15M.
This indicator should not be used alone. It should be used in conjunction with proper price action analysis. It’s also a great indicator if you chart using Value Channels. Ideally you want your stop placement to be below at least one core Value Channel boundary range. In addition to standard support and resistance and some key moving averages the market respects. This also works best when trading with the prevailing BIAS of the instrument (bull or bear).
Cryptos: Generally, that means you’re buying on retracements that fit the end of a structured move. The other option is using this in a clear up trending market where the pull backs are clearly being supported with buying.
FOREX: I built another indicator for FOREX search: ATRPIPS with SL
WTI: Helpful but I have different rules for when I trade WTI. I rely upon VCs and diagnal VCs much more when trading this.
Equities: Helpful but with the increase of volatility as well as uncertainty of Bias of the market-- this should be used as more of a guide than
What is most important is the actual percentage numbers but I've found graphing 1-3 of the actual ATRs is helpful. The rest just uncheck the checkbox in the options.
Indicator Overview:
Value 1 - 3 Period ATR (maroon)
Value 2 - 7 Period ATR (green)
Value 3 - 30 Period ATR (blue)
Value 4 - 90 Period ATR (blue, bold)
Value 5 - 1 Period ATR (green)
Value 6 - 1 Period ATR (red)
Value 6 – Prime Stop Loss Placement (maroon). This is the average of all above ATRs multiplied by 1.5
Value 7 - Move Left (red). Experimental value. This is the difference between (prime stop loss) and 1 day period move. Two ways to use this value. Use as a tighter stop loss placement. The other option is to use as a retrace target for purchase and using the Prime Stop Placement value as you’re stop loss.
All ATRs use the LOW price of the period. After testing both the low and close I’ve settled on the low to capture the most volatility you will typically experience.
Once again, this indicator should be used in conjunction with your proven trade system.
Also, by knowing what the values are within the indicator you could just eye ball what would be the best stop placement depending on the ATR or 1 or 2 ATRs you find most represent the volatility of what you are trading.
I will be expanding on this indicator by bringing in average measured moves as well as volume analysis and most likely with color changes and modifications.
Background:
While using and refining my trade system I've noticed that most moves happen in 3 periods. So we start there. The 7 period is good for a 24 hour market such as crypto (although weekend trading can be a hit or miss) and to some extent FOREX. The longer periods of 30 & 90 are to smooth out the data set. The final value of the 1 period is to bring a little more recency to the calculation.
Why multiply the average by 1.5? I've found in my own trading and system I built to be the best placement (in conjunction with VCs) to ensure you're stop isn't to close and is within the instrument you are trading volatility .
I'm looking at making this more intelligent as well as take into account volume and structured moves.

% Range [NeoButane]A range based on a user chosen top and bottom. With that the:
Middle of range
+/- 0.25% / 0.5% / 1% away from middle of the range
+/- 0.5% / 1% away from range top and range bottom
are given.
A list of my premium indicators: medium.com
Below are some examples of how a range can be chosen:
Another way is choosing a higher timeframe candle that encapsulates most of the trading range.

Synergy StatsSynergy Stats
This indicator is intended to complement the Synergy indicator. It provides the following statistics:
A percentage showing how often the two assets move in the opposite direction over a given lookback period.
Similarly, another percentage showing how often the two assets move in the same direction over the same lookback period.
Count the number of times (occurrences) when the two assets move in the same direction for more than 4 bars.
Count the number of times the alternative asset moves more than x%
Count the number of times that chart asset moved in the same direction of the alternative asset when the alternative asset moved more than x%
Both indicators were developed for use in an investigation/tutorial using Pine Script to analyse Gold and US Dollar Index correlation.
The full free post can be found here: backtest-rookies.com

SynergySynergy
This indicator was developed for use in an investigation/tutorial using Pine Script to analyse Gold and US Dollar Index correlation.
The first indicator shall measure the percentage change between the open and close of each bar and compare it to the same percentage change of an alternative asset. Additionally, we shall color the background when the two assets move in the same direction. This should allow us to more easily see when the two assets move together and spot trends in their moment.
The yellow bars show use the percentage change in the price of gold. The blue bars show the percentage change in the price of the US Dollar index. If the bar is above zero, it means that the asset closed up. Conversely, if it is below zero, it means the asset closed down. Finally, the grey bars show bars in which the two assets closed in the same direction.
It can be used in conjunction with a second indicator (to be published soon) that provides statistics generated from this indicator.
The full free post can be found here: backtest-rookies.com

Gain Loss V2This is the Version Two of my Gain/Loss percent indicator, it's really simple but very handy indicator, when you go into a position, most of the time during a day trade, you don't have enough time to sit back and calculate the percentage of your gain or loss specially with maker/taker fee and leverage and sometimes funding fee you should pay the exchanges/brokers.
The default values for maker/taker and funding fees are set as you would encounter in Bitmex exchange. every 8 hours you are in position, you should rise the number of funding you pay by one, The rest will be calculated automatically.
Normally you need to set the fees for maker/taker and fund based on what your broker/exchange tells you once, then each trade, you set your entry point, being it a margin trade or not, and finally if it's margin, the direction and the leverage and that would be it.
Again, most of the time traders don't change their leverages, so you would set it for once and after that, you just set the entry, click the direction boolean and that is it.
The source is hidded but every one can use the script.

ec tEST cODE FOR pERCENT DIFERENCE ////////////////////////////////////////////////////////////
// Copyright by HPotter v1.0 04/04/2015
// Percent difference between price and MA
////////////////////////////////////////////////////////////
study(title="Percent difference between price and MA")
source = close
useCurrentRes = input(true, title="Use Current Chart Resolution?")
resCustom = input(title="Use Different Timeframe? Uncheck Box Above", type=resolution, defval="60")
smd = input(true, title="Show MacD & Signal Line? Also Turn Off Dots Below")
sd = input(true, title="Show Dots When MacD Crosses Signal Line?")
sh = input(true, title="Show Histogram?")
macd_colorChange = input(true,title="Change MacD Line Color-Signal Line Cross?")
hist_colorChange = input(true,title="MacD Histogram 4 Colors?")
res = useCurrentRes ? period : resCustom
fastLength = input(12, minval=1), slowLength=input(26,minval=1)
signalLength=input(9,minval=1)
fastMA = ema(source, fastLength)
slowMA = ema(source, slowLength)
Length = input(9, minval=1)
Length2= input(36,minval=1)
Length3= input(81,minval=1)
AveragePrice= input(9,minval=1)
Length5= input(3,minval=1)
xSMA = (sma(close, Length)+sma(close, Length2)+sma(close, Length3))/3
pSAM=sma(close, AveragePrice)
nRes = (pSAM - xSMA) * 100 / close
signalnRes = sma(nRes, signalLength)
macd = nRes
signal = sma(macd, signalLength)
hist = macd - signal
outMacD = security(tickerid, res, macd)
outSignal = security(tickerid, res, signal)
outHist = security(tickerid, res, hist)
histA_IsUp = outHist > outHist and outHist > 0
histA_IsDown = outHist < outHist and outHist > 0
histB_IsDown = outHist < outHist and outHist <= 0
histB_IsUp = outHist > outHist and outHist <= 0
//MacD Color Definitions
macd_IsAbove = outMacD >= outSignal
macd_IsBelow = outMacD < outSignal
plot_color = hist_colorChange ? histA_IsUp ? aqua : histA_IsDown ? blue : histB_IsDown ? red : histB_IsUp ? maroon :yellow :gray
macd_color = macd_colorChange ? macd_IsAbove ? lime : red : red
signal_color = macd_colorChange ? macd_IsAbove ? yellow : yellow : lime
circleYPosition = outSignal
// MA COLOR DEFINITION
maColor = change(nRes)>0 ? green : change(nRes)<0 ? red : na
mA_IsAbove = nRes> 0
mA_IsBelow = nRes< 0
plot( nRes, color=maColor, style=line, title="MMA", linewidth=2)
//plot(smd and signalnRes ? signalnRes : na, title="Signal Line", color=signal_color, style=line ,linewidth=2)
//plot(smd and outMacD ? outMacD : na, title="MACD", color=macd_color, linewidth=4)
//plot(smd and outSignal ? outSignal : na, title="Signal Line", color=signal_color, style=line ,linewidth=2)
//plot(sh and outHist ? outHist : na, title="Histogram", color=plot_color, style=histogram, linewidth=4)
plot(sd and cross(outMacD, outSignal) ? circleYPosition : na, title="Cross", style=circles, linewidth=4, color=macd_color)
hline(0, '0 Line', linestyle=solid, linewidth=2, color=white)
//////ALERT cONDITION////
src = input(close)
ma_1 = sma(src, 20)
ma_2 = sma(src, 10)
c = cross(ma_1, ma_2)
alertcondition(c, title='Red crosses blue', message='Red and blue have crossed!')
d = cross(outMacD, outSignal)
alertcondition(d, title='GOING DOWN', message='SELL!')
//
//e = cross(outSignal, outMacD)
//alertcondition(E, title='GOING UP', message='BUY!')

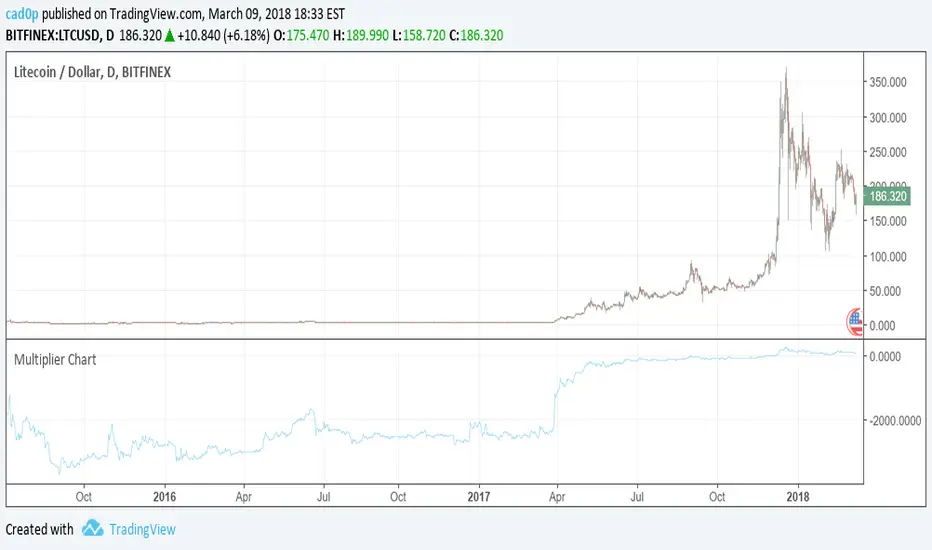
Multiplier ChartI am proposing an alternative to the percent change.
An alternative that is symmetrical to both positive and negative change, unlike percentage change.
The simple idea is to have a positive number if the reference value (called val in the script) is lower than the stock value and needs to be multiplied;
a negative number instead if the reference number is higher than the stock value, so the reference value needs to be divided.
Multiplying all by 100 to give clearer and more readable results, the Multiplier would have a huge gap between +100 and -100, because a stock multiplied by 1 or divided by 1 are the same thing.
So we need to compromise and move all positive numbers down by 100 and all negative numbers up by 100. This actually gives a similar result to percentage change, and it is actually identical in the positive range.
The fundamental difference lies on the negative range, which is completely symmetrical. So if a stock goes up 100 points one day (doubles), and the next it goes down another 100 points (halves), at the end of the second day the stock has the same value as it had at the beginning of the first day! On percentage change it would be +100% the first day and -50% the second.
We mustn't undervalue the human tendency to compare a 1% change to a -1% change, but they do not mean the same even if they seem to indicate so.
A clear example of this can be found on CMC 0.60% -3.56% -3.56% (CoinMarketCap), in which each day are shown the best and worst performing coins of the day. So you might see a +900% there in the top performing, but you'll never see a -900%, because percentage change cannot go further than -100%. It is a fundamentally asymmetric scale that can confuse people a lot especially in those fast moving new markets.ù
I am welcome to feedback and all kinds of opinions and critics.
Some interesting things to note: you can use it as a percentage change indicator or as a different perspective to a stock chart. In fact, it lets you see how big of a difference it made buying coins when they were very cheap, because when they are cheap a difference of what it might seem nothing is amplified by all the gains that the stock/coin made after. So, looking at coins charts using this indicator shows how "not flat" were the early days, which in a normal chart are flattened to 0.

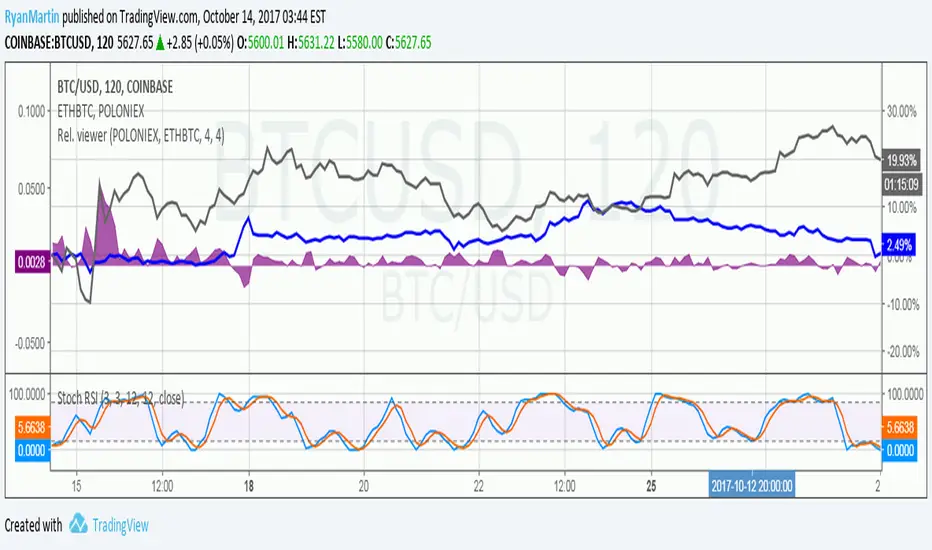
Price relation viewer - add percent change of two symbols (BETA)This script is very much beta!
This is a simple script to visualize how two symbols move in relation to each other. For example if the underlying symbol is a 2x Gold ETF (meaning the ticker moves at 2x the spot price of gold---if gold goes up 3% this ticker should go up 6%) and the comparison symbol is an 2x inverse gold ETF (at gold up 3% this should move down 6%). If these ETFs were 100% accurate at tracking the price of gold then this tool would report a value of zero at all times.
Day 1
Ticker - $10
Comparison - $10
Day 2
Ticker - $12
Comp - $11
This tool value - |20%| + -|10%| = 10%
It uses a short simple moving average to smooth things out a bit (see inputs). It is important to keep your axis scale in mind when using this! Two symbols that are always near zero mean they are offsetting each other very well but the value displayed might range from 0 to 0.005, but the graphed area can make it look extreme if autoscaled.
This is a tool with very specific uses : comparing how one digital currency moves in relation to bitcoin's price, comparing how gold moves in relation to silver, etc.
Correction Percent and Days SinceS
Use this script to see the depths of corrections and also to see how long it has been since a correction.
I published this script because the last time the SNP has gone this long without a 5% correction was 1996 excluding bear markets of course.
NOTE: This script is a 2 in 1. In order to see correction depth only use the first 3 plot settings as visible.
In order to see the days since a correction use the last two plot settings.

Percent Change per CandleThis indicator allows you to quickly view the true % change per candlestick (prev close > current close), but it also has 3 other customizable values for you to set your own % change conditions (such as open > high). Feel free to edit the script to suit your own needs as well.


Gain LossA very simple yet, very useful and lovely oscillator, most of the time, when we have a position in a trend and we want to take a look at percentage of our gain or loss, we need to use the "Price Range" tool time and time again, this, in some trades that you would buy and sell in less than an hour, can become a problem, also, if you have few different things going on in the chart, the price range tool will only add more to it.
Using this little oscillator, you can put the price of your position in the input section and close the settings window and watch your gain or loss percentage in real time.
