Kviateq - Session Pivots for CryptoPretty much the exact same indicator as my other Session Pivots, however this one also shows the weekends and the session times are set to Bitmex exchange (note: I'm in a GMT+7 timezone myself).
Pivot Points
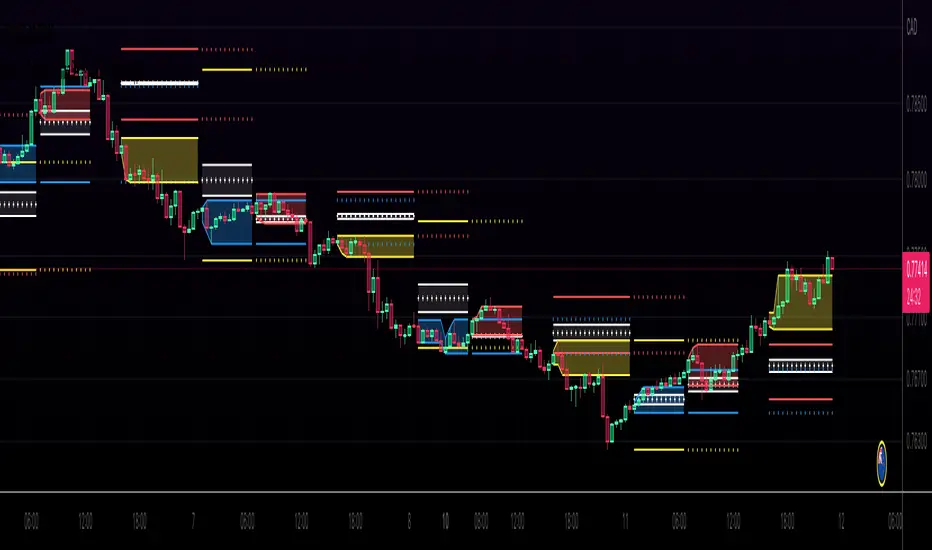
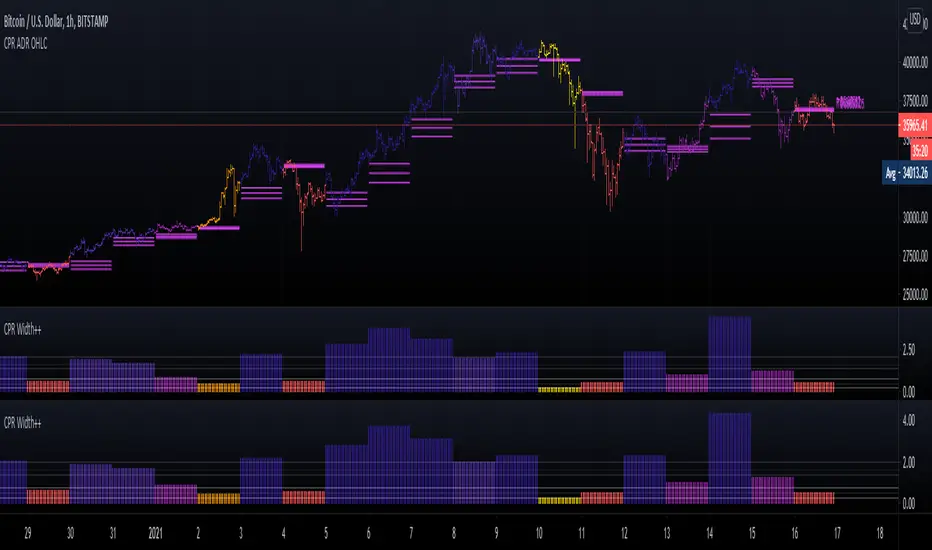
CPR Width + MTF, Offset and BarcolorsDue to the request of some users and inspired by "5 Day ADR ICT Intraday Tracker" I updated "CPR Width" and added extra functionality for your convenience.
Point and Figure Chart - LiveHello Traders,
This is "Point and Figure Chart (PnF)" script that run in separated window in real time. The separated PnF chart window is timeless, so no relation with the time on the chart. PnF chart consist of "X" and "O" columns. While "X" columns represents rising prices, "O" column represents a falling price. If you have no idea about what PnF charting is then you should search for "Point and Figure Charting" on the net and get some info before using this script.
Now lets talk about details. PnF Chart requires at least two variables to be set => Box size and Reversal. Box size represents the size of each X/O in PnF chart and the reversal is used to calculate new X/O or reversal. for example if currrent column is X column then for new "X", "box size * 1" move is needed and for new "O" column or reversal, "box size * revelsal" move is needed. in the script I use lines as X/O columns.
In the options you can set "Box Size Assingment Method". you have 3 options Traditional, ATR, Percentage . what are they?
Traditional: user-defined box size, means you can set the box size as you wish, using the option . if you use this option then you should set it accordingly.
ATR : that's dynamic box size scaling and on each columns it's calculated once, you can set length for ATR
Percentage: that's also dynamic box size scaling according to closing price when new column appeared. if you use this option then you should set it accordingly.
Reversal: The reversal is typically 3 but you can change it as you wish
"Change Bar Color by PnF Trend": if you enable this option then bar color changes by PnF columns, by default it's not enabled
"Change Column Color When Breakout Occurs": PnF color changes if Double Top/Bottom breakout accours. enabled by default and you can set the colors as you wish using the options
"Change Bar Color When Breakout Occurs": bar colors changed if Double Top/Bottom breakout accours. enabled by default and you can set the colors as you wish using the options
the script checks only Double Top/Bottom breakouts at the moment. there are many other breakouts such Triple/Quadruple, Ascending/Descending Triple Top/Bottom breakouts, Catapult etc.
Also the script shows new X/O level and reversal Levels in PnF window. An example:
If you enable "Change Bar Color by PnF Trend" option:
An example if you disable the option "Change Column Color When Breakout Occurs
You may want to see my another/older "Point and Point Chart" script as well. you can find it in my profile/published scripts and in the Public Library. I use same PnF calculation algorithm in both scripts.
Enjoy!

Tweezers and Kangaroo TailHello Traders,
Here Tweezers and Kangaroo Tail script is in your service. The script searches for Tweezer / Kangaroo Tail candlestick patterns and shows them as T (Tweezer) and K (Kangaroo Tail). Thanks to RorschachT who game me the idea and some details while working on this script.
What are these candlestick patterns?
Tweezers :
- A tweezers pattern occurs when the highs/Lows of two candlesticks occur at almost exactly the same level
- Both candles must have wicks
- Bigger Wick / Smaller Wick rate should not be greater than 150% ( 150% by default and you have option to change it)
- First Candle must be highest/lowest for last 5 candles (5 by default and you have option to change it)
- The level of High for Top, Low for Bottom must be almost lower than 20% of the bigger wick of tweezer candles (20% by default and you have option to change it)
- The Candles can be right next to each other or apart but not more than 12 candles apart (12 by default and you have option to change it)
- You will see that Tweezers pattern occurs frequently
Kangaroo Tail:
- Looks almost like a Hammer or Inverted Hammer candle
- They have both its open and close in the top or bottom third of the candle
- There must be some space/room on the left of the kangaroo tail
- The open and close of the Kangaroo Tail candle must be inside the range of the previous candlestick
- The next candle should create a new high or new low
- You have several options to set details about the "Room" that should be on the left and also options for Wick/Body rates
- You can see example below
You have option to enable/disable any of these patterns.
as far as I have tested they are strong reversal patterns but none of the indicators or patterns may not be enough alone. so you should confirm the signals using other indicators or tools
If you need more information you can find a lot of info on the net ;)
Example: Tweezers - Aparted
Example: Kangaroo Tail - Bullish
Enjoy!

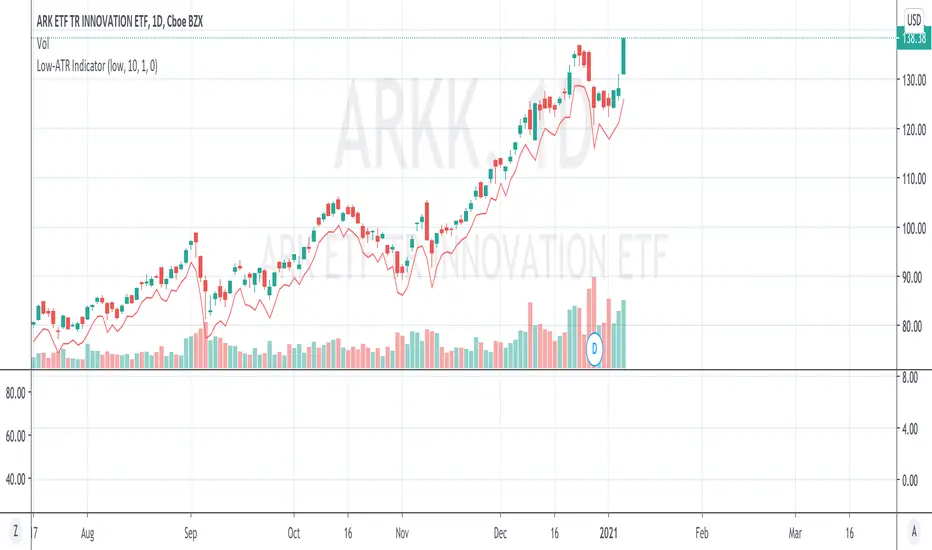
Low-ATR IndicatorWe often want to use a stop loss at a certain low - N*ATR,
But it is too troublesome to manually calculate a certain day low - ATR.
This indicator simply calculates it for you, by marking the value of day low - ATR.
By default the hardcoded ATR value is 0, which means "Uses the ATR at that day with configured look back period".
If you want to use a specific ATR value, e.g.
1) You want to set the stop loss using today's ATR but another day's day low (Very often)
2) You want to set the stop loss in another timeframe - N*ATR
You can type in the value of ATR into the "hardcoded ATR" field.
(Actually this should be the most used way)
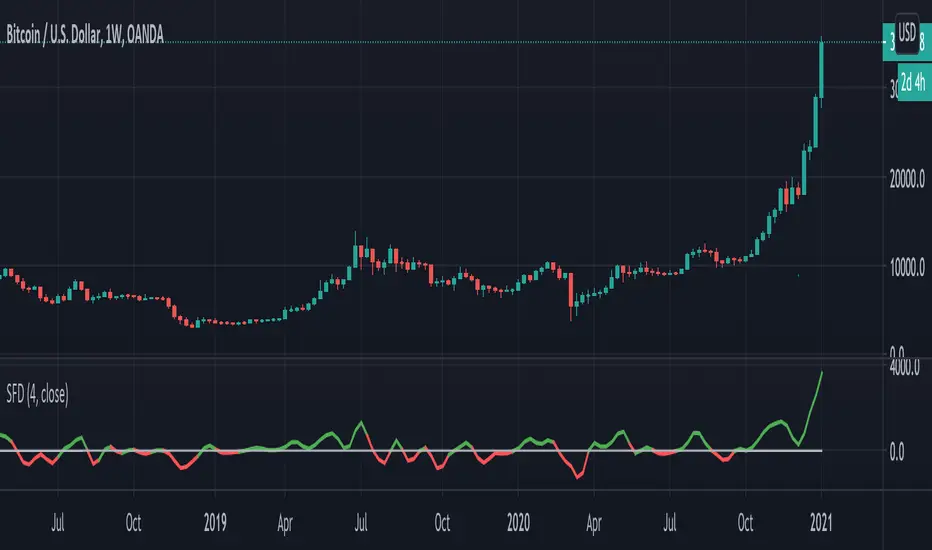
Smooth First Derivative IndicatorIntroducing the Smooth First Derivative indicator. For each time step, the script numerically differentiates the price data using prior datapoints from the look-back window. The resulting time derivative (the rate of price change over time) is presented as a centered oscillator.
A first derivative is a versatile tool used in functional data analysis. When applied to price data, it can be applied to analyze momentum, confirm trend direction, and identify pivot points.
Model Description:
The model assumes that, within the look-back window, price data can be well approximated by a smooth differentiable function. The first derivative can then be computed numerically using a noise-robust one-sided differentiator. The current version of the script employs smooth differentiators developed by P. Holoborodko (www.holoborodko.com). Note that the Indicator should not be confused with Constance Brown's Derivative Oscillator.
Input parameter:
The Bandwidth parameter sets the number of points in the moving look-back window and thus determines the smoothness of the first derivative curve. Note that a smoother Indicator shows a greater lag.
Interpretation:
When using this Indicator, one should recall that the first derivative can simply be interpreted as the slope of the curve:
- The maximum (minimum) in the Indicator corresponds to the point at which the market experiences the maximum upward (downward) slope, i.e., the inflection point. The steeper the slope, the greater the Indicator value.
- The positive-to-negative zero-crossing in the Indicator suggests that the market has formed a local maximum (potential start of a downtrend or a period of consolidation). Likewise, a zero-crossing from negative to positive is a potential bullish signal.

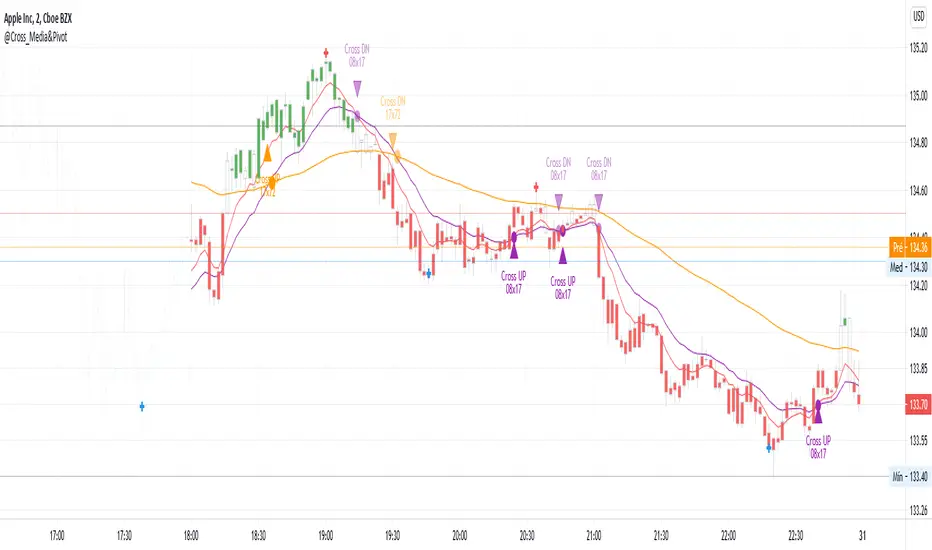
@Cross_Media&Pivot&TRADE_Entry_and_ExitThis script uses the functions plot(), cross(), plotcandle(), pivothigh() and pivotllow(). You can see the candles in the color green, above EMA 72 (Exponetional Move Average), and the color red, below EMA72. You can identify the position of the crossing UP and DOWN of the EMA 08 x EMA 17, EMA 17 x EMA72. You can identify the TRADE ENTRY points with the pivot high and TRADE EXIT with the pivot Low.
[JRL] ATR Pivot PointsThis indicator plots pivot points with support and resistance lines based on average true range (ATR). ATR is one of the best volatility and trading range predictors, so it can be very useful for finding confluence in any strategy.

Fibonacci Pivots Monthly and Weekly Full (no history)Fibonacci Pivots Monthly and Weekly Full (no history)
Inspired by FxChartAnalyst trader, with his great Monthly Weekly Daily Pivot Points Standard indicator
www.tradingview.com
This indicator calculates and plots both Monthly and Weekly pivots on a chart. Pivots are based on the Fibonacci ratios of the previous Month/Week candle close.
Good luck everyone!

|AG| VWAP ANALYSIS|AG| VWAP ANALYSIS
The volume-weighted average price (VWAP) is a trading benchmark used by traders that gives the average price security has traded throughout the day, based on both volume and price.
It is important because it provides traders with insight into both the trend and value of the security.
VWAP is calculated by adding up the $ traded for every transaction (price multiplied by the number of shares traded) and then dividing by the total shares traded.
A detailed formula and calculations could be found here:
-> fanf2.user.srcf.net
Actually, TradingView has an option for Anchored Vwap is a really good implementation for specific analysis.
The following script takes into account the #Time_Period_Change and plots the VWAP calculation.
The #Time_Period Available for this script are:
-> Day
-> Week
-> Monthly
-> Quarter
-> Year
1. The option that we have is the SOURCE:
-> HLC3 (High, Low, Close)/3 is the right way to calculate VWAP.
-> But I included other traditional options:
-> open, high, low, close, hl2, hlc3, ohlc4
2. The option of Turn ON/OFF VWAP
-> Timeframe selection:
-> All, 1. Day, 2. Week, 3. Month, 4. Quarter, 5. Year, 6. >=Weekly, 7. >=Montlhy
-> With this, we could select the time for plotting the VWAP. And some cool features such as >= that we are going to plot different Timeframes VWAP calculations.
-> Vwap Label:
-> We could select if show labels or not
3. The option of Turn ON/OFF Previous VWAP Level
-> VWAP of one selected Time Period is going to end with a final price this level most of the time is retested and gives us a good opportunity for entry into one trade.
Or could be used as Stop Loss.
-> Timeframe selection:
-> 1. Day, 2. Week, 3. Month, 4. Quarter, 5. Year, 6. >=Weekly, 7. >=Montlhy, 8. >=Daily
-> Factor
-> The factor options lead as increment the extension of the previous time period.
-> Example: D is the normal time period and with factor, we change from 1D to 2D in order to extend previous levels of VWAP.
->The Factor option is only available in 1. Day and 2. Week. With a Min Value of 1 and a Maximum Value of 50.
-> Labels:
-> We could select if show labels or not
4. The option of Turn ON/OFF Standard Deviation Bands
-> Label:
-> We could select if show labels or not
-> Timeframe selection:
-> 1. Day, 2. Week, 3. Month, 4. Quarter, 5. Year
5. The option of Turn ON/OFF Previous Standard Deviation
-> Timeframe selection:
-> None, 1. Day, 2. Week, 3. Month, 4. Quarter, 5. Year, 6. >=Weekly, 7. >=Montlhy, 8. Quarter & Year
-> STDEV LEVEL
-> Since there are different options for Standard Deviation I included 4 options
-> 1
-> 2
-> 3
-> User Selection
-> In this option we could select any NUMBER for STVDEV 0.25 of step.
-> Label:
-> We could select if show labels or not
6. The Lockback Setting
-> This Script also includes an option to only plot a certain amount of days back.
The main reason in order to have a more clear chart.
-> We could select between:
-> PLOT ALL
-> CUSTOM
-> If we select Custom Then we could select the Number of Days Back that is going to be plotted.
7. Color Theme
Here we select the color (Visual Desing)
-> Color Theme
-> Text Color
-> Here I use the recent input.color option added for TradingView making the color selection really simple
8. Time Period Highlighter
-> In this option, we could select one time period in order to plot one tiny background and identify the change in the time period.
-> Timeframe selection:
-> 1. Day, 2. Week, 3. Month, 4. Quarter, 5. Year
9. Label Offset
-> Finally, this option leads us to change the position of the labels into the X-axis by default 20.
This script has many options the combinations and the possibilities of making different analyses are bast.
Here some examples of what we could make:
DEFAULT SETTING:
PREVIOUS VWAP FOR TIME PERIOD >= WEEK
(work good as S&D levels)
PREVIOUS VWAP Week WITH A FACTOR OF 4
STANDARD DEVIATION BANDS - DAY
STANDARD DEVIATION BANDS - WEEK
STANDARD DEVIATION BANDS - MONTH
STANDARD DEVIATION BANDS - QUARTER
STANDARD DEVIATION BANDS - YEAR
PREVIOUS STANDARD DEVIATION - DAY SDTV 3
PREVIOUS STANDARD DEVIATION - WEEK SDTV 3
USING STANDARD DEVIATION BANDS - WEEK
WITH LOCKBACK -> PLOT ALL
WITH CUSTOM 30 DAYS
I think the options possibilities of analysis using #VWAP are truly awesome.
I like the relationship that one previous VWAP has with Standard Pivot Points.
Good Luck,
Anderson,

Fibonacci Pivots Daily Full (no history)Inspired by FxChartAnalyst trader here, with his great Monthly Weekly Daily Pivot Points Standard indicator
www.tradingview.com
This one calculates Fibonacci ratios only and plots pivots based on the previous Daily close candle.

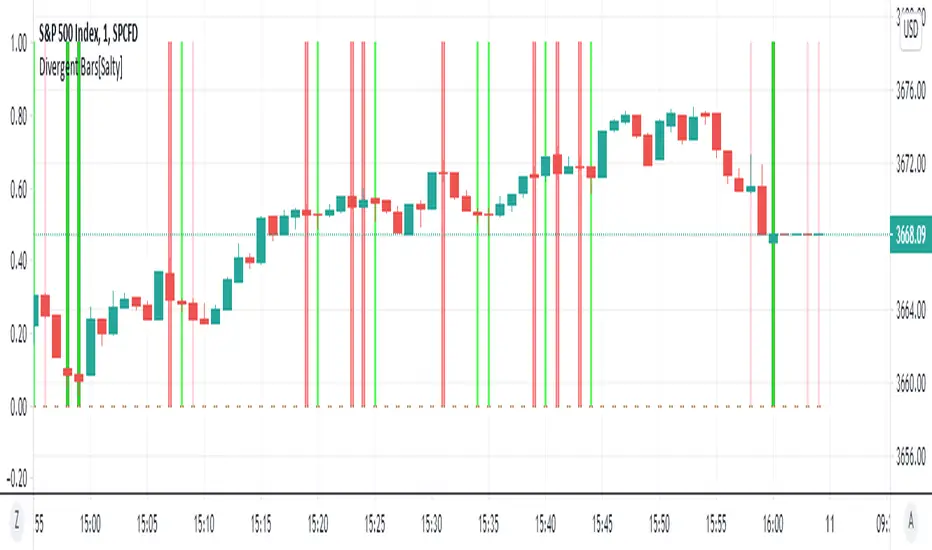
Divergent Bars[Salty]Updated an existing Divergent Bar script to be able to show all divergent bars. There are 2 set of divergent bars that can be turned on. The original one based on price and alligator lines, and a new second one that shows ALL divergent bars. The second set has lighter lines and colors to differentiate them from the filtered alligator divergent bars.
RSI Multi Time FrameHello Traders,
Recently we got new features in Pine such Arrays of Lines, Labels and Strings. Thanks to the Pine Team! ( here )
So I decided to make new style of Multi Time Frame indicator and I used Array of Lines in this script. here it is, RSI Multi Time Frame script. it shows RSI for current time frame as it is and also it gets RSI for the Higher Time Frame and converts it and shows it as in time frame. as you can see, RSI for HTF moves to the right on each candle until higher time frame was completed.
You have color and line width options for both RSI, also if you want you can limit the number of bars to show higher time frame RSI by the option " Number of Bars for RSI HTF ", following example show RSI HTF for 100 bars.
Most of you know that old style Multi Time Frames indicators was like:
Hope you like this new Multi time frame style ;)
Enjoy!

Swing Reversal IndicatorSwing Reversal Indicator was meant to help identify pivot points on the chart which indicate momentum to buy and sell. The indicator uses 3 main questions to help plot the points:
Criteria
Did price take out yesterday's high or low?
Is today's range bigger than yesterday? (Indicates activity in price)
Is the close in the upper/lower portion of the candle? Thus, indicating momentum in that direction
This indicator was built to help me find pivot points for directional options trading however can be used for equities and forex swing trading and other strategies. Used in conjunction with a BB extreme can provide good setups.
Alerts are available for both the long and the short positions and the indicator will repaint as price moves.
The character Plotted can be changed in the settings
The size of the candle area can be changed as well if you want to tighten/loosen the trigger points based on the third question above.

Adoptive Supertrend - PivotsAnother experiment with Supertrend by making use of pivot point high/lows.
Trailing Stop types used in this indicator are:
ATR - plain ATR based supertrend
Breakout - ATR based supertrend combined with breakout. (Trailing triggered only if price change is higher than HighPriceChange multiplier times ATR.
Pivot Points - Trail only when new pivots created. Pivot stop multiplier is used below pivot low.
Combined - Combine everything together

Socrates Reversals PlotterSOCRATES Reversals Plotter
Introduction
This script is intended for users of the Socrates platform. This is located on ask-socrates.com which is property of AE Global Solutions, Inc.
Background
It is cumbersome to track the reversal system on the proprietary platform especially when users want to combine it with real-time data on TradingView. Some active reversals, especially those on the daily level change quite often and updating the charts regularly takes a lot of time. Therefore I've created this script primarily for the following reasons:
Simplify the process of keeping the charts updated
Standardize the look of the graphs so that they can be quickly understood when shared with other users for studying purposes and discussions
Features
v1.0 (20201203)
Add up to 5 daily/weekly/monthly reversals which will plot and format automatically
Easily hide daily/weekly/monthly reversals as a group
Highlight the range of a given unit of reversals. This takes the values of the lowest bullish and highest bearish reversals. They are expected to be written in #01 fields
Don't forget to use the option to "Save As Default" at the bottom of the Inputs tab. This will make sure all your reversals are stored even if you remove the indicator from your graph

Excellent ADXThe Average Directional movement indeX (ADX) is an indicator that helps you determine the trend direction, pivot points, and much more else! But it looks not so easy as other famous indicators. It seems strange or even terrible, but don't be afraid. Let's understand how it works and get its power into your analysis tactics.
In the beginning, imagine a drunk man goes through a ladder: step by step. Up, up, down, up, down, down, up...
How can we understand which direction he goes? Exactly! We can count the number of steps in each direction. In the above example, in the upward – 4, in the downward – 3. So, it looks like he goes in an upward direction.
The ADX indicator counts the same steps, but for price. The size of each step equals 1 ATR for "DI Length" candles. On the indicator chart, we have the green and red lines. The green line represents a number of steps upward. The red line shows one downward. When the red line upper green, then the price goes below, then the trend is directed down. Later the green line comes above the red one, and then the trend changes the direction to upward. Wow? After that, you can easy detect the trend direction on the market!
But it is still not the end. On the chart, we also have the fat blue line. This is the ADX line, and it represents the power of the trend. It is calculated from a distance between the green and red curves. The ADX line value grows if the distance is increased. If the movement is really powerful, then a number of steps into a direction much more prominent than one in an opposed direction. Then the blue line grows faster. But if the growth has stopped and the blue line turns back or already had changed self-direction, then it is a signal that the trend has ended too. It's an excellent sign to close the position (but not always). Easy? Not quite. Thresholds help you there. The indicator has two additional parameters: upper and lower thresholds to evaluate the trend-over signal strength. An u-turn of the ADX line above the upper threshold sends a strong signal. If one occurs between both thresholds, it is a bit weak signal. But if the blue line goes below the lower threshold, it looks like there is no trend, and the price goes side. We can also say that the price goes side when the ADX value gradually falls down.
The Excellent ADX indicator helps you catch pivot/pullback signals based on green, red, and blue lines. Each such signal is highlighted as a green (buy) or red (sell) dot on the plot. The size of the dot represents the strength of the signal. You can also check the position of green and red lines from each other to determine the trend direction and the place where it has been changed. The Excellent ADX indicator helps you there too. It highlights the trend direction by the background-color, so you'll never miss it! The Excellent ADX good compliance with the Price Channel indicator built for the same length. You can use them together to be on a trend wave always!

Evan Cabral's Quarter Theory by MrTuanDoanThis indicator is based on Evan Cabral's Market Timing Strategy.
In Binary Option or High Frequency Forex (HFX), it's very common to see the market make reversals at hours and half hours.
This indicator just simply draw vertical lines at each quarter of the hour.
You should change the color and opacity to fit your chart style.
With this indicator, you're going to know when to positions yourself with more accuracy on trade setups.
Note
It works best if you take your reversal trade at the top of the hour using your other (overbought/oversold) confirmation using RSI, Stoch RSI, DMI, etc.
It works better if you take your trade at resistance/support zones
You should pay attention to the direction the market is going before the hour (or half hour) and looking at how the direction changes going into the hour or after it.
Please backtest before taking real trades

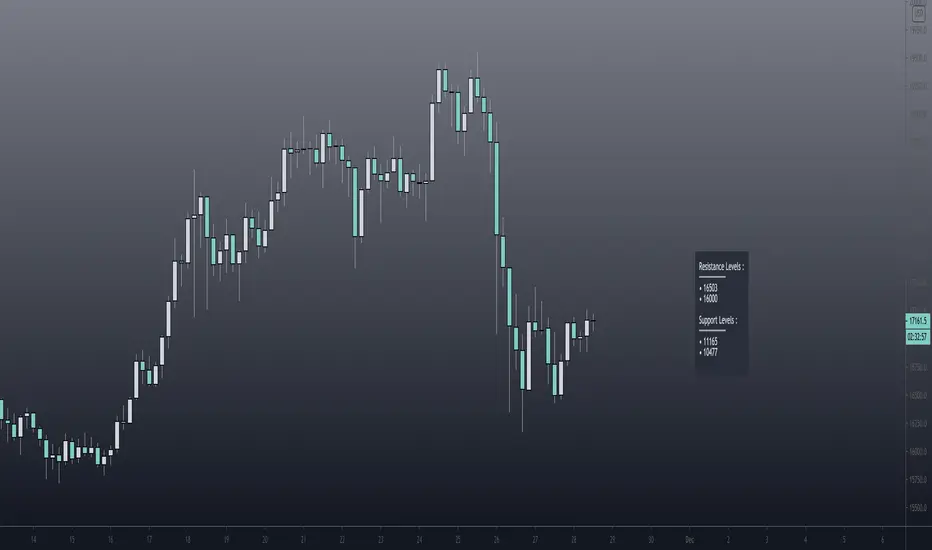
Pivot Support / Resistance Panel [JV]Hello Traders,
First all of thanks to LonesomeTheBlue for making me grasp arrays, a wonderful addition to Pine Script.
This indicator uses arrays to find Pivot Points and mark them as Support / Resistance.
It displays an info panel with the latest values.
This code was written using the following standards:
• PineCoders Coding Conventions for Pine: www.pinecoders.com
Configurable options:
Up to 6 Support / Resistance Levels.
Pivot Lookback Period.
Panel Color.
Text Color.
Panel Offset.
Panel Size.
Enjoy!
GBTC Fomo Panic PremiumIt is rumored that GBTC price action leads the Bitcoin market. This indicator compares GBTC fomo/panic levels to the (Binance) BTC spot market. Fomo is measured as large percentage moves of the high price from the min over a look-back period. Panic is measured as large percentage moves of the low price from the max over a look-back period. A prime example of this indicator's usage would be as a sell signal confirmation during the 2020 pre-Thanksgiving panic exhibited on the 1-hour chart while the 20 EMA was still above the 99 SMA.
You can customize the leading and lagging markets and the length of the lookback period. I would love to hear what parameters, markets and timeframes work for you. Maybe there is a way to leave comments, or hit me up on Twitter: @thirdreplicator
May you profit and enjoy.

Pivot Points (Daily, Weekly, Monthly)Pivot point: P = (High + Low)/2
First support: S1 = Low
Second support, S2 = Low - 2 * (High - Low)
First resistance: R1 = High
Second resistance, R2 = High + 2 * (High - Low)
White Line: Pivot Point
Gleen Line(Thin Line): Support 1
Green Line(Thick Line): Support 2
Red Line(Thin Line): Resistance 1
Red Line (Thick Line): Resistance 2
You can adjust it to daily, weekly or monthly indicators, daily for intraday trading (1minute, 1hour etc.), weekly and monthly for day/swing trading, monthly for weekly trades. I plot the graph with steplines since I think they can show the differences of pivots from time to time more clearly, you are free to change to other plot styles like circles or regular lines if you want to. Please like this script, and let me know any questions, thanks.

[JRL] MM FibonacciThis is a new indicator that uses Murrey Math formulas to find the tops and bottoms, then uses those tops and bottoms to draw long-term fibonacci retracement levels. The genius of Murrey was his geometric formulas to calculate the right place to start plotting the lines, but I think the fibonacci ratios typically seem more accurate than the MM line ratios. So in this script I attempt to take the best of each and combine them into a new, superior indicator.
Let me know in the comments if you find this useful. Cheers!
