LuxAlgo® - Price Action Concepts™Price Action Concepts™ is a first of it's kind all-in-one indicator toolkit which includes various features specifically based on pure price action.
Order Blocks w/ volume data, real-time market structure (BOS, CHoCH, EQH/L) w/ 'CHoCH+' being a more confirmed reversal signal, a MTF dashboard, Trend Line Liquidity Zones (real-time), Chart Pattern Liquidity Zones, Liquidity Grabs, and much more detailed customization to get an edge trading price action automatically.
Many traders argue that trading price action is better than using technical indicators due to lag, complexity, and noisy charts. Popular ideas within the trading space that cater towards price action trading include "trading like the banks" or "Smart Money Concepts trading" (SMC), most prominently known within the forex community.
What differentiates price action trading from others forms of technical analysis is that it's main focus is on raw price data opposed to creating values or plots derived from price history.
Mostly all of the features within this script are generated purely from price action, more specifically; swing highs, swing lows, and market structure... which allows users to automate their analysis of price action for any market / timeframe.
🔶 FEATURES
This script includes many features based on Price Action; these are highlighted below:
Market structure (BOS, CHoCH, CHoCH+, EQH/L) (Internal & Swing) multi-timeframe
Volumetric Order Blocks & mitigation methods (bullish & bearish)
Liquidity Concepts
Trend Line Liquidity Zones
Chart Pattern Liquidity
Liquidity Grabs Feature
Imbalance Concepts MTF w/ multiple mitigation methods
Fair Value Gaps
Balanced Price Range
Activity Asymmetry
Strong/Weak Highs & Lows w/ volume percentages
Premium & Discount Zones included
Candle Coloring based on market structure
Previous Highs/Lows (Daily, Monday's, Weekly, Monthly, Quarterly)
Multi-Timeframe Dashboard (15m, 1h, 4h, 1d)
Built-in alert conditions & Any Alert() Function Call Conditions
Advanced Alerts Creator to create step-by-step alerts with various conditions
+ more (see changelog below for current features)
🔶 BASIC DEMONSTRATION
In the image above we can see a demonstration of the market structure labeling within this indicator. The automatic BOS & CHoCH labels on top of dashed lines give clear indications of breakouts & reversals within the internal market structure (short term price action). The "CHoCH+" label is also demonstrated as it triggers only if price has already made a new higher low, or lower high.
We can also see a solid line with a larger BOS label in the middle of the chart. This label demonstrates a break of structure taking into account the swing market structure (longer term price action). All of these labels are generated in real-time.
🔶 USAGE & EXAMPLES
In the image below we can see how a trade setup could be created using Order Blocks w/ volume metrics to find points of interest in the market, swing / internal market structure to get indications of longer & shorter term reversals, and trend line liquidity zones to find more likely impulses & breakouts within trends.
We can see in the next image below that price came down to the highest volume order block marked out previously as our point of interest for an entry used in confluence with the overall market structure being bullish (swing CHoCH). Due to price closing below the middle Order Block at (24.77%), we saw it was mitigated, and then price revisited liquidity above the Trend Line zone above, leading us to the first Order Block as a target.
You will notice the % values adjust as Order Blocks are touched & mitigated, aligning with the correct volume detected when the Order Block was established.
In the image below we can see more features from within Price Action Concepts™ indicator, including Chart Pattern Liquidity, Fair Value Gaps (one of many Imbalance Concepts), Liquidity Grabs, as well as the primary market structures & OBs.
By using multiple features as such, users can develop a greater interpretation of where liquidity rests in the market, which allows them to develop trading plans a lot easier. Liquidity Grabs are highlighted as blue/red boxes on the wicks during specific price action that indicates the market has made an impulse specifically to take out resting buy or sell side orders.
We can notice in the trade demonstrated below (hindsight example) how price often moves to the areas of the most liquidity, even if unexpected according to classical technical analysis performed by retail traders such as chart patterns. Wicks to take out orders above & potentially trap traders are much more noticeable with features such as these.
The Chart Patterns which can be detected include:
Ascending/Descending Wedges (Asc/Desc Wedge)
Ascending/Descending Broadening Wedges (Asc/Desc BW)
Ascending/Descending/Symmetrical Triangles (Asc/Desc/Sym Triangle)
Double Tops/Bottoms (Double Top/Double BTM)
Head & Shoulders (H&S)
Inverted Head & Shoulders (IH&S)
General support & resistance during undetected patterns
In the image below we can see more features from within the indicator, including Balanced Price Range (another imbalance method similar to FVG), Market Structure Candle Coloring, Accumulation & Distribution zones, Premium & Discount zones w/ a percentage on each zone, the MTF dashboard, as well as the Previous Daily Highs & Lows (one of many highs/lows) displayed on the chart automatically.
The colored candles use more specific market structure analysis, specifically allowing users to visualize when trends are considered "normal" or "strong". By utilizing other features alongside this market structure analysis, such as noticing price retesting the PDL level + the Equilibrium as resistance, a Balanced Price Range below price, the discount with a high 72% metric, and the MTF dashboard displaying an overall bearish structure...
...users can instantly gain a deeper interpretation of price action, make highly confluent trading plans while avoiding classical technical indicators, and use traditional retail trading concepts such as chart patterns / trend lines to their advantage in finding logical areas of liquidity & points of interest in the market.
The image below shows the previous chart zoomed in with 2 liquidity concepts re-enabled & used alongside a new range targeting the same Discount zone.
🔶 SETTINGS
Market Structure Internal: Allows the user to select which internal structures to display (BOS, CHoCH, or None).
Market Structure Swing: Allows the user to select which swing structures to display (BOS, CHoCH, or None).
MTF Scanner: See market structure on various timeframes & how many labels are active consecutively.
Equal Highs & Lows: Displays EQH / EQL labels on chart for detecting equal highs & lows.
Color Candles: Plots candles based on the internal & swing structures from within the indicator on the chart.
Order Blocks Internal: Enables Internal Order Blocks & allows the user to select how many most recent Internal Order Blocks appear on the chart as well as select a color.
Order Blocks Swing: Enables Swing Order Blocks & allows the user to select how many most recent Swing Order Blocks appear on the chart as well as select a color.
Mitigation Method: Allows the user to select how the script mitigates an Order Block (close, wick, or average).
Internal Buy/Sell Activity: Allows the user to display buy/sell activity within Order Blocks & decide their color.
Show Metrics: Allows the user to display volume % metrics within the Order Blocks.
Trend Line Liquidity Zones: Allows the user to display Trend Line Zones on the chart, select the number of Trend Lines visible, & their colors.
Chart Pattern Liquidity: Allows the user to display Chart Patterns on the chart, select the significance of the pattern detection, & their colors.
Liquidity Grabs: Allows the user to display Liquidity Grabs on the chart.
Imbalance Concepts: Allows the user to select the type of imbalances to display on the chart as well as the styling, mitigation method, & timeframe.
Auto FVG Threshold: Filter out non-significant fair value gaps.
Premium/ Discount Zones: Allows the user to display Premium, Discount , and Equilibrium zones on the chart
Accumulation / Distribution: Allows the user to display accumulation & distribution consolidation zones with an optional Consolidation Zig-Zag setting included.
Highs/Lows MTF: Displays previous highs & lows as levels on the chart for the previous Day, Monday, Week, Month, or quarter (3M).
General Styling: Provides styling options for market structure labels, market structure theme, and dashboard customization.
Any Alert() Function Call Conditions: Allows the user to select multiple conditions to use within 1 alert.
🔶 CONCLUSION
Price action trading is a widely respected method for its simplicity & realistic approach to understanding the market itself. Price Action Concepts™ is an extremely comprehensive product that opens the possibilities for any trader to automatically display useful metrics for trading price action with enhanced details in each. While this script is useful, it's critical to understand that past performance is not necessarily indicative of future results and there are many more factors that go into being a profitable trader.
🔶 HOW TO GET ACCESS
You can see the Author's instructions below to get instant access to this indicator & our premium suite.
Priceaction

CSRS v2Candlesticked RSI v2 for price action traders!
See the True Momentum.
6 chart type, smooth RSI , add signal lines, find divergences, special alerts
This is 2nd version with major upgrade
Improved and more powerful
fully customizable.
features:
See RSI in 6 type of chart(Candles, Hollow Candles, Siwi Candles, Heikin Ashi, HL Bar, Line)
Monitor Up to 3 RSI , each one at desired resolution, source and length
Smooth each one of chart separately to remove noises
Add up to 3 signal line to primary chart in your desired source and type( SMA , EMA , WMA , HMA )
Find divergences which has special parameters
Gradient color adjustment of line chart
Add alert for reaching to important levels and detected divergences

TheStratHelper Scanner
1= Inside Candle
2= Goes past the previous candle's price up or down
3= Goes past the previous candle's price on both sides
Ability to change the timeframe and the symbols this indicator is scanning through in the input tab under settings of this indicator. Maximum symbols 40. By default some symbols are entered in the indicator already. They cannot be left empty. If left empty, an error comes up and the script doesn't load.
Can look through many timeframes like monthly, weekly, daily by changing the timeframe in the input tab under settings. Default timeframe is set to 1 Day.
First label is for all of the symbols the indicator is scanning.
Second label is the result of the scan.
Scanning for
2 Up, 2 Down, 3-1, 2-1, 1-2, 2-2, Failed 2 going 3, Inside and Outside bars
Please DM me to get access to this indicator.

[blackcat] L1 Stochastic J Price Action OscillatorLevel: 1
Background
The KDJ oscillator display consists of 3 lines (K, D and J - hence the name of the display) and 2 levels. K and D are the same lines you see when using the stochastic oscillator. The J line in turn represents the deviation of the D value from the K value. The convergence of these lines indicates new trading opportunities. Just like the Stochastic Oscillator, oversold and overbought levels correspond to the times when the trend is likely to reverse.
Function
L1 Stochastic J Price Action Oscillator with Long Strength Indicator use stochastic KDJ signal as input source and it combines with price action algorithm to form a brand-new oscillator which have less noise signal with a long signal strength indicator so as to alleviate inherent KDJ saturation issue.
Key Signal
cond --> buy signal condition from KDJ j value deduction
fastline --> fast line of new oscillator
slowline --> slow line of new oscillator
Pros and Cons
Pros:
1. it takes over KDJ's advantages
2. it can greatly reduce KDJ saturation issue
Cons:
1. no short entry signal is derived.
2. only long signal strength indicator is disclosed
Remarks
An improved version of KDJ with less satration observed.
Readme
In real life, I am a prolific inventor. I have successfully applied for more than 60 international and regional patents in the past 12 years. But in the past two years or so, I have tried to transfer my creativity to the development of trading strategies. Tradingview is the ideal platform for me. I am selecting and contributing some of the hundreds of scripts to publish in Tradingview community. Welcome everyone to interact with me to discuss these interesting pine scripts.
The scripts posted are categorized into 5 levels according to my efforts or manhours put into these works.
Level 1 : interesting script snippets or distinctive improvement from classic indicators or strategy. Level 1 scripts can usually appear in more complex indicators as a function module or element.
Level 2 : composite indicator/strategy. By selecting or combining several independent or dependent functions or sub indicators in proper way, the composite script exhibits a resonance phenomenon which can filter out noise or fake trading signal to enhance trading confidence level.
Level 3 : comprehensive indicator/strategy. They are simple trading systems based on my strategies. They are commonly containing several or all of entry signal, close signal, stop loss, take profit, re-entry, risk management, and position sizing techniques. Even some interesting fundamental and mass psychological aspects are incorporated.
Level 4 : script snippets or functions that do not disclose source code. Interesting element that can reveal market laws and work as raw material for indicators and strategies. If you find Level 1~2 scripts are helpful, Level 4 is a private version that took me far more efforts to develop.
Level 5 : indicator/strategy that do not disclose source code. private version of Level 3 script with my accumulated script processing skills or a large number of custom functions. I had a private function library built in past two years. Level 5 scripts use many of them to achieve private trading strategy.

DePriExchange weighted price for cryptocurrencies
DECENTRALIZED PRICE CHART FOR DECENTRALIZED WORLD
See non-manipulated , globally price action that comes from whole liquidity!
The main idea behind this script is that...
The value of each trading pair finally determined globally and the price displayed in exchanges is its own and not global! differences between exchanges, reduced to near zero gradually by market makers and arbitrages, so..
Every min tick price changes Must be backed by liquidity to be part of the global fluctuations
more liquidity gives it more credibility
more credibility give it more weight
..Against opposing movements.
This script can collect price of crypto pairs from 12 exchanges that listed on TV and have effective volume.
In the first step, summarizes the volume of all exchanges and creates the total volume
In the next step, divide each exchange volume to total volume to obtain relative weight of each exchange.
In the final step, multiply each exchange price to weight of itself and summarizes these numbers .. now, we have Exchange weighted price!
The results on high liquidity pairs like BTCUSDT, ETHUSDT, is not much differ then simple chart but when you apply it on lower liquidity, lower time frames of altcoins, you realize its benefits and usefulness. Altcoins chart in composite and simple mode is very differ, I hope you enjoy from TRUE CHART.
With this, also you can..
Filter and smooth candlestick chart with SMA or EMA
Plot a line chart of pair at your desired frame separate from the main chart for monitor important price levels
Get realtime report of whole volume of pair on included exchanges
Get realtime report of each exchange weight and share
Note.1:
some of pairs queted on more than one like BTCUSD, BTCUSDT, BTCUSDC and etc. In this pairs we choose the one that usually has more volume on that exchange.
Note.2:
At this time, supported queted currencies are BTC, ETH, USD, USDT, BUSD, USDC, USDK.
Note.3:
This script is relatively heavy! This is not cuz of bad coding.
Each bar compution contains at least one plot and some of security calls, so 10 to 15 seconds is normal load time.
Note.4:
You can combine this with your price action base scripts and use balanced OHLCV. The necessary explanations about this are available in the code.
Note.5:
You must only include exchanges that support your ticker, Otherwise you will receive an error.
I hope it comes useful to you.

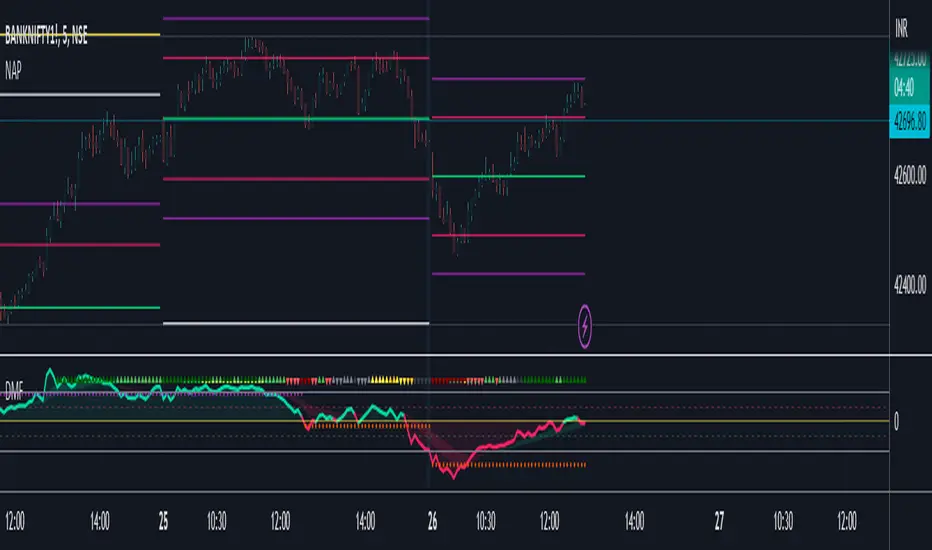
BANKNIFTY - PRICE ACTION TRADING SYSTEM (BackTestable + Alerts)This study is based on several Price Action parameters of :-
• Candle Pattern,
• Supply Demands,
• Support and Resistance ,
• Breakouts.
► How To Use This Study ?
• Suitable Trade Session for this study 10:15 AM to 02:30 PM ( UTC +05:30)
• Buy Whenever a Up Arrow Appears on Chart with text "TYPE: LE".
• Sell Whenever a Down Arrow Appears on Chart with text "TYPE: SE".
• Exit Buy Whenever a Down Arrow Appears with text "TYPE: LX" After A Buy call and Exit Sell Whenever a up Arrow Appears with text "TYPE: SX" After A Sell Call.
• Take Only 1 trade Per Trading Session.
Backtest Values Used:-
Initial Capital : 1000000
Order Size (Lots) : 1 (Contract) Lots
Pyramiding : 0 orders
Commission : 0.001%
Test Yourself and give feedback.
PM us to obtain access.

Angle & Price FlowThis is a simple end of the day indicator based on open and close values.
Angles:
Identifying narrow angles helps to find breakouts
Maximum angle = High chance of reversal
Minimum angle = Chance of breakouts on the next day or upcoming days.
Price Flow:
I personally use price flow to simplify the flow of candlestick chart and to identify breakouts using rounding bottoms and rounding top patterns, sharp corners for reversals.
Features:
Multi time frame
Labels
Hide previous period
Combine it with other indicators for better result.
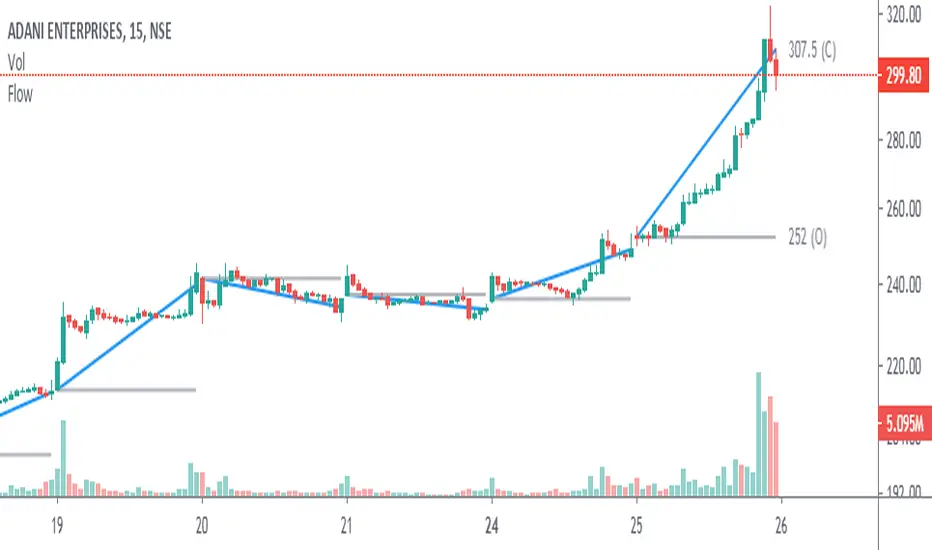

RANGE IDENTIFIER [ASHUTOSH]This script is for intraday purpose and mainly for index traders. It works well on 3/5 min time frame. Script provides VIP( very important pivot) level and one support and resistance. It's ideal for price action traders trading breakouts and mean reversion. It is built on true range. It can be customized as per the traders requirement. True range is on daily time period. Divisor will decide the broadness of the range. Bigger the divisor narrower the range.

Price breaksThis indicator displays the High/Low/Close of the previous day/week/month as horizontal lines. Of course, everything is configurable but to keep it simple and non-intrusive it only displays:
month's H/L/C levels on D time frame (drawn as circles)
week's levels on 4h (as crosses)
day's levels on 1h (as line)
These levels act as support / resistance over and over again, see current (08/24/2020) BTCUSD chart, the previous month's close (blue circles) did act as support and held on 08/11, also prev month's high (red circles) was not broken on 08/21. Once these levels break we might see lower prices but so far both of them act as good support to consider.

APW Price ActionThis script uses floor pivots and a VIP level which is very important level from Price action point of view. These levels act as strong support and resistance levels. I Mainly use this for Banknifty:NSE but these can be used across any instrument which is can be traded. This script will be upgraded further with more price action concepts.

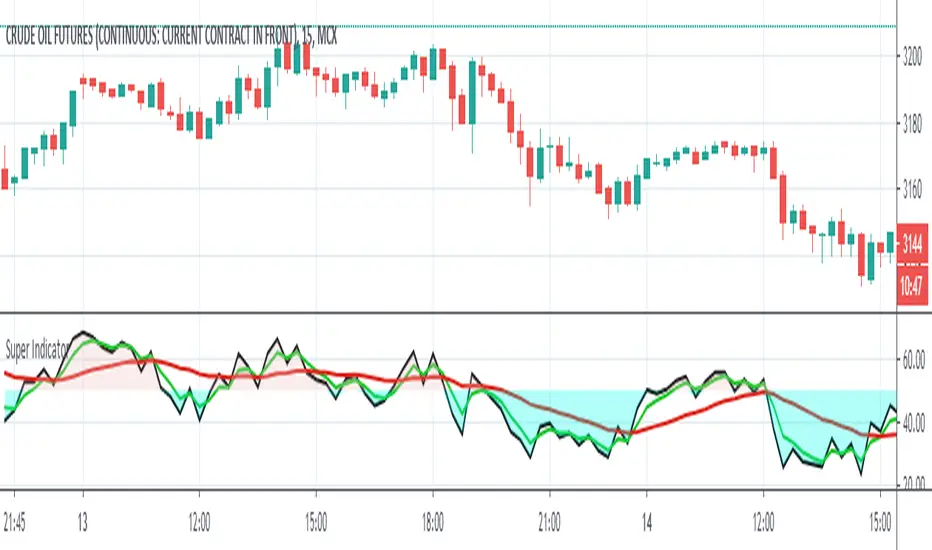
Super Indicator ver 1.0This indicator determines the strength of the price movement by taking into consideration Relative Strength, Exponential Moving Average & Moving Average with customized settings
Time Frame:- Can be used on any time frame
BUY:- A buy call is generated when the Moving Average line cross below the RSI & EMA line
SELL:- A sell call is generated when the Moving Average line cross above the RSI & EMA line.
The further the MA line is from RSI & EMA line, the more is the strength of the signal.
New Age PivotsHere I'm proposing possibly the simplest and most relevant pivot style for intraday traders like me.
It utilizes fundamentals of the average range and devises S/R around that. Pivot point in this is today's open (colored lime), which is far more relevant than yesterday's/past data based pivots.
This is an attempt to reduce the influence of historical data as much as possible, as traders grow in their experience and skill, this becomes the newest and most successful methodology to stay profitable over the long run. Just my pov.
This is purely for educational purposes, no past performance be it visual or mathematical is a guarantee of success in the future. Use it at your own discretion.
The author takes no responsibility of your individual profit or loss. Also, the script will be checked protected for protection against theft, however, you can use it by adding to your favorites.
I've added the ability to hide and view historical S/R as well, it looks best when your chart is clutter-free.
Enjoy~
Two Fractals TrendlinesThis study draws a trend line for the last two Bill Williams up-fractals and down-fractals.
Trend line break signals and alerts can optionally be added.

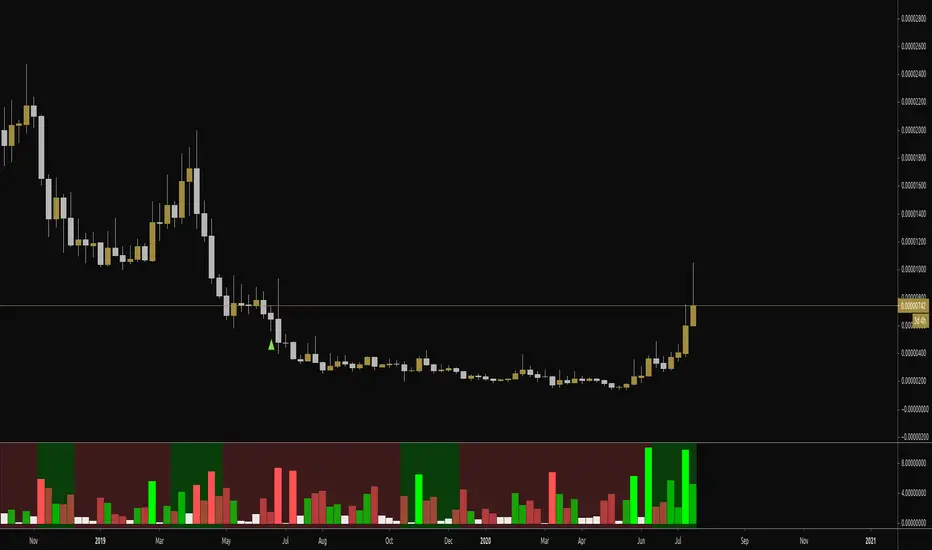
1337PAThis script looks at % moves and uses z-scoring to highlight bars that are statistically significant in either direction.
The output columns values represent % moves within a trading period on an asset. The colors are explained below:
Lime - Significant
Bright red - Significant
Transparent lime - normal
Transparent red - normal
White - low %
It then uses a lookback function for a user-defined window and calculates the average % move on bullish bars and bearish bars.
When the average % move in the bullish direction over the lookback window becomes greater than the average % move in the bearish direction over the lookback window, it will highlight the background either green or red, signifying a trend in price.
It's a fantastic indicator to use in conjunction with
, which does similar things but for volume .
You can spot disparities in volume / price action and use that to inform trading decisions... for instance, a statistically significant volume day but a low significant PA day could provide some insight into the market.
You can also use the background (trend direction) in conjunction with the obv printout on 1337-Volume as multiple points of confirmation for trade decisions... i.e., volume and price action trend logic points to bearish or bullish outcome... or maybe price action is leaning bullish but volume suggests otherwise...
Enjoy!
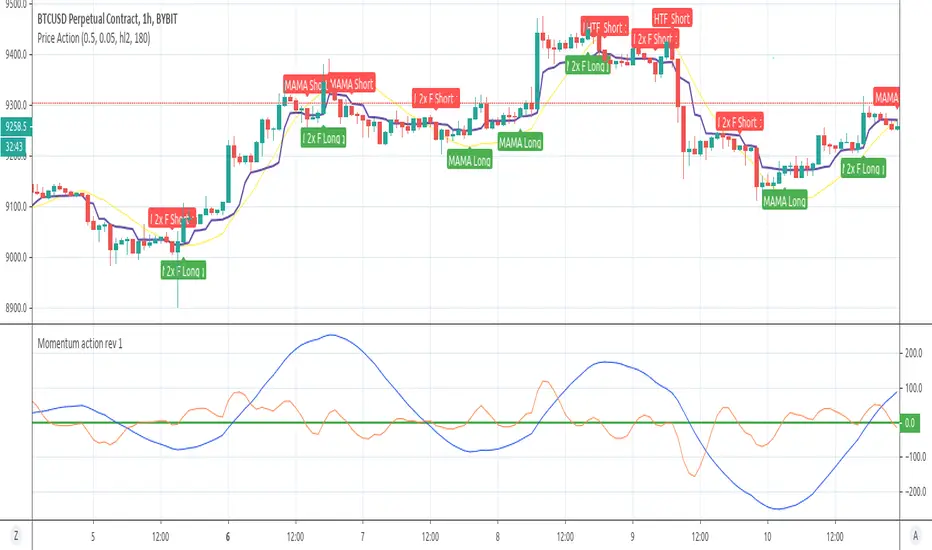
Advance strategy for trading and scalping for Crypto / Forex Hello traders ,
here i am introducing my strategy with updated features.
It provide signals for entering in the market and signal for exit.
Signal for opening short / sale position is when Price drop bellow the yellow line of the Indicator ( Price action ) and same time the red line of the Indicator Momentum Action is dropping .
Additional confirmation is if the price goes bellow MAMA line as well ( Violet colour on the chart )
For open buy/long position we need to see break over the Price action indicator ( Yellow line ) and same time the red line of Momentum indicator must goes over 0 level of the bottom chart.
The rule currently use 2 bars difference from break of price indicator or break of momentum level 0 , so the indicator will show long/short if the break of both points is within 2 bars .
I can suggest entering on H1 or H3/H4 time frames as on lower frames more noise .
I have added few more filters for more clear signals and higher win rate .
Added are MAMA ( The Mesa Adapter Moving Average by John Ehlers ) and FAMA ( Following Adaptive Moving Average )
Additional filter for monitoring Higher Time Frame Time frame position of the Momentum indicator .
For Example if we are watching basically at H1 time frame we can set HTF Filter Period to monitor 4 hours time frame and once we have same direction signals we will have confirmation . ( Moving Action indicator is same way in H1 and H4 ) .
Alerts can be set once signal appear you can be notified accordingly so you dont miss any trades
As before strongly suggest using Momentum Action Indicator on the chart .
Free trial period 15 days is available for all users who want to try the strategy , please contact me via personal message if you want to receive a trial period or for more information.
Thank you.
00,25,50,75,00 - RND/LVL00,25,50,75,00 - RND/LVL
This concept is very simple..
Use round numbers as support and resistance, target the (.25 - .50 - .75) levels for take profit..
Basically, the rounds numbers are high liquidity zone (psychological and banks levels)
You can clearly see the price moving between those zones.
Recommanded timeframe : M30-H1-H4 (M15-M30) for entry..
I usually look at rejection at those levels for short or buy depend of the context.
You can place SL on the next .25 pips over the hard round numbers resistance-support.
Good Luck and if you have any comments, write bellow.
Thanks!
Here some example :

Magic SRThis indicator can give you idea about where is the potential supply and demand zone exist. This can be used to find the daily, weekly and monthly supply and demand zone.
Contact me for more information.
Magic ReversalThis indicator can point out you monthly potential reversal range. This can be used for people who hold the trade more than couple of days to understand their Risk / Reward ratio. Even this can be used of people who does BTST or STBT trades as well.
Contact me for more information
Magic BandThis indicator can help you to understand the current trend and help you to take an entry, If your analysis looks good to go for long entry, check that where is your candle based on this indicator,If the candle is above the indicator it is goo to go for long and if it is bellow the indicator it is good to go for short.
More than that the candle is closing strong above the indicator after crossing the indicator , then it is a good sign to take a long position. Similarly if the candle close strongly bellow the indicator after crossing the indicator then it is good to go for short position.
Use the indicator with other indicators or your analysis.
Please contact me for more details.

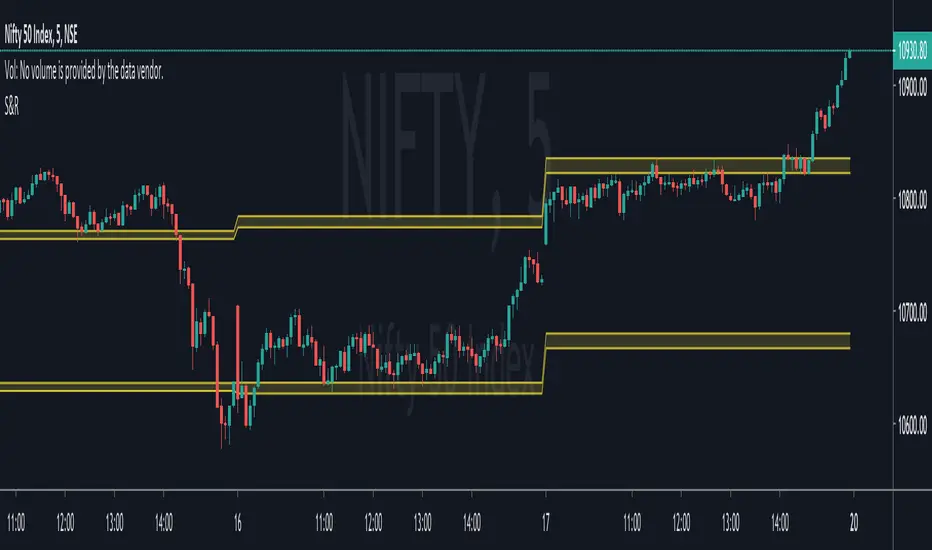
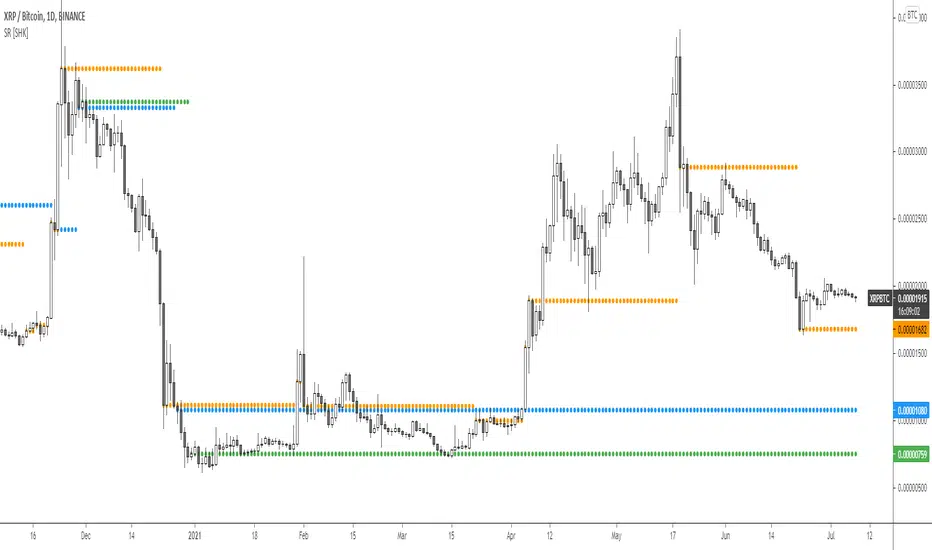
Support and Resistance MTF levels [SHK]A new way of drawing multi timeframe support and resistance !
This tool doesn't get the last high and lows, otherwise it tries to detect highly liquid levels with pending orders .
Share your opinion and result.
Enjoy!
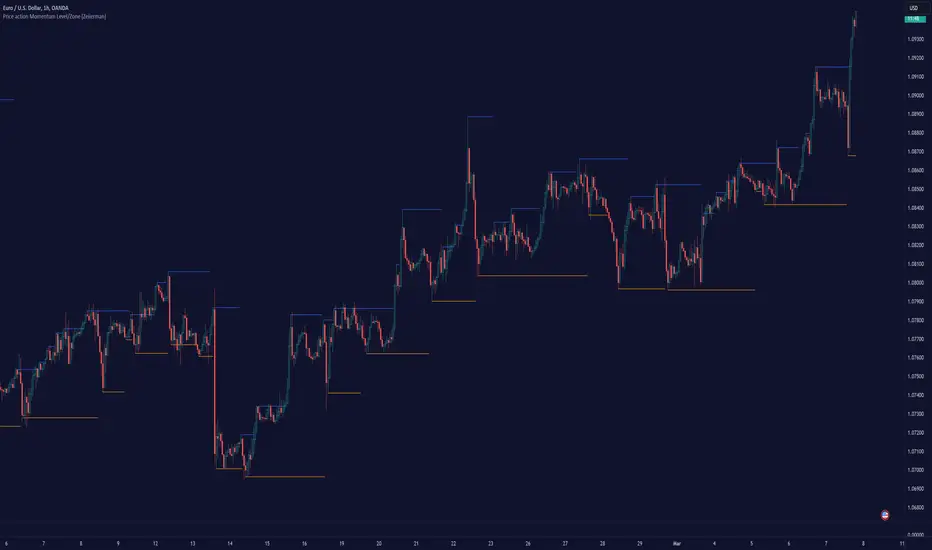
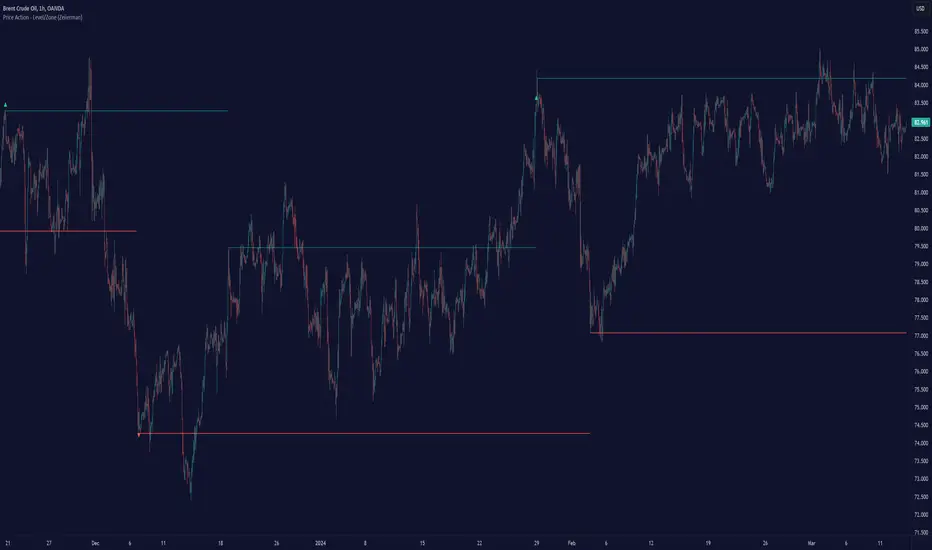
Price Action - Level/Zone (Expo)Price Action - Level/Zone (Expo) indicator identifies buying and selling pressure that has an impact on the price movement. This is visualized by a Zone, or Levels or with Barcolors depending on which settings are used.
Depending on the selected settings the indicator can identify buying and selling pressure which pushes the price further in the trend direction and it can show exhausted buyers/sellers which is seen in reversal points.
HOW TO USE
1. Use the indicator to identify buying and selling pressure.
2. Use the indicator to identify exhausted buyers and sellers.
3. Use the indicator to identify reversal points, pullbacks, or trend shifts.
4. Use the indicator to buy/short-sell breakouts of the zones.
5. Use the indicator to buy/short-sell when the price re-test the zones.
-> Try the indicator on Heikin Ashi Candles , but it works as good at any type of candlestick, bars, Renko, or line break.
INDICATOR IN ACTION
4 hour chart
4 hour chart
I hope you find this indicator useful , and please comment or contact me if you like the script or have any questions/suggestions for future improvements. Thanks!
I will continually work on this indicator, so please share your experience and feedback as it will enable me to make even better improvements. Thanks to everyone that has already contacted me regarding my scripts. Your feedback is valuable for future developments!
ACCESS THE INDICATOR
• Contact me on TradingView or use the links below
-----------------
Disclaimer
Copyright by Zeiierman.
The information contained in my scripts/indicators/ideas does not constitute financial advice or a solicitation to buy or sell any securities of any type. I will not accept liability for any loss or damage, including without limitation any loss of profit, which may arise directly or indirectly from the use of or reliance on such information.
All investments involve risk, and the past performance of a security, industry, sector, market, financial product, trading strategy, or individual’s trading does not guarantee future results or returns. Investors are fully responsible for any investment decisions they make. Such decisions should be based solely on an evaluation of their financial circumstances, investment objectives, risk tolerance, and liquidity needs.
My scripts/indicators/ideas are only for educational purposes!
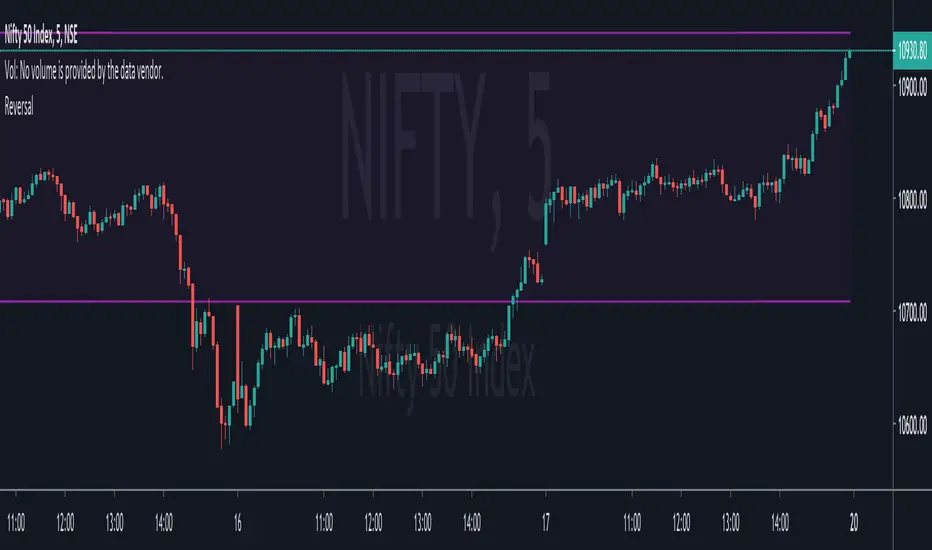
Price action Momentum Level/Zone (Expo) Price action Momentum Levels/Zones (Expo) indicator identifies relatively stronger Up and Down Momentum. This is visualized by a Zone, or Levels or with Barcolors depending on which settings are used.
When the market has relatively stronger momentum it can be a sign that the sellers or buyers are exhausted and the market has to pause, make a pullback, or make a trend shift.
HOW TO USE
1. Use the indicator to identify relatively stronger momentum.
2. Use the indicator to identify pullbacks or trend shifts.
3. Use the indicator to buy/short-sell breakouts of the zones.
4. Use the indicator to buy/short-sell when the price re-test the zones.
INDICATOR IN ACTION
4 hour chart
I hope you find this indicator useful , and please comment or contact me if you like the script or have any questions/suggestions for future improvements. Thanks!
I will continually work on this indicator, so please share your experience and feedback as it will enable me to make even better improvements. Thanks to everyone that has already contacted me regarding my scripts. Your feedback is valuable for future developments!
ACCESS THE INDICATOR
• Contact me on TradingView or use the links below
-----------------
Disclaimer
Copyright by Zeiierman.
The information contained in my scripts/indicators/ideas does not constitute financial advice or a solicitation to buy or sell any securities of any type. I will not accept liability for any loss or damage, including without limitation any loss of profit, which may arise directly or indirectly from the use of or reliance on such information.
All investments involve risk, and the past performance of a security, industry, sector, market, financial product, trading strategy, or individual’s trading does not guarantee future results or returns. Investors are fully responsible for any investment decisions they make. Such decisions should be based solely on an evaluation of their financial circumstances, investment objectives, risk tolerance, and liquidity needs.
My scripts/indicators/ideas are only for educational purposes!