VamsiPriceAction_101Identifies entry for buy/sell position as per previous day high and low.
Marks a target and stop loss as per the ATR14.
Confirmation of Buy/Sell signal is when we have a 5 min candle with 60:40 body:wick ratio
Use it on a 5 minute time frame to identify a price action based breakout
It also marks when 50 ema crosses 200 ema, and vice-versa
Priceaction

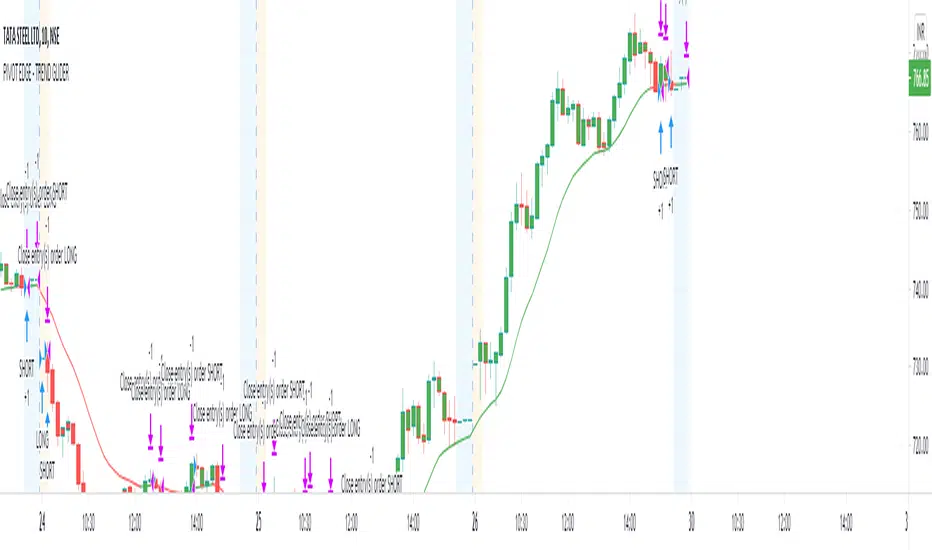
PIVOT EDGE - TREND GLIDEROne of the Biggest challenge in trading is to find the right trend and once we are in the right trend, holding on to winning trades is the next challenge. So this indicator addresses both these issues and helps you with
finding the right trend and also guide you and glide the trades till there is a change in trend by means of proper trend based candle color.
You can just look at the basic candle color as per the prevailing trend and be in the trend as long as the candle colors doesn't change. You need not worry or panic about the small pullbacks or retracements which is a normal
course of any trend continuation. Without this Indicator, in normal situation we would have ended our trades thinking the trend has changed and only to find that trend is again continuing and giving us more than 3-4 times reward after exit.
This Indicator is coded in such a way that no matter what may be the standard color of the candle, This Indicator will paint the candles to Green color in an Uptrend and it will paint the candles RED color in downtrend.
You can take entries as soon as you see the trend formation and wait till the trend is changed or the candle color is changed.
This indicator is intended for the use of newbies or Novice traders to give them confidence and also to guide them towards the proper trend so that they are not taking any counter trend trades.
This Indicator is also beneficial for experienced and master traders to keep them in trade and glide until there is a clear change in trend thereby riding their profits for longer time.
This is a Moving average crossover based strategy but slightly different in the computation where in I have used the customized PEMA values to suit most favorable win ratio.
The results are best when used for timeframe of 10 mins and above. Also you must know the basics of candle stick patterns and price action to take suitable entries and exit at favorable risk reward ratio.
Always do not wait for exit signal from the indicator. You can exit whenever you have gained decent profit and you can keep a trailing stop loss and lock in your profit.
This Indicator works on all Markets and all types of timeframes. Kindly do backtesting for atleast 2-3 months data before using it for live market. Also you must find out which stocks you wish to trade and check if this indicator works favorably for your scripts. The results might slightly vary on stocks
with high volatility.
Always look for the curve in trending up direction of trending down direction. Do not trade whenever the curve is flat and not inclined upside or downside.
Always trade with a suitable STOPLOSS in place and trade with less quantity till you find comfort and confidence with this Indicator.
Further updates to follow periodically. Incase you like this script, like it and share it to others too. Also take a look at the other scripts that I have published.
Happy Trading
Mohan
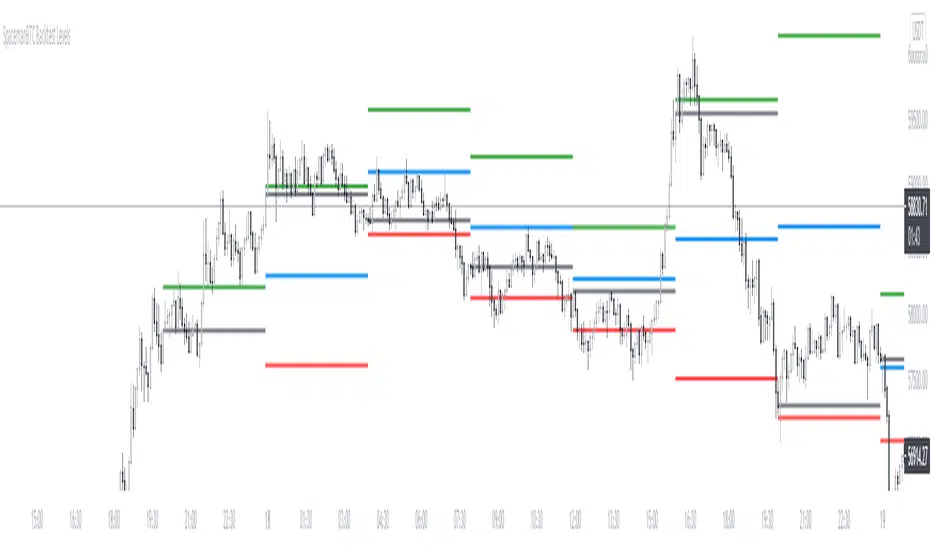
Key Levels CustomTF + Backtest: SpacemanBTCKey Levels Backtest, same logic as the key levels script, provide levels based:
High, Low, Mid and Close.
This was requested, took a long time to post as I fell sick and was given a lot of Dev Work.
Hope this helps those who use it, very useful to see liquidity grabs in my opinion.
Input time in minutes!
Result of a user request.
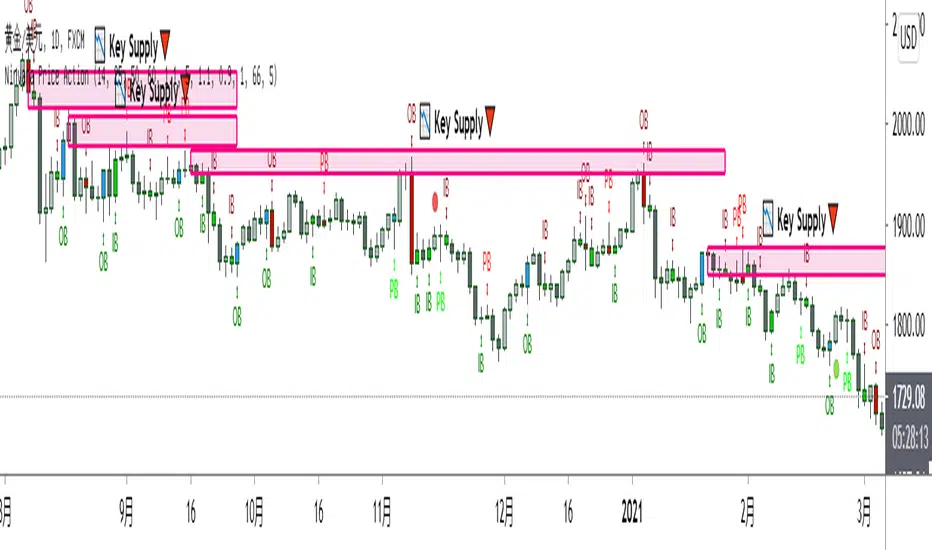
Nirvana Price ActionYou can set it according to your own needs
The required display can be opened ☑
Do not need to display can be closed ❌
I chose to turn them on by default: inside bars ☑ pin bars ☑ price action bar names ☑ price action bars ☑
Colors can be customized
I wish you a smooth transaction!
Price-Action-BarsThis script came as a discussion in our community forum.
It paints
1. Pin Bars (Bottom or Top)
2. inside/outside Bar
3. Bullish Bottom bar
It also has the ability to add alerts on your favorite stocks

NYCOB Kill Zone StrategyI have now turned the NYCOB Kill zone into a stand alone strategy!
Fully customizable in regards to time of entry and levels of entry but the standard settings are the best all around.
Original NYCOB Kill Zone text below
This script plots the H and L of the first 2 hours of the NYC session and shades the space between in which i deem the NYC Order Block
It also maps out the First two hours on the chart as well so you can understand when the OB has formed
Over the past 3 years of trading cryptocurrency i have noticed a phenomena that has occurred nearly every day
The H or L will 90% of the time will be posted in the first two hours of this session
knowing this means you understand if you just wait til this time you can better your odds at not getting stop hunted due to poor entry
A few things to take from this study are these.
1. after the OB is formed
2. whichever side gets taken out first (H/L) will 90% define the bias for the day. I have found that using the m13-m15 TF will add some more confirmation with 1-2 closes outside of range H/L/
3. After general bias has formed 2 things can happen
A) PA just takes off and there is really nothing you can do about it unless you had other studies that told you that will happen
B) PA will dip back INTO the OB and create the OTE which is any retracement below the .5 Fibonacci of the shaded OB
4. Typically OTE happens after the session has ended
5. If you used OTE off of the past days NYCOB then you can use the new (forming or just formed) NYCOB to CONFIRM your initial bias presented from the previous days OTE and bias.
6. When PA cannot close outside the NYCOB it presents a range to range play where PA will visit the opposite side of the range to chase liquidity,
7. When the NYCOB is TIGHT then deviation is more likely to result in price expansion, when the NYCOB is WIDE then deviation tends to present more range to range plays.
8. After bias is formed and OTE has been made your stops should always be outside the NYCOB. I use the m30 or H1 ATR to get a slight cushion from the OB to ensure i dont get stop hunted.
Standard TP are all set at the same level but you can adjust them accordingly
Shout out to Elevate-Trading family member Boederzeng for helping me with the code!

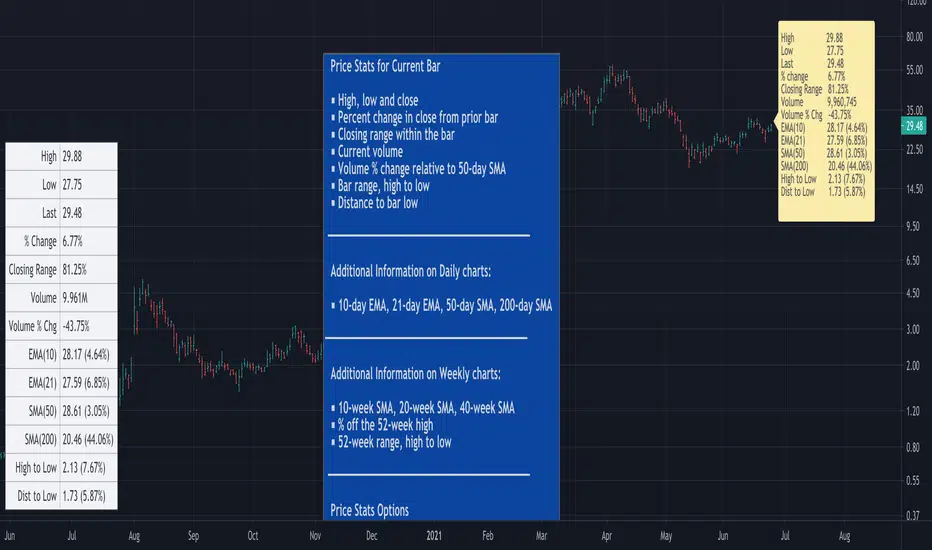
Price Stats / Price Data [LevelUp]Introduction
Price Stats is an indicator based on the statistics shown in MarketSmith charting software when viewing the Track Price information, also known as the "yellow box."
The following stats are available for the most recent price bar:
■ High price
■ Low price
■ Last price
■ Percent change in price from prior bar
■ Closing range within the bar
■ Current volume
■ Volume % change relative to the 50-day moving average volume
For daily charts:
■ 21-day EMA and % offset of price
■ 50-day SMA and % offset of price
■ 200-day SMA and % offset of price
Here's how to interpret the moving averages:
In the image below the 50-day SMA is 74.58 (8.04%). 74.58 represents the value of the 50-day SMA. 8.04% indicates that the current price is 8.04% above the SMA. A negative % would indicate the current price is the specified % below the SMA.
Ravih Pro Momentum BreakoutThis is a Momentum Breakout Strategy on “DAILY Timeframe”
This Breakout Strategy is specially created for Momentum Traders and for Bursa Market. The learning applied here are derived from past market behavioural approach. It takes into account of recent strength of price action and volume.
However, it can be applied for other Exchanges as well; as long as the stock is active with unusual volume.
The Momentum Set-Ups Script is designed for Short Term traders as in 3 to 60 Trading Days holding period or unless and until Exit Signal appears. Sometimes it could extend longer depending on the pace of the Momentum.
It also caters the aggressive traders as in Buy Today Sell Tomorrow/Today (BTST) and Fast in Fast Out (FIFO). These are traders...usually looking for 5% to 7% or 12% gain in a short span of time. However, do take note; momentum stocks are explosive in their moves. Therefore one could maximise the Gain Ride until Exit/Sell Signal appears.
The Script provides you the best High-Probability Profitable Set-Up Entry. The system identifies the stock/s in action Right Now. It is a powerful strategy for trading both Fast and Slow Momentum Stocks.
The Momentum Script is built around 3 Primary Factors namely…
1. Volume
2. Price Action
3. Time
And 2 Secondary Factors namely…
1. Volatility
2. Liquidity
Buy Exit/Sell Arrows are triggered based on last candle bar closed. It plots automatically.
For Long
Light Blue Up Triangle denotes Buy at the Closing Price. Entry Price is Closing Price or with + or – 2% tolerance for the following market day.
For Exit/Sell
Orange Down Triangle denotes Exit to close any remaining position to free up capital. Or...
Red Down Triangle denotes Exit to close any remaining position to free up capital.
Either one of the arrow is Final.
For Setting Up Alerts
The user has the option to Setup Alerts for chart signals that is…for Long and for Exit/Sell.
For Demonstrative purpose...
I have on purpose chosen an O&G counter from a Cold Sector from MYX. This is a time of Pandemic. Therefore, choosing Technology or Glove and Healthcare Sectors would definitely reflect good performance. The idea here is to demonstrate that the Momentum Strategy application works on all market conditions anytime of the year.
Remember...
This strategy is only built for stocks. It is Not for Indices neither for any other financial instruments.
No SHORT signals in this strategy.

PIVOT EDGE - The complete trading setup - LITEIntroduction to the Indicator " PIVOT EDGE - The complete trading setup - LITE "
The Foundation layout for this indicator is based on PIVOT's which are nothing but the most important levels that the price has respected in the past.The values for the pivots are derived from the key attributes of the price in any timeframe such as the OPEN, HIGH, LOW and CLOSE. These define the mood of the price and where it intends to move in relation to the previous range formed.Earlier HIGH - LOW i.e the RANGE indicates the possible movement that a stock can make in the current session and as per the calculated pivots we can possible find out the tentative supports and resistances. In addition to this indicator, It is advisable to use the price action theory which helps in taking a right decision for entries.
This indicator by itself is complete in nature, i.e it guides the user for possible entry levels and the projected targets that we can achieve and also the likely stop loss limit in case the price reverses. So beforehand even before entering into a trade position, the user can ascertain what can be his loss or max profit and then he can chose an optimum position size for favorable results.
The beauty of this Indicator lies in the fact that it can be used for all types of trading like Scalping, Intra day, Swing or Positional and Investments also. It works on all timeframes and across all market segments like EQUITY, COMMODITIES, FUTURES , OPTIONS , FOREX etc.
This indicator can be used for any exchange and any timezone also without any changes or adjustments needed.
Now let us understand the features of this Indicator in detail.
TIMEFRAME - It has options to choose between Day,week and month as timeframe. By default it is set to Day timeframe
DISPLAY MAJOR LEVELS - These are the important support and resistance levels calculated based on the past price data. Most important ones are marked in BOLD RED and BOLD GREEN between which the price tends to move generally.
Apart from these, We have breakout level marked in light green and if price breaks this level we can expect targets upto extended levels and beyond marked in blue.
we also have breakdown level marked in light red and if price breaks this level we can expect targets down up to extended levels and below it marked in blue.
In addition I have coded intermediate target levels that appear in light gray between the extended levels or blue lines. Sometimes when the gap between these targets are huge, price cannot reach the targets and reverses at these intermediate targets. You can use them as targets or trailing stoploss based on your plan
DISPLAY HIDDEN LEVELS - These levels are intermediate supports and resistances that can be used whenever the present day indicated range is very wide. Whenever we have an explosive moments in market the range of that day is very huge and so he next day support and resistance band becomes very wide indicating the sideways movement day within that range. And on those days we can switch on the hidden levels and the price respects these levels and most of the days it is inside this range only.
DISPLAY PREVIOUS HIGH / LOW / CLOSE - I have included Daily / Weekly and monthly levels. It is important to know the earlier highs / lows and close since price respects it very must just like support and resistance.
PEMA - This is an important EMA based indicator which potentially indicates curves of support and resistance during retracements or pullbacks. If the curves are breached then the trend is reversed and the price will tend to move to the next pivots.
VALUE AREA - One of the most important feature of this Indicator is this which is derived from the Volume profile concepts. It indicates the fair value area Indicated by orange band and the upper and lower limits indicated by orange lines. Whenever the price is overvalued or undervalued, it is pushed back to its fair value and we can judge the present price position in relation to the value area and then take position in anticipation of the price reaching its fair value area. This must be coupled with price action for favorable results.
IMPORTANT NOTE : This indicator does not guarantee any favorable results nor protect your from any loss. You own the complete risk of your trades. It is suggested that you use this indicator and do back testing for considerable period to understand how it works the the potential win rate it can give.
If you have any doubts or need any clarifications of assistance in understanding, you can message me and i will try to help.
I will soon try to make a Video and explain the use of this indicator for better clarity and understanding.
Happy and Safe trading - Mohan from PIVOT EDGE

Dynamic Sigma VWAP and Volume Sigma LevelsEver Wondered How can you confidently Identify Reversals / and Trend Direction with Volume ?
So this Script will help you out with that!
What I am talking About?
1. Volume Standard Deviations Spikes being Projected Over the Price
2. Dynamic VWAP being Calculated from the Points of extremities in Volume Action {estimated using Standard Deviation Sigma Level}
So,
This is how sigma levels of 1sigma, 2sigma and 3sigma will look over the volume
Whenever Volume Spikes through these Sigma Levels,
Price Projections are Formed by this Indicator, both on Current Timeframes and Higher Timeframes Prices
So,
This is what price projection of Volume Sigma Levels (1,2,3sigmas crosses) will look if projected on Same Timeframe period
And This is how they look on chart using Higher Timeframe Period, (Default Higher Time Frame is 60mins, You can tweak as per your convenience)
Once All the Sigmas are projected Over the Price,
Dynamic VWAP is calculated from the points where volume crosses current Time Frame 2sigma and 3sigma Levels
see,
This helps out in figuring a lot of things in the price volume action!
Play with it, and Enjoy!

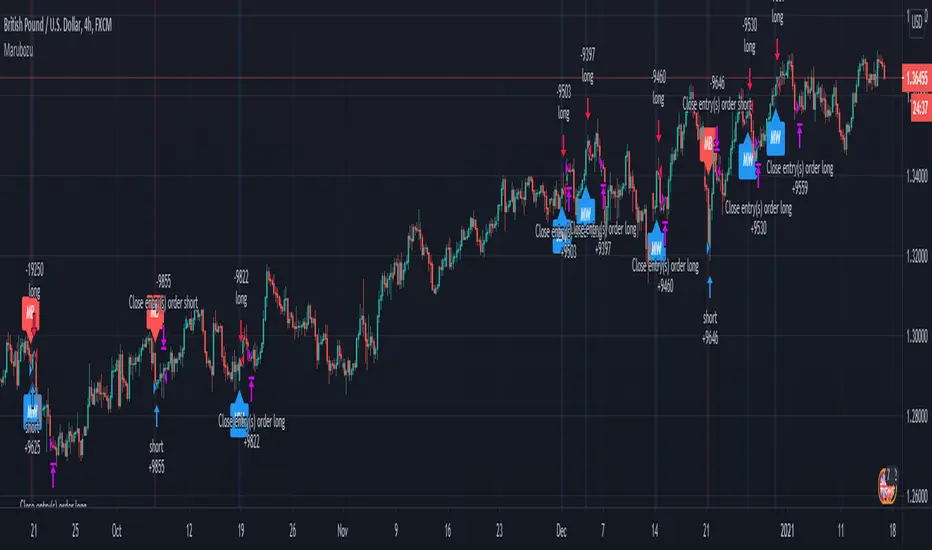
Marubozu Forex Price actionHi, today I bring you a price action strategy/indicator for Forex, made out for Marubozu candle type.
For the entries of it check if we have a long or a short marubozu.
For exit we have for long when the actual candle is green and the last previous two were red.
For exit we have for short, when the actual candle is red and the last previous two were green.
If you have any questions private message me !
Demand and Supply zone Master IndicatorThe Demand and Supply Zone indicator helps to identify the valid demand and supply zones by removing the played out zones. This indicator looks for all patterns , Rally-Base-Rally and Drop-Base-Rally mark the zone as "DZ". Same way with pattern Drop-Base-Drop and Rally-Base-Drop it will mark "SZ".
The indicator is fully customizable as per your trading style.
What does the Indicator do ?
Normal = Aggressive Trader
Strong = Conservative Trader
V Strong = V Conservative Trader
Based on Trading style one can choose the option available. Default gives the best result.
1. Explosive candle Range : One can choose explosive candle range.
2. Basing Candle Range : One Can Choose Basing candle range.
3. Normal Candle Range : One can choose the normal candle range.
4. Legout Strength : One can customize the Legout Strength.
5. Demand and Supply zone version :
High - Low = Most traders use the high and low of the basing for calculating their zone.
Body - Low = Body (Base candle body high for demand zone and Body low for supply zone ). Normally beginner ( Conservative trader ) uses this option.
Continuous base = 1 to 10 : Based on the requirement one can use the number of basing candle.
max normal = 2 to 10 : Based on the requirement one can use the number of normal candle.
min normal = 1 to 10 : Min one to form the zone.
Line width = 1 to 5
MaxTouches = One can set the number of times the price visits the zone. 1 for Conservative trader and 3 for aggressive trader. Once the price touches the zone more than the given input, lines get deleted. Also if the price is grater that the zone value, line deletes.
Bar Lookback = How many bars to look back to check the strength of the candle. Default gives the best result.
Max Demand and Supply zones and Show all active Demand and Supply zones = One can visually see played out ( violated ) zones by unticking the Active zones option.
Otherwise indicator will show only the Active zones.
One can see max of 100 violated zones .
PM us to obtain the access.

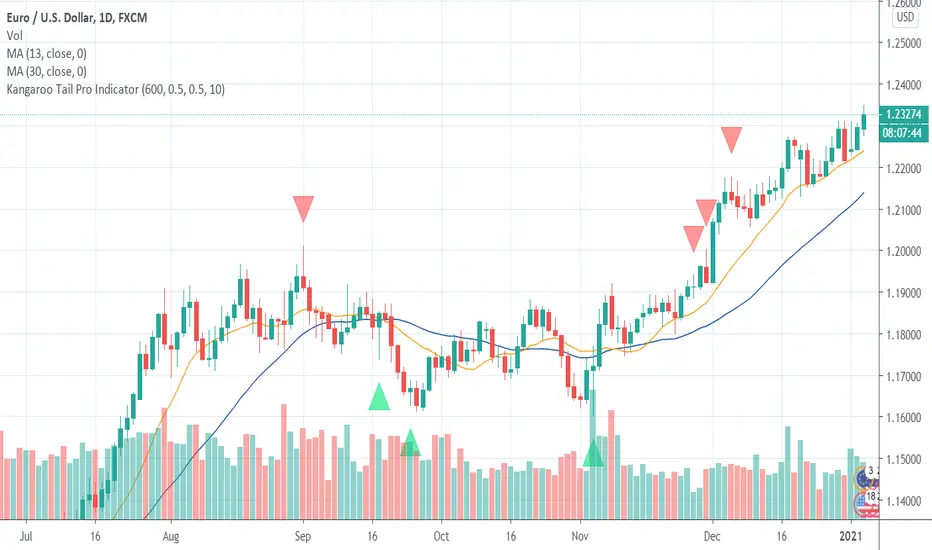
Kangaroo Tail Pro Indicator
Kangaroo Tail Indicator is a pattern recognition indicator for Forex, Stocks, Indices, Futures, Commodities and Cryptos.
The Kangaroo Tail is a multi-bar pattern.
The Kangaroo Tail is both simple and very effective pattern to trade.
The strategy that comes with the Kangaroo Tail is based on price action.
The indicator does what it was designed for: displaying Kangaroo Tail patterns. Don't expect to follow the up and down arrows and make money. Trading is not that simple. The Kangaroo Tail pattern is a starting point. The arrow is not a confirmed BUY and SELL signal in itself. The Kangaroo Tail indicator alerts you that the market might be at a turning point now. Then you must use other elements of your strategy (trend, momentum, support/resistance, volatility, daily bias, and other indicators) to confirm the signal and place a trade.
The Kangaroo Pro version lets users adjust the pattern definition. This version is meant for expert traders who want to use their own optimized settings for the pattern.
Inputs of the indicator are:
MaxBars: number of bars back used to calculate the indicator
Automatic(true/false): you can either use the defaults conservative settings (automatic=true) or use your own settings (automatic=false).
BuySignals (true/false): you can filter signals and decide to show BUY signals or not. Default settings is true (no filter).
SellSignals (true/false): you can filter signals and decide to show SELL signals or not. Default settings is true (no filter).
CandleSize: filter signals depending on the size of candle (0.5 to 1.5 recommended range of values)
BodyPercent: position of body compared to the complete candle range (0.2 to 0.4 recommended range of values)
RoomLeftBars: room on the left you want to have for valid pattern (counted as a number of bars, recommended values of 5 to 30).
Alerts:
The alerts are managed by TradingView trading platform features and not by the indicator itself. You must use Kangaroo Sell less than zero and Kangaroo Buy greater than zero as settings for the alerts.
Beware that TradingView limits the number of alerts you can receive according to the plan you subscribed with the platform.
Beware that alerts are managed by TradingView trading platform features and not by the indicator itself. We provide settings for alerts as a courtesy. If you have problems with alerts or need special settings then please contact TradingView support since alerting is not a feature managed by the indicator.
Trading rules:
For BUY: wait for a bullish Kangaroo Tail to print on a support zone after a down trend. Wait for price to break high of the Kangaroo Tail candle (5 pips above the high for H1 and higher time frames). Immediately enter in the trade once high is broken. You also can use a BUY STOP order placed 5 pips above the high of the candle (plus spread). Stop Loss should be placed below the low of the Kangaroo Tail candle. If order is not triggered in the next candle then trade is invalidated and should be canceled.
For SELL: wait for a bearish Kangaroo Tail to print on resistance zone after an up trend. Wait for price to break the low of the Kangaroo Tail candle (5 pips below the low for H1 and higher time frames). Immediately enter in the trade once low is broken. You also can use a SELL STOP order place 5 pips below the low of the candle. Stop Loss should be placed above the high of the Kangaroo Tail candle. If order is not triggered in the next candle then trade is invalidated and should be canceled.
The Kangaroo Tail indicator can be used with any time frame.
The Kangaroo Tail indicator can be used with any class of assets: Forex, Stocks, Indices, Futures, Commodities and Cryptos.
Beware that in accordance with TradingView rules, we cannot update this description over time. At the time you are reading this description it might be outdated. We recommend you to visit our website for up to date information.
Booming Bull 15 Min StrategyBooming Bull 15 Min strategy
Conditions
First 15 min candle high-low must be less than .75%
Next candle is crossing either high or low

RogTrader HFT AlgoThis is a simple algorithm to generate Buy, Sell, Short, and Cover Signals. It uses the following:
RSI , MACD , Stochastic , Bollinger Bands , Ketler Channels, ATR Trailing Stop, Trend, and Volume .
Usage is simple: Green Background is Long and Red Background is Short positions.
LE = Long Entry
LX = Long Exit
SE = Short Entry
SX = Short Exit
This is not a trade recommendation, rather informative signals, and please do your due diligence. Thanks!

Vision VolumeAfter reading an article on how to trade volume I felt that I needed some kind of indicator using price action and volume together.
More precisely I tried to build two indicators. Bear in mind this indactor is very simple because it only evaluates each bar with its previous bar and an average.
Nr.1 Weak/fake push: Price suddenly goes up/down a lot more but without much volume being traded -> sign of a fake move or low interest
Nr 2 Price action resistance: After an up or down move price suddenly stops moving but high volumes are being traded. This means high resistance from sellers in a rally or buyers in a decline.
This is very simple and as you can see it is often not a clear signal. I will try to improve it further. If a fake move bar (purple) has a close near its new high we don't know if the fake push will continue. As you can see on the chart. some reversal signs come a little to early.
You can re-color labels and turn them off optionally.
This is built for educational purposes only. I hope you find it useful.
Design by Hook

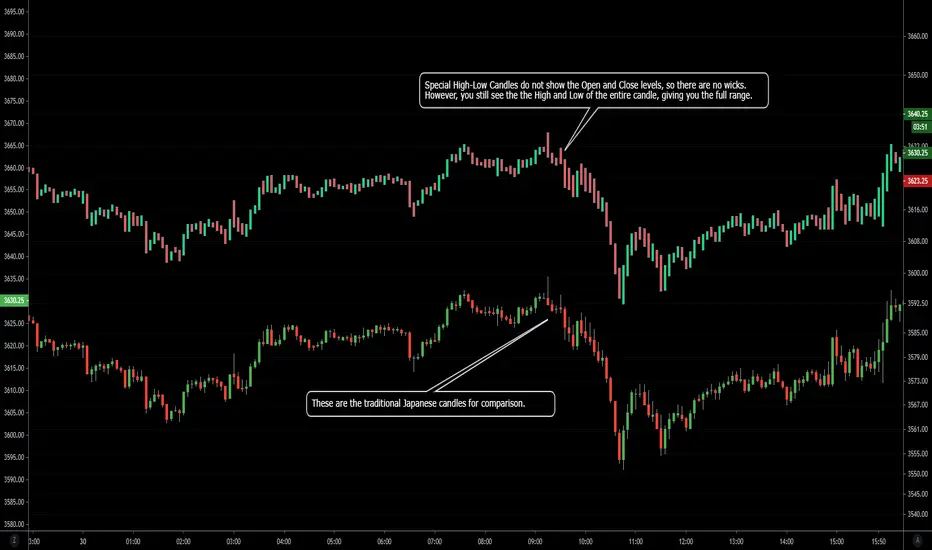
NSDT Special High-Low CandlesThis is an interesting take on candlesticks. These special High-Low Candles do not show the Open and Close levels, so there are no wicks. However, you still see the the High and Low of the entire candle, giving you the full range.
Since this is an indicator, be sure to hide the chart candles to avoid overlap. Or choose offsetting colors to see the traditional candles under the indicator candles.
[TrustedSignals] Oscillator DivergencesDivergences are powerful tools that assess the price momentum and the likelihood of a price reversal. A positive divergence occurs when the price of an asset makes a new low while an oscillator, starts to climb. Conversely, a negative divergence is when the price makes a new high but the oscillator analyzed makes a lower high.
Once again, with the idea of providing an All-in-One indicator, this script can display the Divergences in up to 9 most used oscillators (RSI, Stochastic RSI, Stochastic, Williams%, MFI, ChangeMO, CCI, BB %B) including our own branded no-lag ‘ TS Oscillator ’
We have also included an optional custom no-lag smoothing function, that allows the user to smooth out the noise on all the oscillators and increase their accuracy, without delaying the actual data. This feature can be turned off if necessary and the smoothing length can be manually adjusted.
After the user selects from the first input the desired oscillator, the indicator can display Regular and Hidden Divergences on the chart.
The lookback period of the divergences is also fully configurable, as the settings for each of our individual oscillators.

Amazing strategy for silver -XAGUSD, XAGEUR etcToday I bring an amazing strategy that works for 1h time frames for silver.
Its made of price actions movement combined together with MACD and simple moving average
It does not use neither stop loss/take profit levels. Instead it will always exit at the next candle after it opens a trade.
The rules are the next one :
For short condition : we have a bull candle, and candle is above the moving average, and MACD histogram is > 0 and last high0 and candle close > last high1 and, previus high1 and candle close > last high2
At the same time, viceversa for long condition.
In development terms, this is the formula
long1 = (close > open ) and time_cond and close > out and hist > 0 and hist > hist and high > high and high > high and close > high and close > high and close > high
short1 = (close < open) and time_cond and close < out and hist < 0 and hist < hist and low < low and low < low and close < low and close < low and close < low
But when we enter the trade, we enter in reverse, like lets say we go long -> for this we apply the short1 condition. If we go short we apply the long1 condition.
If you have any questions , please let me know .

Multi Price Action & Candlestick Patterns - Horizontals R/SNote:
This is a script that synthesizes a number of popular price action and candlestick patterns along with a trading strategy based on horizontal support and resistance. Scripts are used for learning and research purposes.
Useage:
Support and resistance are two important areas in Price Action analysis and trading. After confirming the support and resistance zone line, waiting to confirm the appropriate candlestick pattern and execute the trade, set a reasonable stop loss and take profit, This is critical for compliance with your money management rules.
Notation:
In the script, price action and candlestick pattern are denoted as follows:
- Bullish Engulfing (BU) & Bearish Engulfing (BE)
- Hammer (HM)
- Hanging Man (MM)
- Morning Star (MS)
- Evening Star (ES)
- Tweezer Top (TZT)
- Tweezer Bottom (TZB)
- Shooting Star (SS)
- Bullish Pinbar (PBBBU) & Bearish Pinbar (PBBE)
- Doji Gravestone (GS)
- Doji Dragonfly (DF)
- Doji - Long legged (LL)
- Spinning Top (ST)
Settings:
- Number of left candle to compare lowest/highest: Compare the high/low price of the current candle with the highest/lowest price of previous candles.
- Number of left candle to calc avg body: Compare the average price of the current candle with the average price of previous candles
- S/R Left Bars: The number of bars left hand side of the Pivot
- S/R Right Bars: The number of bars right hand side of the Pivot
- S/R Volume Threshold - The threshold value (%) for the volume oscillator
The code is open and commented - please feel free to use, share, comment & provide feedback.
Good luck!
Feel free to get indicator or strategy trading signals at yummyprofit.

Market EmotionsThis is a simple and fun indicator I built out of boredom one night. It's great for a quick laugh, but other than that, it's useless. It simply displays emotes for various thresholds of change in price between the open and close of a candle. For example, unicorn candles are any candles that gain 25% or more from opening price to closing price.

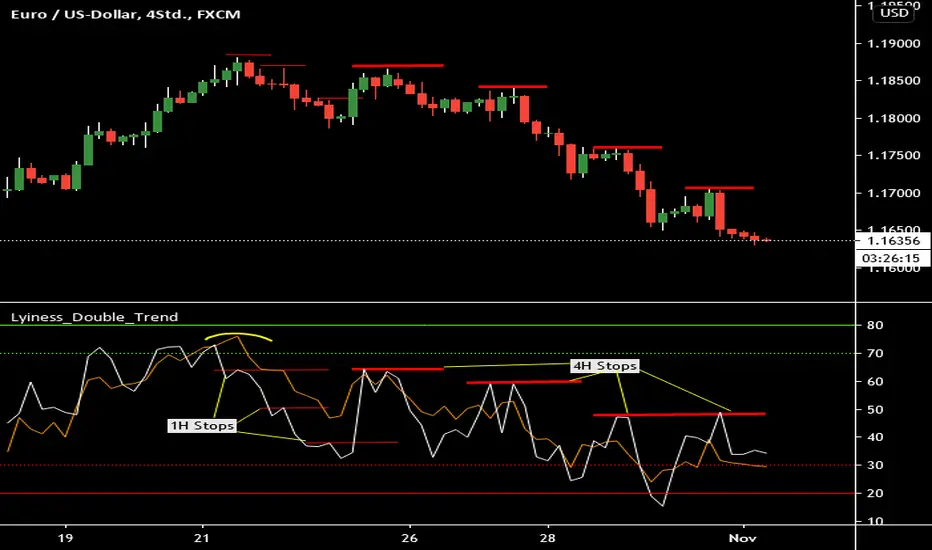
Lyiness_Double_TrendLyiness_Double_Trend/Strategie
The idea is to identify a big move in the 4H chart, which you convert into smaller trades to pull the stop into the profit zone as quickly as possible.
orange zigzag 4H
white zigzag-1H
Look for a visible trend reversal in the red and green zones at the upper and lower edges.
For example, in the settings you can change the time of the zigzag to 15 minutes in order to trade a large trend movement even more precisely.
RogTrader AlgoA simple BUY/SELL algorithm based on Moving Averages (EMA), MACD, RSI, Stochastic, ADX, ATR, CCI, OBV, Pivot Points, and Parabolic Sar, and Volume averaged.
Simple algo that uses multiples indicator strengths and weight them to generate buy and sell signals
Indicator strengths are displayed on each candle (green is bullish and red is bearish)
Green Buy and Red Sell shall be primarily used for long positions
Bull and Bear Strengths are created based on Price Action, and Volume, the length of the array shows upward or downward strength
Indicators' Signal Strength shows number Indicators' indication for the direction.
Bollinger Bands are in red and green filled
VWAP Bands are in gray, green, and red
Linear Regression is the blue line
Check multiple timeframes.
