Autoregressive Covariance Oscillator by TenozenWell to be honest I don't know what to name this indicator lol. But anyway, here is my another original work! Gonna give some background of why I create this indicator, it's all pretty much a coincidence when I'm learning about time series analysis.
_ _ _ _ _ _ _ _ _ _ _ _ _ _ _ _ _ _ _ _ _ _ _ _ _ _ _ _ _ _ _ _ _ _ _ _ _
Well, the formula of Auto-covariance is:
E{(X(t)-(t) * (X(t-s)-(t-s))}= Y_s
But I don't multiply both values but rather subtract them:
E{(X(t)-(t) - (X(t-s)-(t-s))}= Y_s?
_ _ _ _ _ _ _ _ _ _ _ _ _ _ _ _ _ _ _ _ _ _ _ _ _ _ _ _ _ _ _ _ _ _ _ _ _
For arm_vald, the equation is as follows:
arm_vald = val_mu + mu_plus_lsm + et
val_mu --> mean of time series
mu_plus_lsm --> val_mu + LSM
et --> error term
As you can see, val_mu^2. I did this so the oscillator is much smoother.
_ _ _ _ _ _ _ _ _ _ _ _ _ _ _ _ _ _ _ _ _ _ _ _ _ _ _ _ _ _ _ _ _ _ _ _ _
After I get the value, I normalize them:
aco = Y_s? / arm_vald
So by this calculation, I get something like an oscillator!
(more details in the code)
_ _ _ _ _ _ _ _ _ _ _ _ _ _ _ _ _ _ _ _ _ _ _ _ _ _ _ _ _ _ _ _ _ _ _ _ _
So how to use this indicator? It's so easy! If the value is above 0, we gonna expect a bullish response, if the value is below 0, we gonna expect a bearish response; that simple. Be aware that you should wait for the price to be closed before executing a trade.
Well, try it out! So far this is the most powerful indicator that I've created, hope it's useful. Ciao.
(more updates for the indicator if needed)
Quantitative

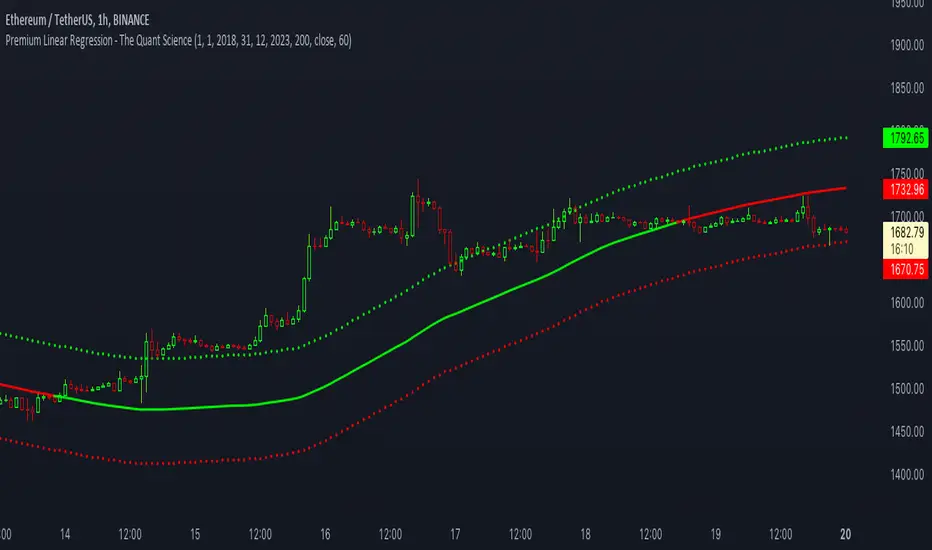
Premium Linear Regression - The Quant ScienceThis script calculates the average deviation of the source data from the linear regression. When used with the indicator, it can plot the data line and display various pieces of information, including the maximum average dispersion around the linear regression.
The code includes various user configurations, allowing for the specification of the start and end dates of the period for which to calculate linear regression, the length of the period to use for the calculation, and the data source to use.
The indicator is designed for multi-timeframe use and to facilitate analysis for traders who use regression models in their analysis. It displays a green linear regression line when the price is above the line and a red line when the price is below. The indicator also highlights areas of dispersion around the regression using circles, with bullish areas shown in green and bearish areas shown in red.
Quantitative Price Forecasting - The Quant ScienceThis script is a quantitative price forecasting indicator that forecasts price changes for a given asset.
The model aims to forecast future prices by analyzing past data within a selected time period. Mathematical probability is used to calculate whether starting from time X can lead to reaching prices Y1 and Y2. In this context, X represents the current selected time period, Y1 represents the selected percentage decrease, and Y2 represents the selected percentage increase. The probabilities are estimated using the simple average.
The simple average is displayed on the chart, showing in red the periods where the price is below the average and in green the periods where the price is above the average.
This powerful tool not only provides forecasts of future prices but also calculates the distribution of variations around the average. It then takes this information and creates an estimate of the average price variation around the simple average.
Using a mean-reverting logic, buying and selling opportunities are highlighted.
We recommend turning off the display of bars on your chart for a better experience when using this indicator.
Unlock the full potential of your trading strategy with our powerful indicator. By analyzing past price data, it provides accurate forecasts and calculates the probability of reaching specific price targets. Its mean-reverting logic highlights buying and selling opportunities, while the simple moving average displayed on the chart shows periods where the price is above or below the average. Additionally, it estimates the average variation of price around the simple average, giving you valuable insights into price movements. Don't miss out on this valuable tool that can take your trading to the next level

Titan Investments|Quantitative THEMIS|Pro|BINANCE:BTCUSDTP:4hInvestment Strategy (Quantitative Trading)
| 🛑 | Watch "LIVE" and 'COPY' this strategy in real time:
🔗 Link: www.tradingview.com
Hello, welcome, feel free 🌹💐
Since the stone age to the most technological age, one thing has not changed, that which continues impress human beings the most, is the other human being!
Deep down, it's all very simple or very complicated, depends on how you look at it.
I believe that everyone was born to do something very well in life.
But few are those who have, let's use the word 'luck' .
Few are those who have the 'luck' to discover this thing.
That is why few are happy and successful in their jobs and professions.
Thank God I had this 'luck' , and discovered what I was born to do well.
And I was born to program. 👨💻
📋 Summary : Project Titan
0️⃣ : 🦄 Project Titan
1️⃣ : ⚖️ Quantitative THEMIS
2️⃣ : 🏛️ Titan Community
3️⃣ : 👨💻 Who am I ❔
4️⃣ : ❓ What is Statistical/Probabilistic Trading ❓
5️⃣ : ❓ How Statistical/Probabilistic Trading works ❓
6️⃣ : ❓ Why use a Statistical/Probabilistic system ❓
7️⃣ : ❓ Why the human brain is not prepared to do Trading ❓
8️⃣ : ❓ What is Backtest ❓
9️⃣ : ❓ How to build a Consistent system ❓
🔟 : ❓ What is a Quantitative Trading system ❓
1️⃣1️⃣ : ❓ How to build a Quantitative Trading system ❓
1️⃣2️⃣ : ❓ How to Exploit Market Anomalies ❓
1️⃣3️⃣ : ❓ What Defines a Robust, Profitable and Consistent System ❓
1️⃣4️⃣ : 🔧 Fixed Technical
1️⃣5️⃣ : ❌ Fixed Outputs : 🎯 TP(%) & 🛑SL(%)
1️⃣6️⃣ : ⚠️ Risk Profile
1️⃣7️⃣ : ⭕ Moving Exits : (Indicators)
1️⃣8️⃣ : 💸 Initial Capital
1️⃣9️⃣ : ⚙️ Entry Options
2️⃣0️⃣ : ❓ How to Automate this Strategy ❓ : 🤖 Automation : 'Third-Party Services'
2️⃣1️⃣ : ❓ How to Automate this Strategy ❓ : 🤖 Automation : 'Exchanges
2️⃣2️⃣ : ❓ How to Automate this Strategy ❓ : 🤖 Automation : 'Messaging Services'
2️⃣3️⃣ : ❓ How to Automate this Strategy ❓ : 🤖 Automation : '🧲🤖Copy-Trading'
2️⃣4️⃣ : ❔ Why be a Titan Pro 👽❔
2️⃣5️⃣ : ❔ Why be a Titan Aff 🛸❔
2️⃣6️⃣ : 📋 Summary : ⚖️ Strategy: Titan Investments|Quantitative THEMIS|Pro|BINANCE:BTCUSDTP:4h
2️⃣7️⃣ : 📊 PERFORMANCE : 🆑 Conservative
2️⃣8️⃣ : 📊 PERFORMANCE : Ⓜ️ Moderate
2️⃣9️⃣ : 📊 PERFORMANCE : 🅰 Aggressive
3️⃣0️⃣ : 🛠️ Roadmap
3️⃣1️⃣ : 🧻 Notes ❕
3️⃣2️⃣ : 🚨 Disclaimer ❕❗
3️⃣3️⃣ : ♻️ ® No Repaint
3️⃣4️⃣ : 🔒 Copyright ©️
3️⃣5️⃣ : 👏 Acknowledgments
3️⃣6️⃣ : 👮 House Rules : 📺 TradingView
3️⃣7️⃣ : 🏛️ Become a Titan Pro member 👽
3️⃣8️⃣ : 🏛️ Be a member Titan Aff 🛸
0️⃣ : 🦄 Project Titan
This is the first real, 100% automated Quantitative Strategy made available to the public and the pinescript community for TradingView.
You will be able to automate all signals of this strategy for your broker , centralized or decentralized and also for messaging services : Discord, Telegram or Twitter .
This is the first strategy of a larger project, in 2023, I will provide a total of 6 100% automated 'Quantitative' strategies to the pinescript community for TradingView.
The future strategies to be shared here will also be unique , never before seen, real 'Quantitative' bots with real, validated results in real operation.
Just like the 'Quantitative THEMIS' strategy, it will be something out of the loop throughout the pinescript/tradingview community, truly unique tools for building mutual wealth consistently and continuously for our community.
1️⃣ : ⚖️ Quantitative THEMIS : Titan Investments|Quantitative THEMIS|Pro|BINANCE:BTCUSDTP:4h
This is a truly unique and out of the curve strategy for BTC /USD .
A truly real strategy, with real, validated results and in real operation.
A unique tool for building mutual wealth, consistently and continuously for the members of the Titan community.
Initially we will operate on a monthly, quarterly, annual or biennial subscription service.
Our goal here is to build a great community, in exchange for an extremely fair value for the use of our truly unique tools, which bring and will bring real results to our community members.
With this business model it will be possible to provide all Titan users and community members with the purest and highest degree of sophistication in the market with pinescript for tradingview, providing unique and truly profitable strategies.
My goal here is to offer the best to our members!
The best 'pinescript' tradingview service in the world!
We are the only Start-Up in the world that will decentralize real and full access to truly real 'quantitative' tools that bring and will bring real results for mutual and ongoing wealth building for our community.
2️⃣ : 🏛️ Titan Community : 👽 Pro 🔁 Aff 🛸
Become a Titan Pro 👽
To get access to the strategy: "Quantitative THEMIS" , and future Titan strategies in a 100% automated way, along with all tutorials for automation.
Pro Plans: 30 Days, 90 Days, 12 Months, 24 Months.
👽 Pro 🅼 Monthly
👽 Pro 🆀 Quarterly
👽 Pro🅰 Annual
👽 Pro👾Two Years
You will have access to a truly unique system that is out of the curve .
A 100% real, 100% automated, tested, validated, profitable, and in real operation strategy.
Become a Titan Affiliate 🛸
By becoming a Titan Affiliate 🛸, you will automatically receive 50% of the value of each new subscription you refer .
You will receive 50% for any of the above plans that you refer .
This way we will encourage our community to grow in a fair and healthy way, because we know what we have in our hands and what we deliver real value to our users.
We are at the highest level of sophistication in the market, the consistency here and the results here speak for themselves.
So growing our community means growing mutual wealth and raising collective conscience.
Wealth must be created not divided.
And here we are creating mutual wealth on all ends and in all ways.
A non-zero sum system, where everybody wins.
3️⃣ : 👨💻 Who am I ❔
My name is FilipeSoh I am 26 years old, Technical Analyst, Trader, Computer Engineer, pinescript Specialist, with extensive experience in several languages and technologies.
For the last 4 years I have been focusing on developing, editing and creating pinescript indicators and strategies for Tradingview for people and myself.
Full-time passionate workaholic pinescript developer with over 10,000 hours of pinescript development.
• Pinescript expert ▬Tradingview.
• Specialist in Automated Trading
• Specialist in Quantitative Trading.
• Statistical/Probabilistic Trading Specialist - Mark Douglas Scholl.
• Inventor of the 'Classic Forecast' Indicators.
• Inventor of the 'Backtest Table'.
4️⃣ : ❓ What is Statistical/Probabilistic Trading ❓
Statistical/probabilistic trading is the only way to get a positive mathematical expectation regarding the market and consequently that is the only way to make money consistently from it.
I will present below some more details about the Quantitative THEMIS strategy, it is a real strategy, tested, validated and in real operation, 'Skin in the Game' , a consistent way to make money with statistical/probabilistic trading in a 100% automated.
I am a Technical Analyst , I used to be a Discretionary Trader , today I am 100% a Statistical Trader .
I've gotten rich and made a lot of money, and I've also lost a lot with 'leverage'.
That was a few years ago.
The book that changed everything for me was "Trading in The Zone" by Mark Douglas.
That's when I understood that the market is just a game of statistics and probability, like a casino!
It was then that I understood that the human brain is not prepared for trading, because it involves triggers and mental emotions.
And emotions in trading and in making trading decisions do not go well together, not in the long run, because you always have the burden of being wrong with the outcome of that particular position.
But remembering that the market is just a statistical game!
5️⃣ : ❓ How Statistical/Probabilistic Trading works ❓
Let's use a 'coin' as an example:
If we toss a 'coin' up 10 times.
Do you agree that it is impossible for us to know exactly the result of the 'plays' before they actually happen?
As in the example above, would you agree, that we cannot "guess" the outcome of a position before it actually happens?
As much as we cannot "guess" whether the coin will drop heads or tails on each flip.
We can analyze the "backtest" of the 10 moves made with that coin:
If we analyze the 10 moves and count the number of times the coin fell heads or tails in a specific sequence, we then have a percentage of times the coin fell heads or tails, so we have a 'backtest' of those moves.
Then on the next flip we can now assume a point or a favorable position for one side, the side with the highest probability .
In a nutshell, this is more or less how probabilistic statistical trading works.
As Statistical Traders we can never say whether such a Trader/Position we take will be a winner or a loser.
But still we can have a positive and consistent result in a "sequence" of trades, because before we even open a position, backtests have already been performed so we identify an anomaly and build a system that will have a positive statistical advantage in our favor over the market.
The advantage will not be in one trade itself, but in the "sequence" of trades as a whole!
Because our system will work like a casino, having a positive mathematical expectation relative to the players/market.
Design, develop, test models and systems that can take advantage of market anomalies, until they change.
Be the casino! - Mark Douglas
6️⃣ : ❓ Why use a Statistical/Probabilistic system ❓
In recent years I have focused and specialized in developing 100% automated trading systems, essentially for the cryptocurrency market.
I have developed many extremely robust and efficient systems, with positive mathematical expectation towards the market.
These are not complex systems per se , because here we want to avoid 'over-optimization' as much as possible.
As Da Vinci said: "Simplicity is the highest degree of sophistication".
I say this because I have tested, tried and developed hundreds of systems/strategies.
I believe I have programmed more than 10,000 unique indicators/strategies, because this is my passion and purpose in life.
I am passionate about what I do, completely!
I love statistical trading because it is the only way to get consistency in the long run!
This is why I have studied, applied, developed, and specialized in 100% automated cryptocurrency trading systems.
The reason why our systems are extremely "simple" is because, as I mentioned before, in statistical trading we want to exploit the market anomaly to the maximum, that is, this anomaly will change from time to time, usually we can exploit a trading system efficiently for about 6 to 12 months, or for a few years, that is; for fixed 'scalpers' systems.
Because at some point these anomalies will be identified , and from the moment they are identified they will be exploited and will stop being anomalies .
With the system presented here; you can even copy the indicators and input values shared here;
However; what I have to offer you is: it is me , our team , and our community !
That is, we will constantly monitor this system, for life , because our goal here is to create a unique , perpetual , profitable , and consistent system for our community.
Myself , our team and our community will keep this script periodically updated , to ensure the positive mathematical expectation of it.
So we don't mind sharing the current parameters and values , because the real value is also in the future updates that this system will receive from me and our team , guided by our culture and our community of real users !
As we are hosted on 'tradingview', all future updates for this strategy, will be implemented and updated automatically on your tradingview account.
What we want here is: to make sure you get gains from our system, because if you get gains , our ecosystem will grow as a whole in a healthy and scalable way, so we will be generating continuous mutual wealth and raising the collective consciousness .
People Need People: 3️⃣🅿
7️⃣ : ❓ Why the human brain is not prepared to do Trading ❓
Today my greatest skill is to develop statistically profitable and 100% automated strategies for 'pinescript' tradingview.
Note that I said: 'profitable' because in fact statistical trading is the only way to make money in a 'consistent' way from the market.
And consequently have a positive wealth curve every cycle, because we will be based on mathematics, not on feelings and news.
Because the human brain is not prepared to do trading.
Because trading is connected to the decision making of the cerebral cortex.
And the decision making is automatically linked to emotions, and emotions don't match with trading decision making, because in those moments, we can feel the best and also the worst sensations and emotions, and this certainly affects us and makes us commit grotesque mistakes!
That's why the human brain is not prepared to do trading.
If you want to participate in a fully automated, profitable and consistent trading system; be a Titan Pro 👽
I believe we are walking an extremely enriching path here, not only in terms of financial returns for our community, but also in terms of knowledge about probabilistic and automated statistical trading.
You will have access to an extremely robust system, which was built upon very strong concepts and foundations, and upon the world's main asset in a few years: Bitcoin .
We are the tip of the best that exists in the cryptocurrency market when it comes to probabilistic and automated statistical trading.
Result is result! Me being dressed or naked.
This is just the beginning!
But there is a way to consistently make money from the market.
Being the Casino! - Mark Douglas
8️⃣ : ❓ What is Backtest ❓
Imagine the market as a purely random system, but even in 'randomness' there are patterns.
So now imagine the market and statistical trading as follows:
Repeating the above 'coin' example, let's think of it as follows:
If we toss a coin up 10 times again.
It is impossible to know which flips will have heads or tails, correct?
But if we analyze these 10 tosses, then we will have a mathematical statistic of the past result, for example, 70 % of the tosses fell 'heads'.
That is:
7 moves fell on "heads" .
3 moves fell on "tails" .
So based on these conditions and on the generic backtest presented here, we could adopt " heads " as our system of moves, to have a statistical and probabilistic advantage in relation to the next move to be performed.
That is, if you define a system, based on backtests , that has a robust positive mathematical expectation in relation to the market you will have a profitable system.
For every move you make you will have a positive statistical advantage in your favor over the market before you even make the move.
Like a casino in relation to all its players!
The casino does not have an advantage over one specific player, but over all players, because it has a positive mathematical expectation about all the moves that night.
The casino will always have a positive statistical advantage over its players.
Note that there will always be real players who will make real, million-dollar bankrolls that night, but this condition is already built into the casino's 'strategy', which has a pre-determined positive statistical advantage of that night as a whole.
Statistical trading is the same thing, as long as you don't understand this you will keep losing money and consistently.
9️⃣ : ❓ How to build a Consistent system ❓
See most traders around the world perform trades believing that that specific position taken will make them filthy rich, because they simply believe faithfully that the position taken will be an undoubted winner, based on a trader's methodology: 'trading a trade' without analyzing the whole context, just using 'empirical' aspects in their system.
But if you think of trading, as a sequence of moves.
You see, 'a sequence' !
When we think statistically, it doesn't matter your result for this , or for the next specific trade , but the final sequence of trades as a whole.
As the market has a random system of results distribution , if your system has a positive statistical advantage in relation to the market, at the end of that sequence you'll have the biggest probability of having a winning bank.
That's how you do real trading!
And with consistency!
Trading is a long term game, but when you change the key you realize that it is a simple game to make money in a consistent way from the market, all you need is patience.
Even more when we are based on Bitcoin, which has its 'Halving' effect where, in theory, we will never lose money in 3 to 4 years intervals, due to its scarcity and the fact that Bitcoin is the 'discovery of digital scarcity' which makes it the digital gold, we believe in this thesis and we follow Satoshi's legacy.
So align Bitcoin with a probabilistic statistical trading system with a positive mathematical expectation of the market and 100% automated with the long term, and all you need is patience, and you will become rich.
In fact Bitcoin by itself is already a path, buy, wait for each halving and your wealth will be maintained.
No inflation, unlike fiat currencies.
This is a complete and extremely robust strategy, with the most current possible and 'not possible' techniques involved and applied here.
Today I am at another level in developing 100% automated 'quantitative' strategies.
I was born for this!
🔟 : ❓ What is a Quantitative Trading system ❓
In addition to having access to a revolutionary strategy you will have access to disruptive 100% multifunctional tables with the ability to perform 'backtests' for better tracking and monitoring of your system on a customized basis.
I would like to emphasize one thing, and that is that you keep this in mind.
Today my greatest skill in 'pinescript' is to build indicators, but mainly strategies, based on statistical and probabilistic trading, with a postive mathematical expectation in relation to the market, in a 100% automated way.
This with the goal of building a consistent and continuous positive equity curve through mathematics using data, converting it into statistical / probabilistic parameters and applying them to a Quantitative model.
Before becoming a Quantitative Trader , I was a Technical Analyst and a Discretionary Trader .
First as a position trader and then as a day trader.
Before becoming a Trader, I trained myself as a Technical Analyst , to masterly understand the shape and workings of the market in theory.
But everything changed when I met 'Mark Douglas' , when I got to know his works, that's when my head exploded 🤯, and I started to understand the market for good!
The market is nothing more than a 'random' system of distributing results.
See that I said: 'random' .
Do yourself a mental exercise.
Is there really such a thing as random ?
I believe not, as far as we know maybe the 'singularity'.
So thinking this way, to translate, the market is nothing more than a game of probability, statistics and pure mathematics.
Like a casino!
What happens is that most traders, whenever they take a position, take it with all the empirical certainty that such position will win or lose, and do not take into consideration the total sequence of results to understand their place in the market.
Understanding your place in the market gives you the ability to create and design systems that can exploit the present market anomaly, and thus make money statistically, consistently, and 100% automated.
Thinking of it this way, it is easy to make money from the market.
There are many ways to make money from the market, but the only consistent way I know of is through 'probabilistic and automated statistical trading'.
1️⃣1️⃣ : ❓ How to build a Quantitative Trading system ❓
There are some fundamental points that must be addressed here in order to understand what makes up a system based on statistics and probability applied to a quantitative model.
When we talk about 'discretionary' trading, it is a trading system based on human decisions after the defined 'empirical' conditions are met.
It is quite another thing to build a fully automated system without any human interference/interaction .
That said:
Building a statistically profitable system is perfectly possible, but this is a high level task , but with possible high rewards and consistent gains.
Here you will find a real "Skin In The Game" strategy.
With all due respect, but the vast majority of traders who post strategies on TradingView do not understand what they are doing.
Most of them do not understand the minimum complexity involved in the main variable for the construction of a real strategy, the mother variable: "strategy".
I say this by my own experience, because I have analyzed practically all the existing publications of TradingView + 200,000 indicators and strategies.
I breathe pinescript, I eat pinescript, I sleep pinescript, I bathe pinescript, I live TradingView.
But the main advantage for the TradingView users, is that all entry and exit orders made by this strategy can be checked and analyzed thoroughly, to validate and prove the veracity of this strategy, because this is a 100% real strategy.
Here there is a huge world of possibilities, but only one way to build a 'pinescript strategy' that will work correctly aligned to the real world with real results .
There are some fundamental points to take into consideration when building a profitable trading system:
The most important of these for me is: 'DrawDown' .
Followed by: 'Hit Rate' .
And only after that we use the parameter: 'Profit'.
See, this is because here, we are dealing with the 'imponderable' , and anything can happen in this scenario.
But there is one thing that makes us sleep peacefully at night, and that is: controlling losses .
That is, in other words: controlling the DrawDown .
The amateur is concerned with 'winning', the professional is concerned with conserving capital.
If we have the losses under control, then we can move on to the other two parameters: hit rate and profit.
See, the second most important factor in building a system is the hit rate.
I say this from my own experience.
I have worked with many systems with a 'low hit rate', but extremely profitable.
For example: systems with hit rates of 40 to 50%.
But as much as statistically and mathematically the profit is rewarding, operating systems with a low hit rate is always very stressful psychologically.
That's why there are two big reasons why when I build an automated trading system, I focus on the high hit rate of the system, they are
1 - To reduce psychological damage as much as possible .
2 - And more important , when we create a system with a 'high hit rate' , there is a huge intrinsic advantage here, that most statistic traders don't take in consideration.
That is: knowing more quickly when the system stops being functional.
The main advantage of a system with a high hit rate is: to identify when the system stops being functional and stop exploiting the market's anomaly.
Look: When we are talking about trading and random distribution of results on the market, do you agree that when we create a trading system, we are focused on exploring some anomaly of that market?
When that anomaly is verified by the market, it will stop being functional with time.
That's why trading systems, 'scalpers', especially for cryptocurrencies, need constant monitoring, quarterly, semi-annually or annually.
Because market movements change from time to time.
Because we go through different cycles from time to time, such as congestion cycles, accumulation , distribution , volatility , uptrends and downtrends .
1️⃣2️⃣ : ❓ How to Exploit Market Anomalies ❓
You see there is a very important point that must be stressed here.
As we are always trying to exploit an 'anomaly' in the market.
So the 'number' of indicators/tools that will integrate the system is of paramount importance.
But most traders do not take this into consideration.
To build a professional, robust, consistent, and profitable system, you don't need to use hundreds of indicators to build your setup.
This will actually make it harder to read when the setup stops working and needs some adjustment.
So focusing on a high hit rate is very important here, this is a fundamental principle that is widely ignored , and with a high hit rate, we can know much more accurately when the system is no longer functional much faster.
As Darwin said: "It is not the strongest or the most intelligent that wins the game of life, it is the most adapted.
So simple systems, as contradictory as it may seem, are more efficient, because they help to identify inflection points in the market much more quickly.
1️⃣3️⃣ : ❓ What Defines a Robust, Profitable and Consistent System ❓
See I have built, hundreds of thousands of indicators and 'pinescript' strategies, hundreds of thousands.
This is an extremely professional, robust and profitable system.
Based on the currency pairs: BTC /USDT
There are many ways and avenues to build a profitable trading setup/system.
And actually this is not a difficult task, taking in consideration, as the main factor here, that our trading and investment plan is for the long term, so consequently we will face scenarios with less noise.
He who is in a hurry eats raw.
As mentioned before.
Defining trends in pinescript is technically a simple task, the hardest task is to determine congestion zones with low volume and volatility, it's in these moments that many false signals are generated, and consequently is where most setups face their maximum DrawDown.
That's why this strategy was strictly and thoroughly planned, built on a very solid foundation, to avoid as much noise as possible, for a positive and consistent equity curve in each market cycle, 'Consistency' is our 'Mantra' around here.
1️⃣4️⃣ : 🔧 Fixed Technical
• Strategy: Titan Investments|Quantitative THEMIS|Pro|BINANCE:BTCUSDTP:4h
• Pair: BTC/USDTP
• Time Frame: 4 hours
• Broker: Binance (Recommended)
For a more conservative scenario, we have built the Quantitative THEMIS for the 4h time frame, with the main focus on consistency.
So we can avoid noise as much as possible!
1️⃣5️⃣ : ❌ Fixed Outputs : 🎯 TP(%) & 🛑SL(%)
In order to build a 'perpetual' system specific to BTC/USDT, it took a lot of testing, and more testing, and a lot of investment and research.
There is one initial and fundamental point that we can address to justify the incredible consistency presented here.
That fundamental point is our exit via Take Profit or Stop Loss percentage (%).
🎯 Take Profit (%)
🛑 Stop Loss (%)
See, today I have been testing some more advanced backtesting models for some cryptocurrency systems.
In which I perform 'backtest of backtest', i.e. we use a set of strategies each focused on a principle, operating individually, but they are part of something unique, i.e. we do 'backtests' of 'backtests' together.
What I mean is that we do a lot of backtesting around here.
I can assure you, that always the best output for a trading system is to set fixed output values!
In other words:
🎯 Take Profit (%)
🛑 Stop Loss (%)
This happens because statistically setting fixed exit structures in the vast majority of times, presents a superior result on the capital/equity curve, throughout history and for the vast majority of setups compared to other exit methods.
This is due to a mathematical principle of simplicity, 'avoiding more noise'.
Thus whenever the Quantitative THEMIS strategy takes a position it has a target and a defined maximum stop percentage.
1️⃣6️⃣ : ⚠️ Risk Profile
The strategy, currently has 3 risk profiles ⚠️ patterns for 'fixed percentage exits': Take Profit (%) and Stop Loss (%) .
They are: ⚠️ Rich's Profiles
✔️🆑 Conservative: 🎯 TP=2.7 % 🛑 SL=2.7 %
❌Ⓜ️ Moderate: 🎯 TP=2.8 % 🛑 SL=2.7 %
❌🅰 Aggressive: 🎯 TP=1.6 % 🛑 SL=6.9 %
You will be able to select and switch between the above options and profiles through the 'input' menu of the strategy by navigating to the "⚠️ Risk Profile" menu.
You can then select, test and apply the Risk Profile above that best suits your risk management, expectations and reality , as well as customize all the 'fixed exit' values through the TP and SL menus below.
1️⃣7️⃣ : ⭕ Moving Exits : (Indicators)
The strategy currently also has 'Moving Exits' based on indicator signals.
These are Moving Exits (Indicators)
📈 LONG : (EXIT)
🧃 (MAO) Short : true
📉 SHORT : (EXIT)
🧃 (MAO) Long: false
You can select and toggle between the above options through the 'input' menu of the strategy by navigating to the "LONG : Exit" and "SHORT : Exit" menu.
1️⃣8️⃣ : 💸 Initial Capital
By default the "Initial Capital" set for entries and backtests of this strategy is: 10000 $
You can set another value for the 'Starting Capital' through the tradingview menu under "properties" , and edit the value of the "Initial Capital" field.
This way you can set and test other 'Entry Values' for your trades, tests and backtests.
1️⃣9️⃣ : ⚙️ Entry Options
By default the 'order size' set for this strategy is 100 % of the 'initial capital' on each new trade.
You can set and test other entry options like : contracts , cash , % of equity
You should make these changes directly in the input menu of the strategy by navigating to the menu "⚙️ Properties : TradingView" below.
⚙️ Properties : (TradingView)
📊 Strategy Type: strategy.position_size != 1
📝💲 % Order Type: % of equity
📝💲 % Order Size: 100
Leverage: 1
So you can define and test other 'Entry Options' for your trades, tests and backtests.
2️⃣0️⃣ : ❓ How to Automate this Strategy ❓ : 🤖 Automation : 'Third-Party Services'
It is possible to automate the signals of this strategy for any centralized or decentralized broker, as well as for messaging services: Discord, Telegram and Twitter.
All in an extremely simple and uncomplicated way through the tutorials available in PDF /VIDEO for our Titan Pro 👽 subscriber community.
With our tutorials in PDF and Video it will be possible to automate the signals of this strategy for the chosen service in an extremely simple way with less than 10 steps only.
Tradingview naturally doesn't count with native integration between brokers and tradingview.
But it is possible to use 'third party services' to do the integration and automation between Tradingview and your centralized or decentralized broker.
Here are the standard, available and recommended 'third party services' to automate the signals from the 'Quantitative THEMIS' strategy on the tradingview for your broker:
1) Wundertrading (Recommended):
2) 3commas:
3) Zignaly:
4) Aleeert.com (Recommended):
5) Alertatron:
Note! 'Third party services' cannot perform 'withdrawals' via their key 'API', they can only open positions, so your funds will always be 'safe' in your brokerage firm, being traded via the 'API', when they receive an entry and exit signal from this strategy.
2️⃣1️⃣ : ❓ How to Automate this Strategy ❓ : 🤖 Automation : 'Exchanges
You can automate this strategy for any of the brokers below, through your broker's 'API' by connecting it to the 'third party automation services' for tradingview available and mentioned in the menu above:
1) Binance (Recommended)
2) Bitmex
3) Bybit
4) KuCoin
5) Deribit
6) OKX
7) Coinbase
8) Huobi
9) Bitfinex
10) Bitget
11) Bittrex
12) Bitstamp
13) Gate. io
14) Kraken
15) Gemini
16) Ascendex
17) VCCE
2️⃣2️⃣ : ❓ How to Automate this Strategy ❓ : 🤖 Automation : 'Messaging Services'
You can also automate and monitor the signals of this strategy much more efficiently by sending them to the following popular messaging services:
1) Discord
2) Telegram
3) Twitter
2️⃣3️⃣ : ❓ How to Automate this Strategy ❓ : 🤖 Automation : '🧲🤖Copy-Trading'
It will also be possible to copy/replicate the entries and exits of this strategy to your broker in an extremely simple and agile way, through the available copy-trader services.
This way it will be possible to replicate the signals of this strategy at each entry and exit to your broker through the API connecting it to the integrated copy-trader services available through the tradingview automation services below:
1) Wundetrading:
2) Zignaly:
2️⃣4️⃣ : ❔ Why be a Titan Pro 👽❔
I believe that today I am at another level in 'pinescript' development.
I consider myself today a true unicorn as a pinescript developer, someone unique and very rare.
If you choose another tool or another pinescript service, this tool will be just another one, with no real results.
But if you join our Titan community, you will have access to a unique tool! And you will get real results!
I already earn money consistently with statistical and automated trading and as an expert pinescript developer.
I am here to evolve my skills as much as possible, and one day become a pinescript 'Wizard'.
So excellence, quality and professionalism will always be my north here.
You will never find a developer like me, and who will take so seriously such a revolutionary project as this one. A Maverick! ▬ The man never stops!
Here you will find the highest degree of sophistication and development in the market for 'pinescript'.
You will get the best of me and the best of pinescript possible.
Let me show you how a professional in my field does it.
Become a Titan Pro Member 👽 and get Full Access to this strategy and all the Automation Tutorials.
Be the Titan in your life!
2️⃣5️⃣ : ❔ Why be a Titan Aff 🛸❔
Get financial return for your referrals, Decentralize the World, and raise the collective consciousness.
2️⃣6️⃣ : 📋 Summary : ⚖️ Strategy: Titan Investments|Quantitative THEMIS|Pro|BINANCE:BTCUSDTP:4h
® Titan Investimentos | Quantitative THEMIS ⚖️ | Pro 👽 2.6 | Dev: © FilipeSoh 🧙 | 🤖 100% Automated : Discord, Telegram, Twitter, Wundertrading, 3commas, Zignaly, Aleeert, Alertatron, Uniswap-v3 | BINANCE:BTCUSDTPERP 4h
🛒 Subscribe this strategy ❗️ Be a Titan Member 🏛️
🛒 Titan Pro 👽 🏛️ Titan Pro 👽 Version with ✔️100% Integrated Automation 🤖 and 📚 Automation Tutorials ✔️100% available at: (PDF/VIDEO)
🛒 Titan Affiliate 🛸 🏛️ Titan Affiliate 🛸 (Subscription Sale) 🔥 Receive 50% commission
📋 Summary : QT THEMIS ⚖️
🕵️♂️ Check This Strategy..................................................................0
🦄 ® Titan Investimentos...............................................................1
👨💻 © Developer..........................................................................2
📚 Signal Automation Tutorials : (PDF/VIDEO).......................................3
👨🔧 Revision...............................................................................4
📊 Table : (BACKTEST)..................................................................5
📊 Table : (INFORMATIONS).............................................................6
⚙️ Properties : (TRADINGVIEW)........................................................7
📆 Backtest : (TRADINGVIEW)..........................................................8
⚠️ Risk Profile...........................................................................9
🟢 On 🔴 Off : (LONG/SHORT).......................................................10
📈 LONG : (ENTRY)....................................................................11
📉 SHORT : (ENTRY)...................................................................12
📈 LONG : (EXIT).......................................................................13
📉 SHORT : (EXIT)......................................................................14
🧩 (EI) External Indicator.............................................................15
📡 (QT) Quantitative...................................................................16
🎠 (FF) Forecast......................................................................17
🅱 (BB) Bollinger Bands................................................................18
🧃 (MAP) Moving Average Primary......................................................19
🧃 (MAP) Labels.........................................................................20
🍔 (MAQ) Moving Average Quaternary.................................................21
🍟 (MACD) Moving Average Convergence Divergence...............................22
📣 (VWAP) Volume Weighted Average Price........................................23
🪀 (HL) HILO..........................................................................24
🅾 (OBV) On Balance Volume.........................................................25
🥊 (SAR) Stop and Reverse...........................................................26
🛡️ (DSR) Dynamic Support and Resistance..........................................27
🔊 (VD) Volume Directional..........................................................28
🧰 (RSI) Relative Momentum Index.................................................29
🎯 (TP) Take Profit %..................................................................30
🛑 (SL) Stop Loss %....................................................................31
🤖 Automation Selected...............................................................32
📱💻 Discord............................................................................33
📱💻 Telegram..........................................................................34
📱💻 Twitter...........................................................................35
🤖 Wundertrading......................................................................36
🤖 3commas............................................................................37
🤖 Zignaly...............................................................................38
🤖 Aleeert...............................................................................39
🤖 Alertatron...........................................................................40
🤖 Uniswap-v3..........................................................................41
🧲🤖 Copy-Trading....................................................................42
♻️ ® No Repaint........................................................................43
🔒 Copyright ©️..........................................................................44
🏛️ Be a Titan Member..................................................................45
Nº Active Users..........................................................................46
⏱ Time Left............................................................................47
| 0 | 🕵️♂️ Check This Strategy
🕵️♂️ Version Demo: 🐄 Version with ❌non-integrated automation 🤖 and 📚 Tutorials for automation ❌not available
🕵️♂️ Version Pro: 👽 Version with ✔️100% Integrated Automation 🤖 and 📚 Automation Tutorials ✔️100% available at: (PDF/VIDEO)
| 1 | 🦄 ® Titan Investimentos
Decentralizing the World 🗺
Raising the Collective Conscience 🗺
🦄Site:
🦄TradingView: www.tradingview.com
🦄Discord:
🦄Telegram:
🦄Youtube:
🦄Twitter:
🦄Instagram:
🦄TikTok:
🦄Linkedin:
🦄E-mail:
| 2 | 👨💻 © Developer
🧠 Developer: @FilipeSoh🧙
📺 TradingView: www.tradingview.com
☑️ Linkedin:
✅ Fiverr:
✅ Upwork:
🎥 YouTube:
🐤 Twitter:
🤳 Instagram:
| 3 | 📚 Signal Automation Tutorials : (PDF/VIDEO)
📚 Discord: 🔗 Link: 🔒Titan Pro👽
📚 Telegram: 🔗 Link: 🔒Titan Pro👽
📚 Twitter: 🔗 Link: 🔒Titan Pro👽
📚 Wundertrading: 🔗 Link: 🔒Titan Pro👽
📚 3comnas: 🔗 Link: 🔒Titan Pro👽
📚 Zignaly: 🔗 Link: 🔒Titan Pro👽
📚 Aleeert: 🔗 Link: 🔒Titan Pro👽
📚 Alertatron: 🔗 Link: 🔒Titan Pro👽
📚 Uniswap-v3: 🔗 Link: 🔒Titan Pro👽
📚 Copy-Trading: 🔗 Link: 🔒Titan Pro👽
| 4 | 👨🔧 Revision
👨🔧 Start Of Operations: 01 Jan 2019 21:00 -0300 💡 Start Of Operations (Skin in the game) : Revision 1.0
👨🔧 Previous Review: 01 Jan 2022 21:00 -0300 💡 Previous Review : Revision 2.0
👨🔧 Current Revision: 01 Jan 2023 21:00 -0300 💡 Current Revision : Revision 2.6
👨🔧 Next Revision: 28 May 2023 21:00 -0300 💡 Next Revision : Revision 2.7
| 5 | 📊 Table : (BACKTEST)
📊 Table: true
🖌️ Style: label.style_label_left
📐 Size: size_small
📏 Line: defval
🎨 Color: #131722
| 6 | 📊 Table : (INFORMATIONS)
📊 Table: false
🖌️ Style: label.style_label_right
📐 Size: size_small
📏 Line: defval
🎨 Color: #131722
| 7 | ⚙️ Properties : (TradingView)
📊 Strategy Type: strategy.position_size != 1
📝💲 % Order Type: % of equity
📝💲 % Order Size: 100 %
🚀 Leverage: 1
| 8 | 📆 Backtest : (TradingView)
🗓️ Mon: true
🗓️ Tue: true
🗓️ Wed: true
🗓️ Thu: true
🗓️ Fri: true
🗓️ Sat: true
🗓️ Sun: true
📆 Range: custom
📆 Start: UTC 31 Oct 2008 00:00
📆 End: UTC 31 Oct 2030 23:45
📆 Session: 0000-0000
📆 UTC: UTC
| 9 | ⚠️ Risk Profile
✔️🆑 Conservative: 🎯 TP=2.7 % 🛑 SL=2.7 %
❌Ⓜ️ Moderate: 🎯 TP=2.8 % 🛑 SL=2.7 %
❌🅰 Aggressive: 🎯 TP=1.6 % 🛑 SL=6.9 %
| 10 | 🟢 On 🔴 Off : (LONG/SHORT)
🟢📈 LONG: true
🟢📉 SHORT: true
| 11 | 📈 LONG : (ENTRY)
📡 (QT) Long: true
🧃 (MAP) Long: false
🅱 (BB) Long: false
🍟 (MACD) Long: false
🅾 (OBV) Long: false
| 12 | 📉 SHORT : (ENTRY)
📡 (QT) Short: true
🧃 (MAP) Short: false
🅱 (BB) Short: false
🍟 (MACD) Short: false
🅾 (OBV) Short: false
| 13 | 📈 LONG : (EXIT)
🧃 (MAP) Short: true
| 14 | 📉 SHORT : (EXIT)
🧃 (MAP) Long: false
| 15 | 🧩 (EI) External Indicator
🧩 (EI) Connect your external indicator/filter: false
🧩 (EI) Connect your indicator here (Study mode only): close
🧩 (EI) Connect your indicator here (Study mode only): close
| 16 | 📡 (QT) Quantitative
📡 (QT) Quantitative: true
📡 (QT) Market: BINANCE:BTCUSDTPERP
📡 (QT) Dice: openai
| 17 | 🎠 (FF) Forecast
🎠 (FF) Include current unclosed current candle: true
🎠 (FF) Forecast Type: flat
🎠 (FF) Nº of candles to use in linear regression: 3
| 18 | 🅱 (BB) Bollinger Bands
🅱 (BB) Bollinger Bands: true
🅱 (BB) Type: EMA
🅱 (BB) Period: 20
🅱 (BB) Source: close
🅱 (BB) Multiplier: 2
🅱 (BB) Linewidth: 0
🅱 (BB) Color: #131722
| 19 | 🧃 (MAP) Moving Average Primary
🧃 (MAP) Moving Average Primary: true
🧃 (MAP) BarColor: false
🧃 (MAP) Background: false
🧃 (MAP) Type: SMA
🧃 (MAP) Source: open
🧃 (MAP) Period: 100
🧃 (MAP) Multiplier: 2.0
🧃 (MAP) Linewidth: 2
🧃 (MAP) Color P: #42bda8
🧃 (MAP) Color N: #801922
| 20 | 🧃 (MAP) Labels
🧃 (MAP) Labels: true
🧃 (MAP) Style BUY ZONE: shape.labelup
🧃 (MAP) Color BUY ZONE: #42bda8
🧃 (MAP) Style SELL ZONE: shape.labeldown
🧃 (MAP) Color SELL ZONE: #801922
| 21 | 🍔 (MAQ) Moving Average Quaternary
🍔 (MAQ) Moving Average Quaternary: true
🍔 (MAQ) BarColor: false
🍔 (MAQ) Background: false
🍔 (MAQ) Type: SMA
🍔 (MAQ) Source: close
🍔 (MAQ) Primary: 14
🍔 (MAQ) Secondary: 22
🍔 (MAQ) Tertiary: 44
🍔 (MAQ) Quaternary: 16
🍔 (MAQ) Linewidth: 0
🍔 (MAQ) Color P: #42bda8
🍔 (MAQ) Color N: #801922
| 22 | 🍟 (MACD) Moving Average Convergence Divergence
🍟 (MACD) Macd Type: EMA
🍟 (MACD) Signal Type: EMA
🍟 (MACD) Source: close
🍟 (MACD) Fast: 12
🍟 (MACD) Slow: 26
🍟 (MACD) Smoothing: 9
| 23 | 📣 (VWAP) Volume Weighted Average Price
📣 (VWAP) Source: close
📣 (VWAP) Period: 340
📣 (VWAP) Momentum A: 84
📣 (VWAP) Momentum B: 150
📣 (VWAP) Average Volume: 1
📣 (VWAP) Multiplier: 1
📣 (VWAP) Diviser: 2
| 24 | 🪀 (HL) HILO
🪀 (HL) Type: SMA
🪀 (HL) Function: Maverick🧙
🪀 (HL) Source H: high
🪀 (HL) Source L: low
🪀 (HL) Period: 20
🪀 (HL) Momentum: 26
🪀 (HL) Diviser: 2
🪀 (HL) Multiplier: 1
| 25 | 🅾 (OBV) On Balance Volume
🅾 (OBV) Type: EMA
🅾 (OBV) Source: close
🅾 (OBV) Period: 16
🅾 (OBV) Diviser: 2
🅾 (OBV) Multiplier: 1
| 26 | 🥊 (SAR) Stop and Reverse
🥊 (SAR) Source: close
🥊 (SAR) High: 1.8
🥊 (SAR) Mid: 1.6
🥊 (SAR) Low: 1.6
🥊 (SAR) Diviser: 2
🥊 (SAR) Multiplier: 1
| 27 | 🛡️ (DSR) Dynamic Support and Resistance
🛡️ (DSR) Source D: close
🛡️ (DSR) Source R: high
🛡️ (DSR) Source S: low
🛡️ (DSR) Momentum R: 0
🛡️ (DSR) Momentum S: 2
🛡️ (DSR) Diviser: 2
🛡️ (DSR) Multiplier: 1
| 28 | 🔊 (VD) Volume Directional
🔊 (VD) Type: SMA
🔊 (VD) Period: 68
🔊 (VD) Momentum: 3.8
🔊 (VD) Diviser: 2
🔊 (VD) Multiplier: 1
| 29 | 🧰 (RSI) Relative Momentum Index
🧰 (RSI) Type UP: EMA
🧰 (RSI) Type DOWN: EMA
🧰 (RSI) Source: close
🧰 (RSI) Period: 29
🧰 (RSI) Smoothing: 22
🧰 (RSI) Momentum R: 64
🧰 (RSI) Momentum S: 142
🧰 (RSI) Diviser: 2
🧰 (RSI) Multiplier: 1
| 30 | 🎯 (TP) Take Profit %
🎯 (TP) Take Profit: false
🎯 (TP) %: 2.2
🎯 (TP) Color: #42bda8
🎯 (TP) Linewidth: 1
| 31 | 🛑 (SL) Stop Loss %
🛑 (SL) Stop Loss: false
🛑 (SL) %: 2.7
🛑 (SL) Color: #801922
🛑 (SL) Linewidth: 1
| 32 | 🤖 Automation : Discord | Telegram | Twitter | Wundertrading | 3commas | Zignaly | Aleeert | Alertatron | Uniswap-v3
🤖 Automation Selected : Discord
| 33 | 🤖 Discord
🔗 Link Discord: discord.com
🔗 Link 📚 Automation: 🔒Titan Pro👽
📱💻 Discord ▬ Enter Long: 🔒Titan Pro👽
📱💻 Discord ▬ Exit Long: 🔒Titan Pro👽
📱💻 Discord ▬ Enter Short: 🔒Titan Pro👽
📱💻 Discord ▬ Exit Short: 🔒Titan Pro👽
| 34 | 🤖 Telegram
🔗 Link Telegram: telegram.org
🔗 Link 📚 Automation: 🔒Titan Pro👽
📱💻 Telegram ▬ Enter Long: 🔒Titan Pro👽
📱💻 Telegram ▬ Exit Long: 🔒Titan Pro👽
📱💻 Telegram ▬ Enter Short: 🔒Titan Pro👽
📱💻 Telegram ▬ Exit Short: 🔒Titan Pro👽
| 35 | 🤖 Twitter
🔗 Link Twitter: twitter.com
🔗 Link 📚 Automation: 🔒Titan Pro👽
📱💻 Twitter ▬ Enter Long: 🔒Titan Pro👽
📱💻 Twitter ▬ Exit Long: 🔒Titan Pro👽
📱💻 Twitter ▬ Enter Short: 🔒Titan Pro👽
📱💻 Twitter ▬ Exit Short: 🔒Titan Pro👽
| 36 | 🤖 Wundertrading : Binance | Bitmex | Bybit | KuCoin | Deribit | OKX | Coinbase | Huobi | Bitfinex | Bitget
🔗 Link Wundertrading: wundertrading.com
🔗 Link 📚 Automation: 🔒Titan Pro👽
📱💻 Wundertrading ▬ Enter Long: 🔒Titan Pro👽
📱💻 Wundertrading ▬ Exit Long: 🔒Titan Pro👽
📱💻 Wundertrading ▬ Enter Short: 🔒Titan Pro👽
📱💻 Wundertrading ▬ Exit Short: 🔒Titan Pro👽
| 37 | 🤖 3commas : Binance | Bybit | OKX | Bitfinex | Coinbase | Deribit | Bitmex | Bittrex | Bitstamp | Gate.io | Kraken | Gemini | Huobi | KuCoin
🔗 Link 3commas: 3commas.io
🔗 Link 📚 Automation: 🔒Titan Pro👽
📱💻 3commas ▬ Enter Long: 🔒Titan Pro👽
📱💻 3commas ▬ Exit Long: 🔒Titan Pro👽
📱💻 3commas ▬ Enter Short: 🔒Titan Pro👽
📱💻 3commas ▬ Exit Short: 🔒Titan Pro👽
| 38 | 🤖 Zignaly : Binance | Ascendex | Bitmex | Kucoin | VCCE
🔗 Link Zignaly: zignaly.com
🔗 Link 📚 Automation: 🔒Titan Pro👽
🤖 Type Automation: Profit Sharing
🤖 Type Provider: Webook
🔑 Key: 🔒Titan Pro👽
🤖 pair: BTCUSDTP
🤖 exchange: binance
🤖 exchangeAccountType: futures
🤖 orderType: market
🚀 leverage: 1x
% positionSizePercentage: 100 %
💸 positionSizeQuote: 10000 $
🆔 signalId: @Signal1234
| 39 | 🤖 Aleeert : Binance
🔗 Link Aleeert: aleeert.com
🔗 Link 📚 Automation: 🔒Titan Pro👽
📱💻 Aleeert ▬ Enter Long: 🔒Titan Pro👽
📱💻 Aleeert ▬ Exit Long: 🔒Titan Pro👽
📱💻 Aleeert ▬ Enter Short: 🔒Titan Pro👽
📱💻 Aleeert ▬ Exit Short: 🔒Titan Pro👽
| 40 | 🤖 Alertatron : Binance | Bybit | Deribit | Bitmex
🔗 Link Alertatron: alertatron.com
🔗 Link 📚 Automation: 🔒Titan Pro👽
📱💻 Alertatron ▬ Enter Long: 🔒Titan Pro👽
📱💻 Alertatron ▬ Exit Long: 🔒Titan Pro👽
📱💻 Alertatron ▬ Enter Short: 🔒Titan Pro👽
📱💻 Alertatron ▬ Exit Short: 🔒Titan Pro👽
| 41 | 🤖 Uniswap-v3
🔗 Link Alertatron: uniswap.org
🔗 Link 📚 Automation: 🔒Titan Pro👽
📱💻 Uniswap-v3 ▬ Enter Long: 🔒Titan Pro👽
📱💻 Uniswap-v3 ▬ Exit Long: 🔒Titan Pro👽
📱💻 Uniswap-v3 ▬ Enter Short: 🔒Titan Pro👽
📱💻 Uniswap-v3 ▬ Exit Short: 🔒Titan Pro👽
| 42 | 🧲🤖 Copy-Trading : Zignaly | Wundertrading
🔗 Link 📚 Copy-Trading: 🔒Titan Pro👽
🧲🤖 Copy-Trading ▬ Zignaly: 🔒Titan Pro👽
🧲🤖 Copy-Trading ▬ Wundertrading: 🔒Titan Pro👽
| 43 | ♻️ ® Don't Repaint!
♻️ This Strategy does not Repaint!: ® Signs Do not repaint❕
♻️ This is a Real Strategy!: Quality : ® Titan Investimentos
📋️️ Get more information about Repainting here:
| 44 | 🔒 Copyright ©️
🔒 Copyright ©️: Copyright © 2023-2024 All rights reserved, ® Titan Investimentos
🔒 Copyright ©️: ® Titan Investimentos
🔒 Copyright ©️: Unique and Exclusive Strategy. All rights reserved
| 45 | 🏛️ Be a Titan Members
🏛️ Titan Pro 👽 Version with ✔️100% Integrated Automation 🤖 and 📚 Automation Tutorials ✔️100% available at: (PDF/VIDEO)
🏛️ Titan Affiliate 🛸 (Subscription Sale) 🔥 Receive 50% commission
| 46 | ⏱ Time Left
Time Left Titan Demo 🐄: ⏱♾ | ⏱ : ♾ Titan Demo 🐄 Version with ❌non-integrated automation 🤖 and 📚 Tutorials for automation ❌not available
Time Left Titan Pro 👽: 🔒Titan Pro👽 | ⏱ : Pro Plans: 30 Days, 90 Days, 12 Months, 24 Months. (👽 Pro 🅼 Monthly, 👽 Pro 🆀 Quarterly, 👽 Pro🅰 Annual, 👽 Pro👾Two Years)
| 47 | Nº Active Users
Nº Active Subscribers Titan Pro 👽: 5️⃣6️⃣ | 1✔️ 5✔️ 10✔️ 100❌ 1K❌ 10K❌ 50K❌ 100K❌ 1M❌ 10M❌ 100M❌ : ⏱ Active Users is updated every 24 hours (Check on indicator)
Nº Active Affiliates Titan Aff 🛸: 6️⃣ | 1✔️ 5✔️ 10❌ 100❌ 1K❌ 10K❌ 50K❌ 100K❌ 1M❌ 10M❌ 100M❌ : ⏱ Active Users is updated every 24 hours (Check on indicator)
2️⃣7️⃣ : 📊 PERFORMANCE : 🆑 Conservative
📊 Exchange: Binance
📊 Pair: BINANCE: BTCUSDTPERP
📊 TimeFrame: 4h
📊 Initial Capital: 10000 $
📊 Order Type: % equity
📊 Size Per Order: 100 %
📊 Commission: 0.03 %
📊 Pyramid: 1
• ⚠️ Risk Profile: 🆑 Conservative: 🎯 TP=2.7 % | 🛑 SL=2.7 %
• 📆All years: 🆑 Conservative: 🚀 Leverage 1️⃣x
📆 Start: September 23, 2019
📆 End: January 11, 2023
📅 Days: 1221
📅 Bars: 7325
Net Profit:
🟢 + 1669.89 %
💲 + 166989.43 USD
Total Close Trades:
⚪️ 369
Percent Profitable:
🟡 64.77 %
Profit Factor:
🟢 2.314
DrawDrown Maximum:
🔴 -24.82 %
💲 -10221.43 USD
Avg Trade:
💲 + 452.55 USD
✔️ Trades Winning: 239
❌ Trades Losing: 130
✔️ Average Gross Win: + 12.31 %
❌ Average Gross Loss: - 9.78 %
✔️ Maximum Consecutive Wins: 9
❌ Maximum Consecutive Losses: 6
% Average Gain Annual: 499.33 %
% Average Gain Monthly: 41.61 %
% Average Gain Weekly: 9.6 %
% Average Gain Day: 1.37 %
💲 Average Gain Annual: 49933 $
💲 Average Gain Monthly: 4161 $
💲 Average Gain Weekly: 960 $
💲 Average Gain Day: 137 $
• 📆 Year: 2020: 🆑 Conservative: 🚀 Leverage 1️⃣x
• 📆 Year: 2021: 🆑 Conservative: 🚀 Leverage 1️⃣x
• 📆 Year: 2022: 🆑 Conservative: 🚀 Leverage 1️⃣x
2️⃣8️⃣ : 📊 PERFORMANCE : Ⓜ️ Moderate
📊 Exchange: Binance
📊 Pair: BINANCE: BTCUSDTPERP
📊 TimeFrame: 4h
📊 Initial Capital: 10000 $
📊 Order Type: % equity
📊 Size Per Order: 100 %
📊 Commission: 0.03 %
📊 Pyramid: 1
• ⚠️ Risk Profile: Ⓜ️ Moderate: 🎯 TP=2.8 % | 🛑 SL=2.7 %
• 📆 All years: Ⓜ️ Moderate: 🚀 Leverage 1️⃣x
📆 Start: September 23, 2019
📆 End: January 11, 2023
📅 Days: 1221
📅 Bars: 7325
Net Profit:
🟢 + 1472.04 %
💲 + 147199.89 USD
Total Close Trades:
⚪️ 362
Percent Profitable:
🟡 63.26 %
Profit Factor:
🟢 2.192
DrawDrown Maximum:
🔴 -22.69 %
💲 -9269.33 USD
Avg Trade:
💲 + 406.63 USD
✔️ Trades Winning: 229
❌ Trades Losing : 133
✔️ Average Gross Win: + 11.82 %
❌ Average Gross Loss: - 9.29 %
✔️ Maximum Consecutive Wins: 9
❌ Maximum Consecutive Losses: 8
% Average Gain Annual: 440.15 %
% Average Gain Monthly: 36.68 %
% Average Gain Weekly: 8.46 %
% Average Gain Day: 1.21 %
💲 Average Gain Annual: 44015 $
💲 Average Gain Monthly: 3668 $
💲 Average Gain Weekly: 846 $
💲 Average Gain Day: 121 $
• 📆 Year: 2020: Ⓜ️ Moderate: 🚀 Leverage 1️⃣x
• 📆 Year: 2021: Ⓜ️ Moderate: 🚀 Leverage 1️⃣x
• 📆 Year: 2022: Ⓜ️ Moderate: 🚀 Leverage 1️⃣x
2️⃣9️⃣ : 📊 PERFORMANCE : 🅰 Aggressive
📊 Exchange: Binance
📊 Pair: BINANCE: BTCUSDTPERP
📊 TimeFrame: 4h
📊 Initial Capital: 10000 $
📊 Order Type: % equity
📊 Size Per Order: 100 %
📊 Commission: 0.03 %
📊 Pyramid: 1
• ⚠️ Risk Profile: 🅰 Aggressive: 🎯 TP=1.6 % | 🛑 SL=6.9 %
• 📆 All years: 🅰 Aggressive: 🚀 Leverage 1️⃣x
📆 Start: September 23, 2019
📆 End: January 11, 2023
📅 Days: 1221
📅 Bars: 7325
Net Profit:
🟢 + 989.38 %
💲 + 98938.38 USD
Total Close Trades:
⚪️ 380
Percent Profitable:
🟢 84.47 %
Profit Factor:
🟢 2.156
DrawDrown Maximum:
🔴 -17.88 %
💲 -9182.84 USD
Avg Trade:
💲 + 260.36 USD
✔️ Trades Winning: 321
❌ Trades Losing: 59
✔️ Average Gross Win: + 5.75 %
❌ Average Gross Loss: - 14.51 %
✔️ Maximum Consecutive Wins: 21
❌ Maximum Consecutive Losses: 6
% Average Gain Annual: 295.84 %
% Average Gain Monthly: 24.65 %
% Average Gain Weekly: 5.69 %
% Average Gain Day: 0.81 %
💲 Average Gain Annual: 29584 $
💲 Average Gain Monthly: 2465 $
💲 Average Gain Weekly: 569 $
💲 Average Gain Day: 81 $
• 📆 Year: 2020: 🅰 Aggressive: 🚀 Leverage 1️⃣x
• 📆 Year: 2021: 🅰 Aggressive: 🚀 Leverage 1️⃣x
• 📆 Year: 2022: 🅰 Aggressive: 🚀 Leverage 1️⃣x
3️⃣0️⃣ : 🛠️ Roadmap
🛠️• 14/ 01 /2023 : Titan THEMIS Launch
🛠️• Updates January/2023 :
• 📚 Tutorials for Automation 🤖 already Available : ✔️
• ✔️ Discord
• ✔️ Wundertrading
• ✔️ Zignaly
• 📚 Tutorials for Automation 🤖 In Preparation : ⭕
• ⭕ Telegram
• ⭕ Twitter
• ⭕ 3comnas
• ⭕ Aleeert
• ⭕ Alertatron
• ⭕ Uniswap-v3
• ⭕ Copy-Trading
🛠️• Updates February/2023 :
• 📰 Launch of advertising material for Titan Affiliates 🛸
• 🛍️🎥🖼️📊 (Sales Page/VSL/Videos/Creative/Infographics)
🛠️• 28/05/2023 : Titan THEMIS update ▬ Version 2.7
🛠️• 28/05/2023 : BOT BOB release ▬ Version 1.0
• (Native Titan THEMIS Automation - Through BOT BOB, a bot for automation of signals, indicators and strategies of TradingView, of own code ▬ in validation.
• BOT BOB
Automation/Connection :
• API - For Centralized Brokers.
• Smart Contracts - Wallet Web - For Decentralized Brokers.
• This way users can automate any indicator or strategy of TradingView and Titan in a decentralized, secure and simplified way.
• Without having the need to use 'third party services' for automating TradingView indicators and strategies like the ones available above.
🛠️• 28/05/2023 : Release ▬ Titan Culture Guide 📝
3️⃣1️⃣ : 🧻 Notes ❕
🧻 • Note ❕ The "Demo 🐄" version, ❌does not have 'integrated automation', to automate the signals of this strategy and enjoy a fully automated system, you need to have access to the Pro version with '100% integrated automation' and all the tutorials for automation available. Become a Titan Pro 👽
🧻 • Note ❕ You will also need to be a "Pro User or higher on Tradingview", to be able to use the webhook feature available only for 'paid' profiles on the platform.
With the webhook feature it is possible to send the signals of this strategy to almost anywhere, in our case to centralized or decentralized brokerages, also to popular messaging services such as: Discord, Telegram or Twiter.
3️⃣2️⃣ : 🚨 Disclaimer ❕❗
🚨 • Disclaimer ❕❕ Past positive result and performance of a system does not guarantee its positive result and performance for the future!
🚨 • Disclaimer ❗❗❗ When using this strategy: Titan Investments is totally Exempt from any claim of liability for losses. The responsibility on the management of your funds is solely yours. This is a very high risk/volatility market! Understand your place in the market.
3️⃣3️⃣ : ♻️ ® No Repaint
This Strategy does not Repaint! This is a real strategy!
3️⃣4️⃣ : 🔒 Copyright ©️
Copyright © 2022-2023 All rights reserved, ® Titan Investimentos
3️⃣5️⃣ : 👏 Acknowledgments
I want to start this message in thanks to TradingView and all the Pinescript community for all the 'magic' created here, a unique ecosystem! rich and healthy, a fertile soil, a 'new world' of possibilities, for a complete deepening and improvement of our best personal skills.
I leave here my immense thanks to the whole community: Tradingview, Pinecoders, Wizards and Moderators.
I was not born Rich .
Thanks to TradingView and pinescript and all its transformation.
I could develop myself and the best of me and the best of my skills.
And consequently build wealth and patrimony.
Gratitude.
One more story for the infinite book !
If you were born poor you were born to be rich !
Raising🔼 the level and raising🔼 the ruler! 📏
My work is my 'debauchery'! Do better! 💐🌹
Soul of a first-timer! Creativity Exudes! 🦄
This is the manifestation of God's magic in me. This is the best of me. 🧙
You will copy me, I know. So you owe me. 💋
My mission here is to raise the consciousness and self-esteem of all Titans and Titanids! Welcome! 🧘 🏛️
The only way to accomplish great work is to do what you love ! Before I learned to program I was wasting my life!
Death is the best creation of life .
Now you are the new , but in the not so distant future you will gradually become the old . Here I stay forever!
Playing the game like an Athlete! 🖼️ Enjoy and Enjoy 🍷 🗿
In honor of: BOB ☆
1 name, 3 letters, 3 possibilities, and if read backwards it's the same thing, a palindrome. ☘
Gratitude to the oracles that have enabled me the 'luck' to get this far: Dal&Ni&Fer
3️⃣6️⃣ : 👮 House Rules : 📺 TradingView
House Rules : This publication and strategy follows all TradingView house guidelines and rules:
📺 TradingView House Rules: www.tradingview.com
📺 Script publication rules: www.tradingview.com
📺 Vendor requirements: www.tradingview.com
📺 Links/References rules: www.tradingview.com
3️⃣7️⃣ : 🏛️ Become a Titan Pro member 👽
🟩 Titan Pro 👽 🟩
3️⃣8️⃣ : 🏛️ Be a member Titan Aff 🛸
🟥 Titan Affiliate 🛸 🟥

Titan Investments|Quantitative THEMIS|Demo|BINANCE:BTCUSDTP:4hInvestment Strategy (Quantitative Trading)
| 🛑 | Watch "LIVE" and 'COPY' this strategy in real time:
🔗 Link: www.tradingview.com
Hello, welcome, feel free 🌹💐
Since the stone age to the most technological age, one thing has not changed, that which continues impress human beings the most, is the other human being!
Deep down, it's all very simple or very complicated, depends on how you look at it.
I believe that everyone was born to do something very well in life.
But few are those who have, let's use the word 'luck' .
Few are those who have the 'luck' to discover this thing.
That is why few are happy and successful in their jobs and professions.
Thank God I had this 'luck' , and discovered what I was born to do well.
And I was born to program. 👨💻
📋 Summary : Project Titan
0️⃣ : 🦄 Project Titan
1️⃣ : ⚖️ Quantitative THEMIS
2️⃣ : 🏛️ Titan Community
3️⃣ : 👨💻 Who am I ❔
4️⃣ : ❓ What is Statistical/Probabilistic Trading ❓
5️⃣ : ❓ How Statistical/Probabilistic Trading works ❓
6️⃣ : ❓ Why use a Statistical/Probabilistic system ❓
7️⃣ : ❓ Why the human brain is not prepared to do Trading ❓
8️⃣ : ❓ What is Backtest ❓
9️⃣ : ❓ How to build a Consistent system ❓
🔟 : ❓ What is a Quantitative Trading system ❓
1️⃣1️⃣ : ❓ How to build a Quantitative Trading system ❓
1️⃣2️⃣ : ❓ How to Exploit Market Anomalies ❓
1️⃣3️⃣ : ❓ What Defines a Robust, Profitable and Consistent System ❓
1️⃣4️⃣ : 🔧 Fixed Technical
1️⃣5️⃣ : ❌ Fixed Outputs : 🎯 TP(%) & 🛑SL(%)
1️⃣6️⃣ : ⚠️ Risk Profile
1️⃣7️⃣ : ⭕ Moving Exits : (Indicators)
1️⃣8️⃣ : 💸 Initial Capital
1️⃣9️⃣ : ⚙️ Entry Options
2️⃣0️⃣ : ❓ How to Automate this Strategy ❓ : 🤖 Automation : 'Third-Party Services'
2️⃣1️⃣ : ❓ How to Automate this Strategy ❓ : 🤖 Automation : 'Exchanges
2️⃣2️⃣ : ❓ How to Automate this Strategy ❓ : 🤖 Automation : 'Messaging Services'
2️⃣3️⃣ : ❓ How to Automate this Strategy ❓ : 🤖 Automation : '🧲🤖Copy-Trading'
2️⃣4️⃣ : ❔ Why be a Titan Pro 👽❔
2️⃣5️⃣ : ❔ Why be a Titan Aff 🛸❔
2️⃣6️⃣ : 📋 Summary : ⚖️ Strategy: Titan Investments|Quantitative THEMIS|Demo|BINANCE:BTCUSDTP:4h
2️⃣7️⃣ : 📊 PERFORMANCE : 🆑 Conservative
2️⃣8️⃣ : 📊 PERFORMANCE : Ⓜ️ Moderate
2️⃣9️⃣ : 📊 PERFORMANCE : 🅰 Aggressive
3️⃣0️⃣ : 🛠️ Roadmap
3️⃣1️⃣ : 🧻 Notes ❕
3️⃣2️⃣ : 🚨 Disclaimer ❕❗
3️⃣3️⃣ : ♻️ ® No Repaint
3️⃣4️⃣ : 🔒 Copyright ©️
3️⃣5️⃣ : 👏 Acknowledgments
3️⃣6️⃣ : 👮 House Rules : 📺 TradingView
3️⃣7️⃣ : 🏛️ Become a Titan Pro member 👽
3️⃣8️⃣ : 🏛️ Be a member Titan Aff 🛸
0️⃣ : 🦄 Project Titan
This is the first real, 100% automated Quantitative Strategy made available to the public and the pinescript community for TradingView.
You will be able to automate all signals of this strategy for your broker , centralized or decentralized and also for messaging services : Discord, Telegram or Twitter .
This is the first strategy of a larger project, in 2023, I will provide a total of 6 100% automated 'Quantitative' strategies to the pinescript community for TradingView.
The future strategies to be shared here will also be unique , never before seen, real 'Quantitative' bots with real, validated results in real operation.
Just like the 'Quantitative THEMIS' strategy, it will be something out of the loop throughout the pinescript/tradingview community, truly unique tools for building mutual wealth consistently and continuously for our community.
1️⃣ : ⚖️ Quantitative THEMIS : Titan Investments|Quantitative THEMIS|Demo|BINANCE:BTCUSDTP:4h
This is a truly unique and out of the curve strategy for BTC /USD .
A truly real strategy, with real, validated results and in real operation.
A unique tool for building mutual wealth, consistently and continuously for the members of the Titan community.
Initially we will operate on a monthly, quarterly, annual or biennial subscription service.
Our goal here is to build a great community, in exchange for an extremely fair value for the use of our truly unique tools, which bring and will bring real results to our community members.
With this business model it will be possible to provide all Titan users and community members with the purest and highest degree of sophistication in the market with pinescript for tradingview, providing unique and truly profitable strategies.
My goal here is to offer the best to our members!
The best 'pinescript' tradingview service in the world!
We are the only Start-Up in the world that will decentralize real and full access to truly real 'quantitative' tools that bring and will bring real results for mutual and ongoing wealth building for our community.
2️⃣ : 🏛️ Titan Community : 👽 Pro 🔁 Aff 🛸
Become a Titan Pro 👽
To get access to the strategy: "Quantitative THEMIS" , and future Titan strategies in a 100% automated way, along with all tutorials for automation.
Pro Plans: 30 Days, 90 Days, 12 Months, 24 Months.
👽 Pro 🅼 Monthly
👽 Pro 🆀 Quarterly
👽 Pro🅰 Annual
👽 Pro👾Two Years
You will have access to a truly unique system that is out of the curve .
A 100% real, 100% automated, tested, validated, profitable, and in real operation strategy.
Become a Titan Affiliate 🛸
By becoming a Titan Affiliate 🛸, you will automatically receive 50% of the value of each new subscription you refer .
You will receive 50% for any of the above plans that you refer .
This way we will encourage our community to grow in a fair and healthy way, because we know what we have in our hands and what we deliver real value to our users.
We are at the highest level of sophistication in the market, the consistency here and the results here speak for themselves.
So growing our community means growing mutual wealth and raising collective conscience.
Wealth must be created not divided.
And here we are creating mutual wealth on all ends and in all ways.
A non-zero sum system, where everybody wins.
3️⃣ : 👨💻 Who am I ❔
My name is FilipeSoh I am 26 years old, Technical Analyst, Trader, Computer Engineer, pinescript Specialist, with extensive experience in several languages and technologies.
For the last 4 years I have been focusing on developing, editing and creating pinescript indicators and strategies for Tradingview for people and myself.
Full-time passionate workaholic pinescript developer with over 10,000 hours of pinescript development.
• Pinescript expert ▬Tradingview.
• Specialist in Automated Trading
• Specialist in Quantitative Trading.
• Statistical/Probabilistic Trading Specialist - Mark Douglas Scholl.
• Inventor of the 'Classic Forecast' Indicators.
• Inventor of the 'Backtest Table'.
4️⃣ : ❓ What is Statistical/Probabilistic Trading ❓
Statistical/probabilistic trading is the only way to get a positive mathematical expectation regarding the market and consequently that is the only way to make money consistently from it.
I will present below some more details about the Quantitative THEMIS strategy, it is a real strategy, tested, validated and in real operation, 'Skin in the Game' , a consistent way to make money with statistical/probabilistic trading in a 100% automated.
I am a Technical Analyst , I used to be a Discretionary Trader , today I am 100% a Statistical Trader .
I've gotten rich and made a lot of money, and I've also lost a lot with 'leverage'.
That was a few years ago.
The book that changed everything for me was "Trading in The Zone" by Mark Douglas.
That's when I understood that the market is just a game of statistics and probability, like a casino!
It was then that I understood that the human brain is not prepared for trading, because it involves triggers and mental emotions.
And emotions in trading and in making trading decisions do not go well together, not in the long run, because you always have the burden of being wrong with the outcome of that particular position.
But remembering that the market is just a statistical game!
5️⃣ : ❓ How Statistical/Probabilistic Trading works ❓
Let's use a 'coin' as an example:
If we toss a 'coin' up 10 times.
Do you agree that it is impossible for us to know exactly the result of the 'plays' before they actually happen?
As in the example above, would you agree, that we cannot "guess" the outcome of a position before it actually happens?
As much as we cannot "guess" whether the coin will drop heads or tails on each flip.
We can analyze the "backtest" of the 10 moves made with that coin:
If we analyze the 10 moves and count the number of times the coin fell heads or tails in a specific sequence, we then have a percentage of times the coin fell heads or tails, so we have a 'backtest' of those moves.
Then on the next flip we can now assume a point or a favorable position for one side, the side with the highest probability .
In a nutshell, this is more or less how probabilistic statistical trading works.
As Statistical Traders we can never say whether such a Trader/Position we take will be a winner or a loser.
But still we can have a positive and consistent result in a "sequence" of trades, because before we even open a position, backtests have already been performed so we identify an anomaly and build a system that will have a positive statistical advantage in our favor over the market.
The advantage will not be in one trade itself, but in the "sequence" of trades as a whole!
Because our system will work like a casino, having a positive mathematical expectation relative to the players/market.
Design, develop, test models and systems that can take advantage of market anomalies, until they change.
Be the casino! - Mark Douglas
6️⃣ : ❓ Why use a Statistical/Probabilistic system ❓
In recent years I have focused and specialized in developing 100% automated trading systems, essentially for the cryptocurrency market.
I have developed many extremely robust and efficient systems, with positive mathematical expectation towards the market.
These are not complex systems per se , because here we want to avoid 'over-optimization' as much as possible.
As Da Vinci said: "Simplicity is the highest degree of sophistication".
I say this because I have tested, tried and developed hundreds of systems/strategies.
I believe I have programmed more than 10,000 unique indicators/strategies, because this is my passion and purpose in life.
I am passionate about what I do, completely!
I love statistical trading because it is the only way to get consistency in the long run!
This is why I have studied, applied, developed, and specialized in 100% automated cryptocurrency trading systems.
The reason why our systems are extremely "simple" is because, as I mentioned before, in statistical trading we want to exploit the market anomaly to the maximum, that is, this anomaly will change from time to time, usually we can exploit a trading system efficiently for about 6 to 12 months, or for a few years, that is; for fixed 'scalpers' systems.
Because at some point these anomalies will be identified , and from the moment they are identified they will be exploited and will stop being anomalies .
With the system presented here; you can even copy the indicators and input values shared here;
However; what I have to offer you is: it is me , our team , and our community !
That is, we will constantly monitor this system, for life , because our goal here is to create a unique , perpetual , profitable , and consistent system for our community.
Myself , our team and our community will keep this script periodically updated , to ensure the positive mathematical expectation of it.
So we don't mind sharing the current parameters and values , because the real value is also in the future updates that this system will receive from me and our team , guided by our culture and our community of real users !
As we are hosted on 'tradingview', all future updates for this strategy, will be implemented and updated automatically on your tradingview account.
What we want here is: to make sure you get gains from our system, because if you get gains , our ecosystem will grow as a whole in a healthy and scalable way, so we will be generating continuous mutual wealth and raising the collective consciousness .
People Need People: 3️⃣🅿
7️⃣ : ❓ Why the human brain is not prepared to do Trading ❓
Today my greatest skill is to develop statistically profitable and 100% automated strategies for 'pinescript' tradingview.
Note that I said: 'profitable' because in fact statistical trading is the only way to make money in a 'consistent' way from the market.
And consequently have a positive wealth curve every cycle, because we will be based on mathematics, not on feelings and news.
Because the human brain is not prepared to do trading.
Because trading is connected to the decision making of the cerebral cortex.
And the decision making is automatically linked to emotions, and emotions don't match with trading decision making, because in those moments, we can feel the best and also the worst sensations and emotions, and this certainly affects us and makes us commit grotesque mistakes!
That's why the human brain is not prepared to do trading.
If you want to participate in a fully automated, profitable and consistent trading system; be a Titan Pro 👽
I believe we are walking an extremely enriching path here, not only in terms of financial returns for our community, but also in terms of knowledge about probabilistic and automated statistical trading.
You will have access to an extremely robust system, which was built upon very strong concepts and foundations, and upon the world's main asset in a few years: Bitcoin .
We are the tip of the best that exists in the cryptocurrency market when it comes to probabilistic and automated statistical trading.
Result is result! Me being dressed or naked.
This is just the beginning!
But there is a way to consistently make money from the market.
Being the Casino! - Mark Douglas
8️⃣ : ❓ What is Backtest ❓
Imagine the market as a purely random system, but even in 'randomness' there are patterns.
So now imagine the market and statistical trading as follows:
Repeating the above 'coin' example, let's think of it as follows:
If we toss a coin up 10 times again.
It is impossible to know which flips will have heads or tails, correct?
But if we analyze these 10 tosses, then we will have a mathematical statistic of the past result, for example, 70 % of the tosses fell 'heads'.
That is:
7 moves fell on "heads" .
3 moves fell on "tails" .
So based on these conditions and on the generic backtest presented here, we could adopt " heads " as our system of moves, to have a statistical and probabilistic advantage in relation to the next move to be performed.
That is, if you define a system, based on backtests , that has a robust positive mathematical expectation in relation to the market you will have a profitable system.
For every move you make you will have a positive statistical advantage in your favor over the market before you even make the move.
Like a casino in relation to all its players!
The casino does not have an advantage over one specific player, but over all players, because it has a positive mathematical expectation about all the moves that night.
The casino will always have a positive statistical advantage over its players.
Note that there will always be real players who will make real, million-dollar bankrolls that night, but this condition is already built into the casino's 'strategy', which has a pre-determined positive statistical advantage of that night as a whole.
Statistical trading is the same thing, as long as you don't understand this you will keep losing money and consistently.
9️⃣ : ❓ How to build a Consistent system ❓
See most traders around the world perform trades believing that that specific position taken will make them filthy rich, because they simply believe faithfully that the position taken will be an undoubted winner, based on a trader's methodology: 'trading a trade' without analyzing the whole context, just using 'empirical' aspects in their system.
But if you think of trading, as a sequence of moves.
You see, 'a sequence' !
When we think statistically, it doesn't matter your result for this , or for the next specific trade , but the final sequence of trades as a whole.
As the market has a random system of results distribution , if your system has a positive statistical advantage in relation to the market, at the end of that sequence you'll have the biggest probability of having a winning bank.
That's how you do real trading!
And with consistency!
Trading is a long term game, but when you change the key you realize that it is a simple game to make money in a consistent way from the market, all you need is patience.
Even more when we are based on Bitcoin, which has its 'Halving' effect where, in theory, we will never lose money in 3 to 4 years intervals, due to its scarcity and the fact that Bitcoin is the 'discovery of digital scarcity' which makes it the digital gold, we believe in this thesis and we follow Satoshi's legacy.
So align Bitcoin with a probabilistic statistical trading system with a positive mathematical expectation of the market and 100% automated with the long term, and all you need is patience, and you will become rich.
In fact Bitcoin by itself is already a path, buy, wait for each halving and your wealth will be maintained.
No inflation, unlike fiat currencies.
This is a complete and extremely robust strategy, with the most current possible and 'not possible' techniques involved and applied here.
Today I am at another level in developing 100% automated 'quantitative' strategies.
I was born for this!
🔟 : ❓ What is a Quantitative Trading system ❓
In addition to having access to a revolutionary strategy you will have access to disruptive 100% multifunctional tables with the ability to perform 'backtests' for better tracking and monitoring of your system on a customized basis.
I would like to emphasize one thing, and that is that you keep this in mind.
Today my greatest skill in 'pinescript' is to build indicators, but mainly strategies, based on statistical and probabilistic trading, with a postive mathematical expectation in relation to the market, in a 100% automated way.
This with the goal of building a consistent and continuous positive equity curve through mathematics using data, converting it into statistical / probabilistic parameters and applying them to a Quantitative model.
Before becoming a Quantitative Trader , I was a Technical Analyst and a Discretionary Trader .
First as a position trader and then as a day trader.
Before becoming a Trader, I trained myself as a Technical Analyst , to masterly understand the shape and workings of the market in theory.
But everything changed when I met 'Mark Douglas' , when I got to know his works, that's when my head exploded 🤯, and I started to understand the market for good!
The market is nothing more than a 'random' system of distributing results.
See that I said: 'random' .
Do yourself a mental exercise.
Is there really such a thing as random ?
I believe not, as far as we know maybe the 'singularity'.
So thinking this way, to translate, the market is nothing more than a game of probability, statistics and pure mathematics.
Like a casino!
What happens is that most traders, whenever they take a position, take it with all the empirical certainty that such position will win or lose, and do not take into consideration the total sequence of results to understand their place in the market.
Understanding your place in the market gives you the ability to create and design systems that can exploit the present market anomaly, and thus make money statistically, consistently, and 100% automated.
Thinking of it this way, it is easy to make money from the market.
There are many ways to make money from the market, but the only consistent way I know of is through 'probabilistic and automated statistical trading'.
1️⃣1️⃣ : ❓ How to build a Quantitative Trading system ❓
There are some fundamental points that must be addressed here in order to understand what makes up a system based on statistics and probability applied to a quantitative model.
When we talk about 'discretionary' trading, it is a trading system based on human decisions after the defined 'empirical' conditions are met.
It is quite another thing to build a fully automated system without any human interference/interaction .
That said:
Building a statistically profitable system is perfectly possible, but this is a high level task , but with possible high rewards and consistent gains.
Here you will find a real "Skin In The Game" strategy.
With all due respect, but the vast majority of traders who post strategies on TradingView do not understand what they are doing.
Most of them do not understand the minimum complexity involved in the main variable for the construction of a real strategy, the mother variable: "strategy".
I say this by my own experience, because I have analyzed practically all the existing publications of TradingView + 200,000 indicators and strategies.
I breathe pinescript, I eat pinescript, I sleep pinescript, I bathe pinescript, I live TradingView.
But the main advantage for the TradingView users, is that all entry and exit orders made by this strategy can be checked and analyzed thoroughly, to validate and prove the veracity of this strategy, because this is a 100% real strategy.
Here there is a huge world of possibilities, but only one way to build a 'pinescript strategy' that will work correctly aligned to the real world with real results .
There are some fundamental points to take into consideration when building a profitable trading system:
The most important of these for me is: 'DrawDown' .
Followed by: 'Hit Rate' .
And only after that we use the parameter: 'Profit'.
See, this is because here, we are dealing with the 'imponderable' , and anything can happen in this scenario.
But there is one thing that makes us sleep peacefully at night, and that is: controlling losses .
That is, in other words: controlling the DrawDown .
The amateur is concerned with 'winning', the professional is concerned with conserving capital.
If we have the losses under control, then we can move on to the other two parameters: hit rate and profit.
See, the second most important factor in building a system is the hit rate.
I say this from my own experience.
I have worked with many systems with a 'low hit rate', but extremely profitable.
For example: systems with hit rates of 40 to 50%.
But as much as statistically and mathematically the profit is rewarding, operating systems with a low hit rate is always very stressful psychologically.
That's why there are two big reasons why when I build an automated trading system, I focus on the high hit rate of the system, they are
1 - To reduce psychological damage as much as possible .
2 - And more important , when we create a system with a 'high hit rate' , there is a huge intrinsic advantage here, that most statistic traders don't take in consideration.
That is: knowing more quickly when the system stops being functional.
The main advantage of a system with a high hit rate is: to identify when the system stops being functional and stop exploiting the market's anomaly.
Look: When we are talking about trading and random distribution of results on the market, do you agree that when we create a trading system, we are focused on exploring some anomaly of that market?
When that anomaly is verified by the market, it will stop being functional with time.
That's why trading systems, 'scalpers', especially for cryptocurrencies, need constant monitoring, quarterly, semi-annually or annually.
Because market movements change from time to time.
Because we go through different cycles from time to time, such as congestion cycles, accumulation , distribution , volatility , uptrends and downtrends .
1️⃣2️⃣ : ❓ How to Exploit Market Anomalies ❓
You see there is a very important point that must be stressed here.
As we are always trying to exploit an 'anomaly' in the market.
So the 'number' of indicators/tools that will integrate the system is of paramount importance.
But most traders do not take this into consideration.
To build a professional, robust, consistent, and profitable system, you don't need to use hundreds of indicators to build your setup.
This will actually make it harder to read when the setup stops working and needs some adjustment.
So focusing on a high hit rate is very important here, this is a fundamental principle that is widely ignored , and with a high hit rate, we can know much more accurately when the system is no longer functional much faster.
As Darwin said: "It is not the strongest or the most intelligent that wins the game of life, it is the most adapted.
So simple systems, as contradictory as it may seem, are more efficient, because they help to identify inflection points in the market much more quickly.
1️⃣3️⃣ : ❓ What Defines a Robust, Profitable and Consistent System ❓
See I have built, hundreds of thousands of indicators and 'pinescript' strategies, hundreds of thousands.
This is an extremely professional, robust and profitable system.
Based on the currency pairs: BTC /USDT
There are many ways and avenues to build a profitable trading setup/system.
And actually this is not a difficult task, taking in consideration, as the main factor here, that our trading and investment plan is for the long term, so consequently we will face scenarios with less noise.
He who is in a hurry eats raw.
As mentioned before.
Defining trends in pinescript is technically a simple task, the hardest task is to determine congestion zones with low volume and volatility, it's in these moments that many false signals are generated, and consequently is where most setups face their maximum DrawDown.
That's why this strategy was strictly and thoroughly planned, built on a very solid foundation, to avoid as much noise as possible, for a positive and consistent equity curve in each market cycle, 'Consistency' is our 'Mantra' around here.
1️⃣4️⃣ : 🔧 Fixed Technical
• Strategy: Titan Investments|Quantitative THEMIS|Demo|BINANCE:BTCUSDTP:4h
• Pair: BTC/USDTP
• Time Frame: 4 hours
• Broker: Binance (Recommended)
For a more conservative scenario, we have built the Quantitative THEMIS for the 4h time frame, with the main focus on consistency.
So we can avoid noise as much as possible!
1️⃣5️⃣ : ❌ Fixed Outputs : 🎯 TP(%) & 🛑SL(%)
In order to build a 'perpetual' system specific to BTC/USDT, it took a lot of testing, and more testing, and a lot of investment and research.
There is one initial and fundamental point that we can address to justify the incredible consistency presented here.
That fundamental point is our exit via Take Profit or Stop Loss percentage (%).
🎯 Take Profit (%)
🛑 Stop Loss (%)
See, today I have been testing some more advanced backtesting models for some cryptocurrency systems.
In which I perform 'backtest of backtest', i.e. we use a set of strategies each focused on a principle, operating individually, but they are part of something unique, i.e. we do 'backtests' of 'backtests' together.
What I mean is that we do a lot of backtesting around here.
I can assure you, that always the best output for a trading system is to set fixed output values!
In other words:
🎯 Take Profit (%)
🛑 Stop Loss (%)
This happens because statistically setting fixed exit structures in the vast majority of times, presents a superior result on the capital/equity curve, throughout history and for the vast majority of setups compared to other exit methods.
This is due to a mathematical principle of simplicity, 'avoiding more noise'.
Thus whenever the Quantitative THEMIS strategy takes a position it has a target and a defined maximum stop percentage.
1️⃣6️⃣ : ⚠️ Risk Profile
The strategy, currently has 3 risk profiles ⚠️ patterns for 'fixed percentage exits': Take Profit (%) and Stop Loss (%) .
They are: ⚠️ Rich's Profiles
✔️🆑 Conservative: 🎯 TP=2.7 % 🛑 SL=2.7 %
❌Ⓜ️ Moderate: 🎯 TP=2.8 % 🛑 SL=2.7 %
❌🅰 Aggressive: 🎯 TP=1.6 % 🛑 SL=6.9 %
You will be able to select and switch between the above options and profiles through the 'input' menu of the strategy by navigating to the "⚠️ Risk Profile" menu.
You can then select, test and apply the Risk Profile above that best suits your risk management, expectations and reality , as well as customize all the 'fixed exit' values through the TP and SL menus below.
1️⃣7️⃣ : ⭕ Moving Exits : (Indicators)
The strategy currently also has 'Moving Exits' based on indicator signals.
These are Moving Exits (Indicators)
📈 LONG : (EXIT)
🧃 (MAO) Short : true
📉 SHORT : (EXIT)
🧃 (MAO) Long: false
You can select and toggle between the above options through the 'input' menu of the strategy by navigating to the "LONG : Exit" and "SHORT : Exit" menu.
1️⃣8️⃣ : 💸 Initial Capital
By default the "Initial Capital" set for entries and backtests of this strategy is: 10000 $
You can set another value for the 'Starting Capital' through the tradingview menu under "properties" , and edit the value of the "Initial Capital" field.
This way you can set and test other 'Entry Values' for your trades, tests and backtests.
1️⃣9️⃣ : ⚙️ Entry Options
By default the 'order size' set for this strategy is 100 % of the 'initial capital' on each new trade.
You can set and test other entry options like : contracts , cash , % of equity
You should make these changes directly in the input menu of the strategy by navigating to the menu "⚙️ Properties : TradingView" below.
⚙️ Properties : (TradingView)
📊 Strategy Type: strategy.position_size != 1
📝💲 % Order Type: % of equity
📝💲 % Order Size: 100
Leverage: 1
So you can define and test other 'Entry Options' for your trades, tests and backtests.
2️⃣0️⃣ : ❓ How to Automate this Strategy ❓ : 🤖 Automation : 'Third-Party Services'
It is possible to automate the signals of this strategy for any centralized or decentralized broker, as well as for messaging services: Discord, Telegram and Twitter.
All in an extremely simple and uncomplicated way through the tutorials available in PDF /VIDEO for our Titan Pro 👽 subscriber community.
With our tutorials in PDF and Video it will be possible to automate the signals of this strategy for the chosen service in an extremely simple way with less than 10 steps only.
Tradingview naturally doesn't count with native integration between brokers and tradingview.
But it is possible to use 'third party services' to do the integration and automation between Tradingview and your centralized or decentralized broker.
Here are the standard, available and recommended 'third party services' to automate the signals from the 'Quantitative THEMIS' strategy on the tradingview for your broker:
1) Wundertrading (Recommended):
2) 3commas:
3) Zignaly:
4) Aleeert.com (Recommended):
5) Alertatron:
Note! 'Third party services' cannot perform 'withdrawals' via their key 'API', they can only open positions, so your funds will always be 'safe' in your brokerage firm, being traded via the 'API', when they receive an entry and exit signal from this strategy.
2️⃣1️⃣ : ❓ How to Automate this Strategy ❓ : 🤖 Automation : 'Exchanges
You can automate this strategy for any of the brokers below, through your broker's 'API' by connecting it to the 'third party automation services' for tradingview available and mentioned in the menu above:
1) Binance (Recommended)
2) Bitmex
3) Bybit
4) KuCoin
5) Deribit
6) OKX
7) Coinbase
8) Huobi
9) Bitfinex
10) Bitget
11) Bittrex
12) Bitstamp
13) Gate. io
14) Kraken
15) Gemini
16) Ascendex
17) VCCE
2️⃣2️⃣ : ❓ How to Automate this Strategy ❓ : 🤖 Automation : 'Messaging Services'
You can also automate and monitor the signals of this strategy much more efficiently by sending them to the following popular messaging services:
1) Discord
2) Telegram
3) Twitter
2️⃣3️⃣ : ❓ How to Automate this Strategy ❓ : 🤖 Automation : '🧲🤖Copy-Trading'
It will also be possible to copy/replicate the entries and exits of this strategy to your broker in an extremely simple and agile way, through the available copy-trader services.
This way it will be possible to replicate the signals of this strategy at each entry and exit to your broker through the API connecting it to the integrated copy-trader services available through the tradingview automation services below:
1) Wundetrading:
2) Zignaly:
2️⃣4️⃣ : ❔ Why be a Titan Pro 👽❔
I believe that today I am at another level in 'pinescript' development.
I consider myself today a true unicorn as a pinescript developer, someone unique and very rare.
If you choose another tool or another pinescript service, this tool will be just another one, with no real results.
But if you join our Titan community, you will have access to a unique tool! And you will get real results!
I already earn money consistently with statistical and automated trading and as an expert pinescript developer.
I am here to evolve my skills as much as possible, and one day become a pinescript 'Wizard'.
So excellence, quality and professionalism will always be my north here.
You will never find a developer like me, and who will take so seriously such a revolutionary project as this one. A Maverick! ▬ The man never stops!
Here you will find the highest degree of sophistication and development in the market for 'pinescript'.
You will get the best of me and the best of pinescript possible.
Let me show you how a professional in my field does it.
Become a Titan Pro Member 👽 and get Full Access to this strategy and all the Automation Tutorials.
Be the Titan in your life!
2️⃣5️⃣ : ❔ Why be a Titan Aff 🛸❔
Get financial return for your referrals, Decentralize the World, and raise the collective consciousness.
2️⃣6️⃣ : 📋 Summary : ⚖️ Strategy: Titan Investments|Quantitative THEMIS|Demo|BINANCE:BTCUSDTP:4h
® Titan Investimentos | Quantitative THEMIS ⚖️ | Demo 🐄 2.6 | Dev: © FilipeSoh 🧙 | 🤖 100% Automated : Discord, Telegram, Twitter, Wundertrading, 3commas, Zignaly, Aleeert, Alertatron, Uniswap-v3 | BINANCE:BTCUSDTPERP 4h
🛒 Subscribe this strategy ❗️ Be a Titan Member 🏛️
🛒 Titan Pro 👽 🔗 🏛️ Titan Pro 👽 Version with ✔️100% Integrated Automation 🤖 and 📚 Automation Tutorials ✔️100% available at: (PDF/VIDEO)
🛒 Titan Affiliate 🛸 🔗 🏛️ Titan Affiliate 🛸 (Subscription Sale) 🔥 Receive 50% commission
📋 Summary : QT THEMIS ⚖️
🕵️♂️ Check This Strategy..................................................................0
🦄 ® Titan Investimentos...............................................................1
👨💻 © Developer..........................................................................2
📚 Signal Automation Tutorials : (PDF/VIDEO).......................................3
👨🔧 Revision...............................................................................4
📊 Table : (BACKTEST)..................................................................5
📊 Table : (INFORMATIONS).............................................................6
⚙️ Properties : (TRADINGVIEW)........................................................7
📆 Backtest : (TRADINGVIEW)..........................................................8
⚠️ Risk Profile...........................................................................9
🟢 On 🔴 Off : (LONG/SHORT).......................................................10
📈 LONG : (ENTRY)....................................................................11
📉 SHORT : (ENTRY)...................................................................12
📈 LONG : (EXIT).......................................................................13
📉 SHORT : (EXIT)......................................................................14
🧩 (EI) External Indicator.............................................................15
📡 (QT) Quantitative...................................................................16
🎠 (FF) Forecast......................................................................17
🅱 (BB) Bollinger Bands................................................................18
🧃 (MAP) Moving Average Primary......................................................19
🧃 (MAP) Labels.........................................................................20
🍔 (MAQ) Moving Average Quaternary.................................................21
🍟 (MACD) Moving Average Convergence Divergence...............................22
📣 (VWAP) Volume Weighted Average Price........................................23
🪀 (HL) HILO..........................................................................24
🅾 (OBV) On Balance Volume.........................................................25
🥊 (SAR) Stop and Reverse...........................................................26
🛡️ (DSR) Dynamic Support and Resistance..........................................27
🔊 (VD) Volume Directional..........................................................28
🧰 (RSI) Relative Momentum Index.................................................29
🎯 (TP) Take Profit %..................................................................30
🛑 (SL) Stop Loss %....................................................................31
🤖 Automation Selected...............................................................32
📱💻 Discord............................................................................33
📱💻 Telegram..........................................................................34
📱💻 Twitter...........................................................................35
🤖 Wundertrading......................................................................36
🤖 3commas............................................................................37
🤖 Zignaly...............................................................................38
🤖 Aleeert...............................................................................39
🤖 Alertatron...........................................................................40
🤖 Uniswap-v3..........................................................................41
🧲🤖 Copy-Trading....................................................................42
♻️ ® No Repaint........................................................................43
🔒 Copyright ©️..........................................................................44
🏛️ Be a Titan Member..................................................................45
Nº Active Users..........................................................................46
⏱ Time Left............................................................................47
| 0 | 🕵️♂️ Check This Strategy
🕵️♂️ Version Demo: 🐄 Version with ❌non-integrated automation 🤖 and 📚 Tutorials for automation ❌not available
🕵️♂️ Version Pro: 👽 Version with ✔️100% Integrated Automation 🤖 and 📚 Automation Tutorials ✔️100% available at: (PDF/VIDEO)
| 1 | 🦄 ® Titan Investimentos
Decentralizing the World 🗺
Raising the Collective Conscience 🗺
🦄Site:
🦄TradingView: www.tradingview.com
🦄Discord:
🦄Telegram:
🦄Youtube:
🦄Twitter:
🦄Instagram:
🦄TikTok:
🦄Linkedin:
🦄E-mail:
| 2 | 👨💻 © Developer
🧠 Developer: @FilipeSoh🧙
📺 TradingView: www.tradingview.com
☑️ Linkedin:
✅ Fiverr:
✅ Upwork:
🎥 YouTube:
🐤 Twitter:
🤳 Instagram:
| 3 | 📚 Signal Automation Tutorials : (PDF/VIDEO)
📚 Discord: 🔗 Link: 🔒Titan Pro👽
📚 Telegram: 🔗 Link: 🔒Titan Pro👽
📚 Twitter: 🔗 Link: 🔒Titan Pro👽
📚 Wundertrading: 🔗 Link: 🔒Titan Pro👽
📚 3comnas: 🔗 Link: 🔒Titan Pro👽
📚 Zignaly: 🔗 Link: 🔒Titan Pro👽
📚 Aleeert: 🔗 Link: 🔒Titan Pro👽
📚 Alertatron: 🔗 Link: 🔒Titan Pro👽
📚 Uniswap-v3: 🔗 Link: 🔒Titan Pro👽
📚 Copy-Trading: 🔗 Link: 🔒Titan Pro👽
| 4 | 👨🔧 Revision
👨🔧 Start Of Operations: 01 Jan 2019 21:00 -0300 💡 Start Of Operations (Skin in the game) : Revision 1.0
👨🔧 Previous Review: 01 Jan 2022 21:00 -0300 💡 Previous Review : Revision 2.0
👨🔧 Current Revision: 01 Jan 2023 21:00 -0300 💡 Current Revision : Revision 2.6
👨🔧 Next Revision: 28 May 2023 21:00 -0300 💡 Next Revision : Revision 2.7
| 5 | 📊 Table : (BACKTEST)
📊 Table: true
🖌️ Style: label.style_label_left
📐 Size: size_small
📏 Line: defval
🎨 Color: #131722
| 6 | 📊 Table : (INFORMATIONS)
📊 Table: false
🖌️ Style: label.style_label_right
📐 Size: size_small
📏 Line: defval
🎨 Color: #131722
| 7 | ⚙️ Properties : (TradingView)
📊 Strategy Type: strategy.position_size != 1
📝💲 % Order Type: % of equity
📝💲 % Order Size: 100 %
🚀 Leverage: 1
| 8 | 📆 Backtest : (TradingView)
🗓️ Mon: true
🗓️ Tue: true
🗓️ Wed: true
🗓️ Thu: true
🗓️ Fri: true
🗓️ Sat: true
🗓️ Sun: true
📆 Range: custom
📆 Start: UTC 31 Oct 2008 00:00
📆 End: UTC 31 Oct 2030 23:45
📆 Session: 0000-0000
📆 UTC: UTC
| 9 | ⚠️ Risk Profile
✔️🆑 Conservative: 🎯 TP=2.7 % 🛑 SL=2.7 %
❌Ⓜ️ Moderate: 🎯 TP=2.8 % 🛑 SL=2.7 %
❌🅰 Aggressive: 🎯 TP=1.6 % 🛑 SL=6.9 %
| 10 | 🟢 On 🔴 Off : (LONG/SHORT)
🟢📈 LONG: true
🟢📉 SHORT: true
| 11 | 📈 LONG : (ENTRY)
📡 (QT) Long: true
🧃 (MAP) Long: false
🅱 (BB) Long: false
🍟 (MACD) Long: false
🅾 (OBV) Long: false
| 12 | 📉 SHORT : (ENTRY)
📡 (QT) Short: true
🧃 (MAP) Short: false
🅱 (BB) Short: false
🍟 (MACD) Short: false
🅾 (OBV) Short: false
| 13 | 📈 LONG : (EXIT)
🧃 (MAP) Short: true
| 14 | 📉 SHORT : (EXIT)
🧃 (MAP) Long: false
| 15 | 🧩 (EI) External Indicator
🧩 (EI) Connect your external indicator/filter: false
🧩 (EI) Connect your indicator here (Study mode only): close
🧩 (EI) Connect your indicator here (Study mode only): close
| 16 | 📡 (QT) Quantitative
📡 (QT) Quantitative: true
📡 (QT) Market: BINANCE:BTCUSDTPERP
📡 (QT) Dice: openai
| 17 | 🎠 (FF) Forecast
🎠 (FF) Include current unclosed current candle: true
🎠 (FF) Forecast Type: flat
🎠 (FF) Nº of candles to use in linear regression: 3
| 18 | 🅱 (BB) Bollinger Bands
🅱 (BB) Bollinger Bands: true
🅱 (BB) Type: EMA
🅱 (BB) Period: 20
🅱 (BB) Source: close
🅱 (BB) Multiplier: 2
🅱 (BB) Linewidth: 0
🅱 (BB) Color: #131722
| 19 | 🧃 (MAP) Moving Average Primary
🧃 (MAP) Moving Average Primary: true
🧃 (MAP) BarColor: false
🧃 (MAP) Background: false
🧃 (MAP) Type: SMA
🧃 (MAP) Source: open
🧃 (MAP) Period: 100
🧃 (MAP) Multiplier: 2.0
🧃 (MAP) Linewidth: 2
🧃 (MAP) Color P: #42bda8
🧃 (MAP) Color N: #801922
| 20 | 🧃 (MAP) Labels
🧃 (MAP) Labels: true
🧃 (MAP) Style BUY ZONE: shape.labelup
🧃 (MAP) Color BUY ZONE: #42bda8
🧃 (MAP) Style SELL ZONE: shape.labeldown
🧃 (MAP) Color SELL ZONE: #801922
| 21 | 🍔 (MAQ) Moving Average Quaternary
🍔 (MAQ) Moving Average Quaternary: true
🍔 (MAQ) BarColor: false
🍔 (MAQ) Background: false
🍔 (MAQ) Type: SMA
🍔 (MAQ) Source: close
🍔 (MAQ) Primary: 14
🍔 (MAQ) Secondary: 22
🍔 (MAQ) Tertiary: 44
🍔 (MAQ) Quaternary: 16
🍔 (MAQ) Linewidth: 0
🍔 (MAQ) Color P: #42bda8
🍔 (MAQ) Color N: #801922
| 22 | 🍟 (MACD) Moving Average Convergence Divergence
🍟 (MACD) Macd Type: EMA
🍟 (MACD) Signal Type: EMA
🍟 (MACD) Source: close
🍟 (MACD) Fast: 12
🍟 (MACD) Slow: 26
🍟 (MACD) Smoothing: 9
| 23 | 📣 (VWAP) Volume Weighted Average Price
📣 (VWAP) Source: close
📣 (VWAP) Period: 340
📣 (VWAP) Momentum A: 84
📣 (VWAP) Momentum B: 150
📣 (VWAP) Average Volume: 1
📣 (VWAP) Multiplier: 1
📣 (VWAP) Diviser: 2
| 24 | 🪀 (HL) HILO
🪀 (HL) Type: SMA
🪀 (HL) Function: Maverick🧙
🪀 (HL) Source H: high
🪀 (HL) Source L: low
🪀 (HL) Period: 20
🪀 (HL) Momentum: 26
🪀 (HL) Diviser: 2
🪀 (HL) Multiplier: 1
| 25 | 🅾 (OBV) On Balance Volume
🅾 (OBV) Type: EMA
🅾 (OBV) Source: close
🅾 (OBV) Period: 16
🅾 (OBV) Diviser: 2
🅾 (OBV) Multiplier: 1
| 26 | 🥊 (SAR) Stop and Reverse
🥊 (SAR) Source: close
🥊 (SAR) High: 1.8
🥊 (SAR) Mid: 1.6
🥊 (SAR) Low: 1.6
🥊 (SAR) Diviser: 2
🥊 (SAR) Multiplier: 1
| 27 | 🛡️ (DSR) Dynamic Support and Resistance
🛡️ (DSR) Source D: close
🛡️ (DSR) Source R: high
🛡️ (DSR) Source S: low
🛡️ (DSR) Momentum R: 0
🛡️ (DSR) Momentum S: 2
🛡️ (DSR) Diviser: 2
🛡️ (DSR) Multiplier: 1
| 28 | 🔊 (VD) Volume Directional
🔊 (VD) Type: SMA
🔊 (VD) Period: 68
🔊 (VD) Momentum: 3.8
🔊 (VD) Diviser: 2
🔊 (VD) Multiplier: 1
| 29 | 🧰 (RSI) Relative Momentum Index
🧰 (RSI) Type UP: EMA
🧰 (RSI) Type DOWN: EMA
🧰 (RSI) Source: close
🧰 (RSI) Period: 29
🧰 (RSI) Smoothing: 22
🧰 (RSI) Momentum R: 64
🧰 (RSI) Momentum S: 142
🧰 (RSI) Diviser: 2
🧰 (RSI) Multiplier: 1
| 30 | 🎯 (TP) Take Profit %
🎯 (TP) Take Profit: false
🎯 (TP) %: 2.2
🎯 (TP) Color: #42bda8
🎯 (TP) Linewidth: 1
| 31 | 🛑 (SL) Stop Loss %
🛑 (SL) Stop Loss: false
🛑 (SL) %: 2.7
🛑 (SL) Color: #801922
🛑 (SL) Linewidth: 1
| 32 | 🤖 Automation : Discord | Telegram | Twitter | Wundertrading | 3commas | Zignaly | Aleeert | Alertatron | Uniswap-v3
🤖 Automation Selected : Discord
| 33 | 🤖 Discord
🔗 Link Discord:
🔗 Link 📚 Automation: 🔒Titan Pro👽
📱💻 Discord ▬ Enter Long: 🔒Titan Pro👽
📱💻 Discord ▬ Exit Long: 🔒Titan Pro👽
📱💻 Discord ▬ Enter Short: 🔒Titan Pro👽
📱💻 Discord ▬ Exit Short: 🔒Titan Pro👽
| 34 | 🤖 Telegram
🔗 Link Telegram:
🔗 Link 📚 Automation: 🔒Titan Pro👽
📱💻 Telegram ▬ Enter Long: 🔒Titan Pro👽
📱💻 Telegram ▬ Exit Long: 🔒Titan Pro👽
📱💻 Telegram ▬ Enter Short: 🔒Titan Pro👽
📱💻 Telegram ▬ Exit Short: 🔒Titan Pro👽
| 35 | 🤖 Twitter
🔗 Link Twitter:
🔗 Link 📚 Automation: 🔒Titan Pro👽
📱💻 Twitter ▬ Enter Long: 🔒Titan Pro👽
📱💻 Twitter ▬ Exit Long: 🔒Titan Pro👽
📱💻 Twitter ▬ Enter Short: 🔒Titan Pro👽
📱💻 Twitter ▬ Exit Short: 🔒Titan Pro👽
| 36 | 🤖 Wundertrading : Binance | Bitmex | Bybit | KuCoin | Deribit | OKX | Coinbase | Huobi | Bitfinex | Bitget
🔗 Link Wundertrading:
🔗 Link 📚 Automation: 🔒Titan Pro👽
📱💻 Wundertrading ▬ Enter Long: 🔒Titan Pro👽
📱💻 Wundertrading ▬ Exit Long: 🔒Titan Pro👽
📱💻 Wundertrading ▬ Enter Short: 🔒Titan Pro👽
📱💻 Wundertrading ▬ Exit Short: 🔒Titan Pro👽
| 37 | 🤖 3commas : Binance | Bybit | OKX | Bitfinex | Coinbase | Deribit | Bitmex | Bittrex | Bitstamp | Gate.io | Kraken | Gemini | Huobi | KuCoin
🔗 Link 3commas:
🔗 Link 📚 Automation: 🔒Titan Pro👽
📱💻 3commas ▬ Enter Long: 🔒Titan Pro👽
📱💻 3commas ▬ Exit Long: 🔒Titan Pro👽
📱💻 3commas ▬ Enter Short: 🔒Titan Pro👽
📱💻 3commas ▬ Exit Short: 🔒Titan Pro👽
| 38 | 🤖 Zignaly : Binance | Ascendex | Bitmex | Kucoin | VCCE
🔗 Link Zignaly:
🔗 Link 📚 Automation: 🔒Titan Pro👽
🤖 Type Automation: Profit Sharing
🤖 Type Provider: Webook
🔑 Key: 🔒Titan Pro👽
🤖 pair: BTCUSDTP
🤖 exchange: binance
🤖 exchangeAccountType: futures
🤖 orderType: market
🚀 leverage: 1x
% positionSizePercentage: 100 %
💸 positionSizeQuote: 10000 $
🆔 signalId: @Signal1234
| 39 | 🤖 Aleeert : Binance
🔗 Link Aleeert:
🔗 Link 📚 Automation: 🔒Titan Pro👽
📱💻 Aleeert ▬ Enter Long: 🔒Titan Pro👽
📱💻 Aleeert ▬ Exit Long: 🔒Titan Pro👽
📱💻 Aleeert ▬ Enter Short: 🔒Titan Pro👽
📱💻 Aleeert ▬ Exit Short: 🔒Titan Pro👽
| 40 | 🤖 Alertatron : Binance | Bybit | Deribit | Bitmex
🔗 Link Alertatron:
🔗 Link 📚 Automation: 🔒Titan Pro👽
📱💻 Alertatron ▬ Enter Long: 🔒Titan Pro👽
📱💻 Alertatron ▬ Exit Long: 🔒Titan Pro👽
📱💻 Alertatron ▬ Enter Short: 🔒Titan Pro👽
📱💻 Alertatron ▬ Exit Short: 🔒Titan Pro👽
| 41 | 🤖 Uniswap-v3
🔗 Link Alertatron:
🔗 Link 📚 Automation: 🔒Titan Pro👽
📱💻 Uniswap-v3 ▬ Enter Long: 🔒Titan Pro👽
📱💻 Uniswap-v3 ▬ Exit Long: 🔒Titan Pro👽
📱💻 Uniswap-v3 ▬ Enter Short: 🔒Titan Pro👽
📱💻 Uniswap-v3 ▬ Exit Short: 🔒Titan Pro👽
| 42 | 🧲🤖 Copy-Trading : Zignaly | Wundertrading
🔗 Link 📚 Copy-Trading: 🔒Titan Pro👽
🧲🤖 Copy-Trading ▬ Zignaly: 🔒Titan Pro👽
🧲🤖 Copy-Trading ▬ Wundertrading: 🔒Titan Pro👽
| 43 | ♻️ ® Don't Repaint!
♻️ This Strategy does not Repaint!: ® Signs Do not repaint❕
♻️ This is a Real Strategy!: Quality : ® Titan Investimentos
📋️️ Get more information about Repainting here:
| 44 | 🔒 Copyright ©️
🔒 Copyright ©️: Copyright © 2023-2024 All rights reserved, ® Titan Investimentos
🔒 Copyright ©️: ® Titan Investimentos
🔒 Copyright ©️: Unique and Exclusive Strategy. All rights reserved
| 45 | 🏛️ Be a Titan Members
🏛️ Titan Pro 👽 Version with ✔️100% Integrated Automation 🤖 and 📚 Automation Tutorials ✔️100% available at: (PDF/VIDEO)
🏛️ Titan Affiliate 🛸 (Subscription Sale) 🔥 Receive 50% commission
| 46 | ⏱ Time Left
Time Left Titan Demo 🐄: ⏱♾ | ⏱ : ♾ Titan Demo 🐄 Version with ❌non-integrated automation 🤖 and 📚 Tutorials for automation ❌not available
Time Left Titan Pro 👽: 🔒Titan Pro👽 | ⏱ : Pro Plans: 30 Days, 90 Days, 12 Months, 24 Months. (👽 Pro 🅼 Monthly, 👽 Pro 🆀 Quarterly, 👽 Pro🅰 Annual, 👽 Pro👾Two Years)
| 47 | Nº Active Users
Nº Active Subscribers Titan Pro 👽: 5️⃣6️⃣ | 1✔️ 5✔️ 10✔️ 100❌ 1K❌ 10K❌ 50K❌ 100K❌ 1M❌ 10M❌ 100M❌ : ⏱ Active Users is updated every 24 hours (Check on indicator)
Nº Active Affiliates Titan Aff 🛸: 6️⃣ | 1✔️ 5✔️ 10❌ 100❌ 1K❌ 10K❌ 50K❌ 100K❌ 1M❌ 10M❌ 100M❌ : ⏱ Active Users is updated every 24 hours (Check on indicator)
2️⃣7️⃣ : 📊 PERFORMANCE : 🆑 Conservative
📊 Exchange: Binance
📊 Pair: BINANCE: BTCUSDTPERP
📊 TimeFrame: 4h
📊 Initial Capital: 10000 $
📊 Order Type: % equity
📊 Size Per Order: 100 %
📊 Commission: 0.03 %
📊 Pyramid: 1
• ⚠️ Risk Profile: 🆑 Conservative: 🎯 TP=2.7 % | 🛑 SL=2.7 %
• 📆All years: 🆑 Conservative: 🚀 Leverage 1️⃣x
📆 Start: September 23, 2019
📆 End: January 11, 2023
📅 Days: 1221
📅 Bars: 7325
Net Profit:
🟢 + 1669.89 %
💲 + 166989.43 USD
Total Close Trades:
⚪️ 369
Percent Profitable:
🟡 64.77 %
Profit Factor:
🟢 2.314
DrawDrown Maximum:
🔴 -24.82 %
💲 -10221.43 USD
Avg Trade:
💲 + 452.55 USD
✔️ Trades Winning: 239
❌ Trades Losing: 130
✔️ Average Gross Win: + 12.31 %
❌ Average Gross Loss: - 9.78 %
✔️ Maximum Consecutive Wins: 9
❌ Maximum Consecutive Losses: 6
% Average Gain Annual: 499.33 %
% Average Gain Monthly: 41.61 %
% Average Gain Weekly: 9.6 %
% Average Gain Day: 1.37 %
💲 Average Gain Annual: 49933 $
💲 Average Gain Monthly: 4161 $
💲 Average Gain Weekly: 960 $
💲 Average Gain Day: 137 $
• 📆 Year: 2020: 🆑 Conservative: 🚀 Leverage 1️⃣x
• 📆 Year: 2021: 🆑 Conservative: 🚀 Leverage 1️⃣x
• 📆 Year: 2022: 🆑 Conservative: 🚀 Leverage 1️⃣x
2️⃣8️⃣ : 📊 PERFORMANCE : Ⓜ️ Moderate
📊 Exchange: Binance
📊 Pair: BINANCE: BTCUSDTPERP
📊 TimeFrame: 4h
📊 Initial Capital: 10000 $
📊 Order Type: % equity
📊 Size Per Order: 100 %
📊 Commission: 0.03 %
📊 Pyramid: 1
• ⚠️ Risk Profile: Ⓜ️ Moderate: 🎯 TP=2.8 % | 🛑 SL=2.7 %
• 📆 All years: Ⓜ️ Moderate: 🚀 Leverage 1️⃣x
📆 Start: September 23, 2019
📆 End: January 11, 2023
📅 Days: 1221
📅 Bars: 7325
Net Profit:
🟢 + 1472.04 %
💲 + 147199.89 USD
Total Close Trades:
⚪️ 362
Percent Profitable:
🟡 63.26 %
Profit Factor:
🟢 2.192
DrawDrown Maximum:
🔴 -22.69 %
💲 -9269.33 USD
Avg Trade:
💲 + 406.63 USD
✔️ Trades Winning: 229
❌ Trades Losing : 133
✔️ Average Gross Win: + 11.82 %
❌ Average Gross Loss: - 9.29 %
✔️ Maximum Consecutive Wins: 9
❌ Maximum Consecutive Losses: 8
% Average Gain Annual: 440.15 %
% Average Gain Monthly: 36.68 %
% Average Gain Weekly: 8.46 %
% Average Gain Day: 1.21 %
💲 Average Gain Annual: 44015 $
💲 Average Gain Monthly: 3668 $
💲 Average Gain Weekly: 846 $
💲 Average Gain Day: 121 $
• 📆 Year: 2020: Ⓜ️ Moderate: 🚀 Leverage 1️⃣x
• 📆 Year: 2021: Ⓜ️ Moderate: 🚀 Leverage 1️⃣x
• 📆 Year: 2022: Ⓜ️ Moderate: 🚀 Leverage 1️⃣x
2️⃣9️⃣ : 📊 PERFORMANCE : 🅰 Aggressive
📊 Exchange: Binance
📊 Pair: BINANCE: BTCUSDTPERP
📊 TimeFrame: 4h
📊 Initial Capital: 10000 $
📊 Order Type: % equity
📊 Size Per Order: 100 %
📊 Commission: 0.03 %
📊 Pyramid: 1
• ⚠️ Risk Profile: 🅰 Aggressive: 🎯 TP=1.6 % | 🛑 SL=6.9 %
• 📆 All years: 🅰 Aggressive: 🚀 Leverage 1️⃣x
📆 Start: September 23, 2019
📆 End: January 11, 2023
📅 Days: 1221
📅 Bars: 7325
Net Profit:
🟢 + 989.38 %
💲 + 98938.38 USD
Total Close Trades:
⚪️ 380
Percent Profitable:
🟢 84.47 %
Profit Factor:
🟢 2.156
DrawDrown Maximum:
🔴 -17.88 %
💲 -9182.84 USD
Avg Trade:
💲 + 260.36 USD
✔️ Trades Winning: 321
❌ Trades Losing: 59
✔️ Average Gross Win: + 5.75 %
❌ Average Gross Loss: - 14.51 %
✔️ Maximum Consecutive Wins: 21
❌ Maximum Consecutive Losses: 6
% Average Gain Annual: 295.84 %
% Average Gain Monthly: 24.65 %
% Average Gain Weekly: 5.69 %
% Average Gain Day: 0.81 %
💲 Average Gain Annual: 29584 $
💲 Average Gain Monthly: 2465 $
💲 Average Gain Weekly: 569 $
💲 Average Gain Day: 81 $
• 📆 Year: 2020: 🅰 Aggressive: 🚀 Leverage 1️⃣x
• 📆 Year: 2021: 🅰 Aggressive: 🚀 Leverage 1️⃣x
• 📆 Year: 2022: 🅰 Aggressive: 🚀 Leverage 1️⃣x
3️⃣0️⃣ : 🛠️ Roadmap
🛠️• 14/ 01 /2023 : Titan THEMIS Launch
🛠️• Updates January/2023 :
• 📚 Tutorials for Automation 🤖 already Available : ✔️
• ✔️ Discord
• ✔️ Wundertrading
• ✔️ Zignaly
• 📚 Tutorials for Automation 🤖 In Preparation : ⭕
• ⭕ Telegram
• ⭕ Twitter
• ⭕ 3comnas
• ⭕ Aleeert
• ⭕ Alertatron
• ⭕ Uniswap-v3
• ⭕ Copy-Trading
🛠️• Updates February/2023 :
• 📰 Launch of advertising material for Titan Affiliates 🛸
• 🛍️🎥🖼️📊 (Sales Page/VSL/Videos/Creative/Infographics)
🛠️• 28/05/2023 : Titan THEMIS update ▬ Version 2.7
🛠️• 28/05/2023 : BOT BOB release ▬ Version 1.0
• (Native Titan THEMIS Automation - Through BOT BOB, a bot for automation of signals, indicators and strategies of TradingView, of own code ▬ in validation.
• BOT BOB
Automation/Connection :
• API - For Centralized Brokers.
• Smart Contracts - Wallet Web - For Decentralized Brokers.
• This way users can automate any indicator or strategy of TradingView and Titan in a decentralized, secure and simplified way.
• Without having the need to use 'third party services' for automating TradingView indicators and strategies like the ones available above.
🛠️• 28/05/2023 : Release ▬ Titan Culture Guide 📝
3️⃣1️⃣ : 🧻 Notes ❕
🧻 • Note ❕ The "Demo 🐄" version, ❌does not have 'integrated automation', to automate the signals of this strategy and enjoy a fully automated system, you need to have access to the Pro version with '100% integrated automation' and all the tutorials for automation available. Become a Titan Pro 👽
🧻 • Note ❕ You will also need to be a "Pro User or higher on Tradingview", to be able to use the webhook feature available only for 'paid' profiles on the platform.
With the webhook feature it is possible to send the signals of this strategy to almost anywhere, in our case to centralized or decentralized brokerages, also to popular messaging services such as: Discord, Telegram or Twiter.
3️⃣2️⃣ : 🚨 Disclaimer ❕❗
🚨 • Disclaimer ❕❕ Past positive result and performance of a system does not guarantee its positive result and performance for the future!
🚨 • Disclaimer ❗❗❗ When using this strategy: Titan Investments is totally Exempt from any claim of liability for losses. The responsibility on the management of your funds is solely yours. This is a very high risk/volatility market! Understand your place in the market.
3️⃣3️⃣ : ♻️ ® No Repaint
This Strategy does not Repaint! This is a real strategy!
3️⃣4️⃣ : 🔒 Copyright ©️
Copyright © 2022-2023 All rights reserved, ® Titan Investimentos
3️⃣5️⃣ : 👏 Acknowledgments
I want to start this message in thanks to TradingView and all the Pinescript community for all the 'magic' created here, a unique ecosystem! rich and healthy, a fertile soil, a 'new world' of possibilities, for a complete deepening and improvement of our best personal skills.
I leave here my immense thanks to the whole community: Tradingview, Pinecoders, Wizards and Moderators.
I was not born Rich .
Thanks to TradingView and pinescript and all its transformation.
I could develop myself and the best of me and the best of my skills.
And consequently build wealth and patrimony.
Gratitude.
One more story for the infinite book !
If you were born poor you were born to be rich !
Raising🔼 the level and raising🔼 the ruler! 📏
My work is my 'debauchery'! Do better! 💐🌹
Soul of a first-timer! Creativity Exudes! 🦄
This is the manifestation of God's magic in me. This is the best of me. 🧙
You will copy me, I know. So you owe me. 💋
My mission here is to raise the consciousness and self-esteem of all Titans and Titanids! Welcome! 🧘 🏛️
The only way to accomplish great work is to do what you love ! Before I learned to program I was wasting my life!
Death is the best creation of life .
Now you are the new , but in the not so distant future you will gradually become the old . Here I stay forever!
Playing the game like an Athlete! 🖼️ Enjoy and Enjoy 🍷 🗿
In honor of: BOB ☆
1 name, 3 letters, 3 possibilities, and if read backwards it's the same thing, a palindrome. ☘
Gratitude to the oracles that have enabled me the 'luck' to get this far: Dal&Ni&Fer
3️⃣6️⃣ : 👮 House Rules : 📺 TradingView
House Rules : This publication and strategy follows all TradingView house guidelines and rules:
📺 TradingView House Rules: www.tradingview.com
📺 Script publication rules: www.tradingview.com
📺 Vendor requirements: www.tradingview.com
📺 Links/References rules: www.tradingview.com
3️⃣7️⃣ : 🏛️ Become a Titan Pro member 👽
🟩 Titan Pro 👽 🟩
3️⃣8️⃣ : 🏛️ Be a member Titan Aff 🛸
🟥 Titan Affiliate 🛸 🟥

Probabilities Module - The Quant Science This module can be integrate in your code strategy or indicator and will help you to calculate the percentage probability on specific event inside your strategy. The main goal is improve and simplify the workflow if you are trying to build a quantitative strategy or indicator based on statistics or reinforcement model.
Logic
The script made a simulation inside your code based on a single event. For single event mean a trading logic composed by three different objects: entry, take profit, stop loss.
The script scrape in the past through a look back function and return the positive percentage probability about the positive event inside the data sample. In this way you are able to understand and calculate how many time (in percentage term) the conditions inside the single event are positive, helping to create your statistical edge.
You can adjust the look back period in you user interface.
How can set up the module for your use case
At the top of the script you can find:
1. entry_condition : replace the default condition with your specific entry condition.
2. TPcondition_exit : replace the default condition with your specific take profit condition.
3. SLcondition_exit : replace the default condition with your specific stop loss condition.

Statistical Correlation Algorithm - The Quant ScienceStatistical Correlation Algorithm - The Quant Science™ is a quantitative trading algorithm.
ALGORITHM DESCRIPTION
This algorithm analyses the correlation ratios between two assets. The main asset (on the chart), and the secondary asset (set by the user). Then apply the long or short trading strategy.
The algorithm divides trading work into three parts:
1. Correlation analysis
2. Long or short entry
3. Closing trades
Inside the strategy: the algorithm analyses the percentage change yields from a previous session, of the secondary asset. If the variation meets the set condition then it will open a long or short position, on the primary asset. The open position is closed after 'x' number of sessions. Stop loss and take profit can be added to the trade exit parameters.
Logic: analyses the correlation between two assets and looks for a statistical advantage within the correlation.
INDICATOR DESCRIPTION
The algorithm includes a quantitative indicator. This indicator is used for correlation analysis and offers a quick reading of the quantitative data. The blue area shows the correlation ratio values. The yellow histograms show the percentage change in the yields of the main asset. Purple histograms show the percentage change in secondary asset yields.
GENERAL FEATURES
Multi time-frame: the user can set any time-frame for the secondary asset.
Multi asset: the user analyses the conditions on a second asset.
Multi-strategy: the algorithm can apply either the long strategy or the short strategy.
Built-in alerts: the algorithm contains alerts that can be customized from the user interface.
Integrated indicator: the quantity indicator is included.
Backtesting included: automatic backtesting of the strategy is generated based on the values set.
Auto-trading compliant: functions for auto trading are included.
USER INTERFACE SETTINGS
Through the intuitive user interface, you can manage all the parameters of this algorithm without any programming experience. The user interface is extremely descriptive and contains all the information needed to understand the logic of the algorithm and to configure it correctly.
1. Date range: through this function you can adjust the analysis and working period of the algorithm.
2. Asset: through this function you can adjust the secondary asset and its time-frame. You can enter any type of asset, even indices and economic indicators.
3. Asset details: this function is used to adjust the percentage change to be analyzed on the secondary asset. The analysis and input conditions are also chosen.
4. Active long or short strategy: this function is used to set the type of strategy to be used, long or short.
5. Setting algo trading alert: with this function, users can manage alerts for their web-hook.
6. Exit&Money management: with this function the user can adjust the exit periods of each trade and activate or deactivate any stop losses and take profits.
7. Data Value Analysis: this function is used to adjust the parameters for the quantity indicator.

Yield Trend Indicator - The Quant ScienceYield Trend Indicator - The Quant Science™ is a quantitative indicator representing percentage yields and average percentage yields of three different assets.
Percentage yields are fundamental data for all quantitative analysts. This indicator was created to offer immediate calculations and represent them through an indicator consisting of lines and columns. The columns represent the percentage yield of the current timeframe, for each asset. The lines represent the average percentage yield, of the current timeframe, for each asset.
The user easily adds tickers from the user interface and the algorithm will automatically create the quantitative data of the chosen assets.
The blue refers to the main asset, the main set on the chart.
The yellow refers to the second asset, added by the user interface.
The red refers to the third asset, added by the user interface.
The timeframe is for all assets the one set to the chart, if you use a chart with timeframe D, all data is processed on this timeframe. You can use this indicator on all timeframes without any restrictions.
The user can change the type of formula for calculating the average yield easily via the user interface. This software includes the following formulas:
1. SMA (Simple Moving Average)
2. EMA (Exponential Moving Average)
3. WMA (Weighted Moving Average)
4. VWMA (Volume Weighted Moving Average)
The user can customize the indicator easily through the user interface, changing colours and many other parameters to represent the data on the chart.
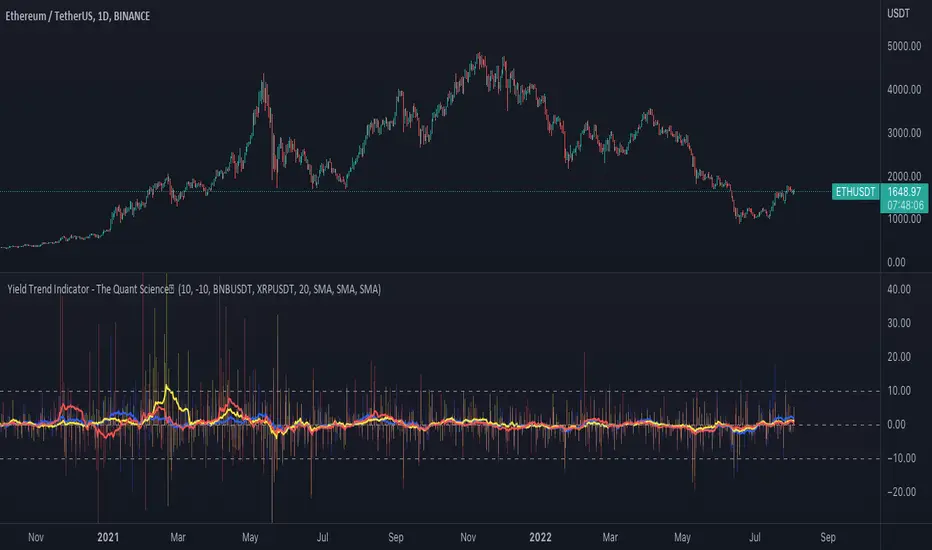
Ethereum OnChain Data Indicator - The Quant ScienceEthereum On Chain Data Indicator - The Quant Science™ is a quantitative indicator created for mid-long term analysis.
The indicator uses quantitative statistics to recreate a model that represents the most important data from the on-chain analysis for the Ethereum blockchain.
The on-chain data used to create this model are:
1. Total weekly transactions
2. Total monthly transactions
3. Frequency of transactions per second on a daily scale
4. Frequency of transactions per second on a weekly scale
5. Amount of Ethereum burned on a daily scale
6. Amount of Ethereum burned on a weekly scale
7. Volume of short positions on a daily scale
8. Volume of short positions on a weekly scale
9. Volume of short positions more/less than average on a daily scale
10. Volume of short positions more/less than average on a weekly scale
All these data were extrapolated and manipulated using the mean and standard deviation.
The end result is a powerful tool that enables mid-long term investors and traders to analyze on-chain data through quantitative analysis.
FEATURES
The blue color area refers to the average change in data on a weekly scale. The light blue colored area indicates the monthly changes in the data. It is interesting to observe the correlation relationship between price and times when short-run data increases compared to long-run data and vice versa.
The more intense purple histograms refer to the standard deviation of the mean change in data on an annual scale. Histograms of less intense purple color refer to the standard deviation of the mean variation of data on a monthly scale. It is interesting to observe the ratio of the standard deviation between two different time periods.
This indicator can be used to perform statistical comparative analysis for manual and mid-long term investments. It can also be used to create auto trading strategies when used and integrated within an algorithm.
On-chain data are updated every 24 hours, so the timeframes to be used for analysis with this indicator are: D, 4H, 1H.

Volume Variation Index IndicatorThis tool is a quantitative tip for analysts who study volumes or create volume based trading strategies.
Like all our projects, we start with a statistical logic to which we add coding logic.
This indicator can save a huge amount of time in calculating the variation of volume between sessions .
How it work
The indicator calculates the difference between the volume of the last closing bar and the volume of the previous closing bar. It shows the difference between the trading volumes.
The session in which the trading volume is up are represented in green.
Red session represent trading volume down.
We have added a third function.
Through the User Interface the trader can activate or deactivate the variation average.
The indicator is able to calculate the average of the volume changes by representing it with a blue line.
To activate the average, simply set it to ON in the User Interface.
By default, the indicator calculates the average of the last 10 periods, but you are free to set this parameter in the User Interface.
Data access
To access the data, simply move the cursor. When you move the cursor over the green bars, the increase data will be displayed in green. By hovering the cursor over the red bars you will see the decrease data in red. By hovering the cursor over the average will show you the average data in blue.
The data is displayed in the top left corner of the indicator dashboard.
If you found this indicator helpful, please like our script.
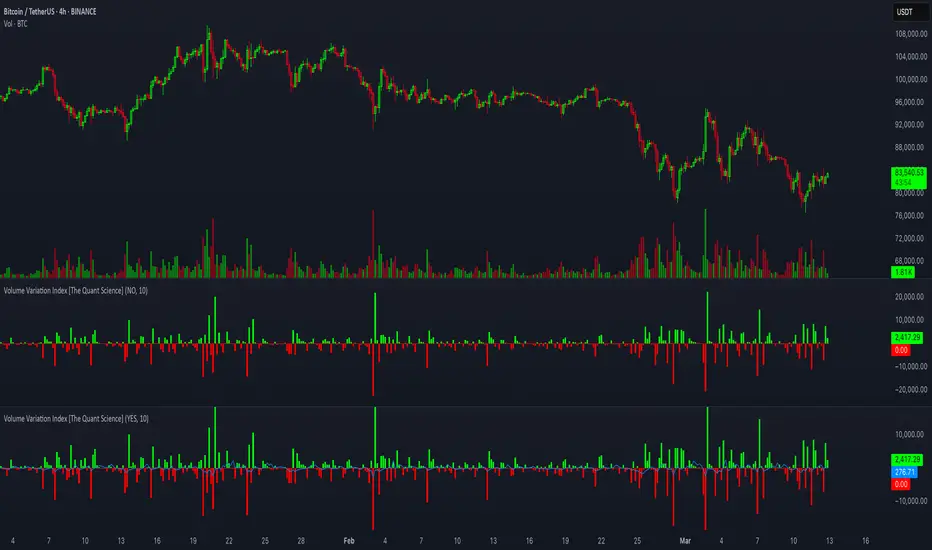
Prime Distance Frame Quant Model for Risk Reward & Pivot PointsIn this script we take all of the prime numbers up to 100 and plot them as olive lines and then consider the distance between two adjacent plots and color code these distances with the fill function. This allows us to find higher and lower prime gaps allowing us to make much more informed decisions on our risk reward for a given trade and the levels where we should consider taking profit.
The Script includes scaling for all assets and is intended to be used for crypto trading.
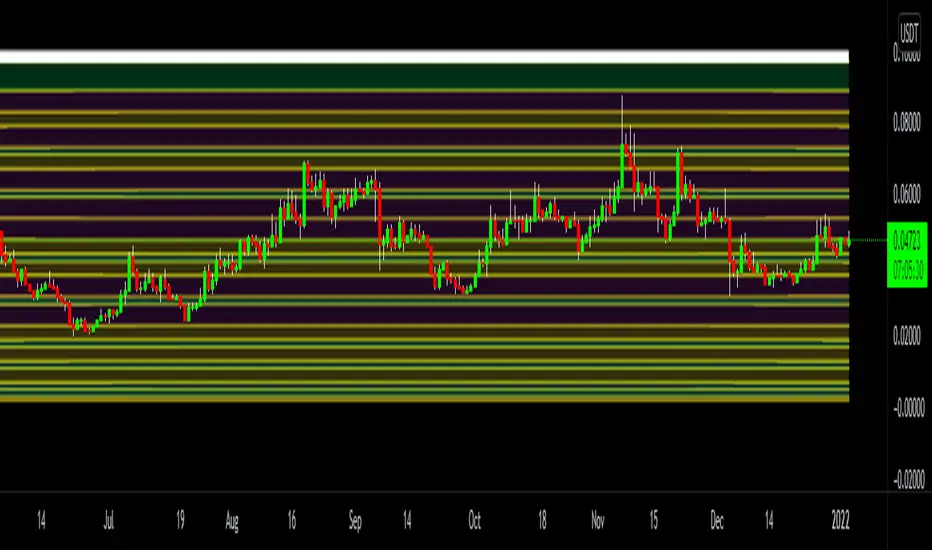
ALMA PhysicsA super simple yet elegant indicator, "ALMA Physics" calculates the derivatives of the Arnaud Legoux Moving Average (ALMA) with respect to Time. Both the ALMA parameters and the time variable can be modified in the indicator's settings.
derivatives "physics":
Blue - ALMA Velocity (dALMA / dt)
Magenta - ALMA Acceleration (d_Velocity / dt)
White - ALMA Jerk (d_Acceleration / dt)
The indicator may be used to gauge market momentum. The simple code can also be used for pedagogical purposes for anyone interested in developing indicators in TradingView.
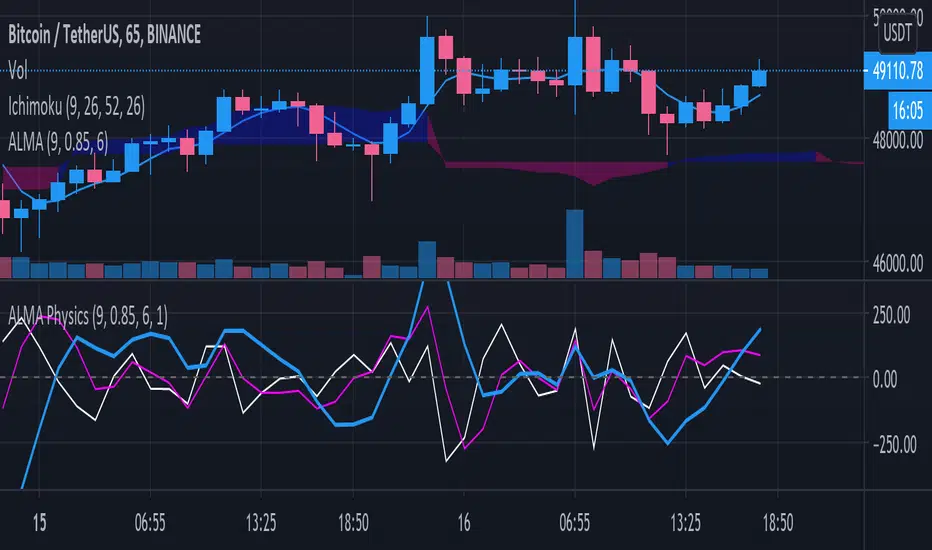
💸 Divergence Finder v1.0 by Cryptothythms💸 Divergence Finder v1.0 by Cryptothythms
Intro
This indicator is meant as a quantitative look at divergences. Special thanks to RicardoSantos (legend!) for his divergence detection script which was used as a basis to construct this.
Usage
Lime Green = Regular Bullish Divergence
Dark Green = Hidden Bullish Divergence
Red = Regular Bearish Divergence
Maroon = Hidden Bearish Divergence
Remember... divergences do not have a high probability success overall. So to mitigate that this is an attempt to source many "opinions" on the state of divergence from many different classes of indicators.
Leading indicators - Lead price action, but have a higher probability of false signals
Real time indicators - Track price action, momentum, etc in a tick by tick state. Generally a 1-3 bars lag can be present.
Lagging indicators - Lag price action a little, but offer more in terms of confirmation of the divergence
Volume indicators - Look at volume flow in different fashions and give an added dimension to divergence finding. Remember volume divergences interact with price independently. For instance volume can be going down, but price going up. Be sure to understand the relationship of volume and price action when considering these readings.
👍 Enjoying this indicator or find it useful? Please give me a like and follow! I post crypto analysis, price action strategies and free indicators regularly.
💬 Questions? Comments? Want to get access to an entire suite of proven trading indicators? Come visit us on telegram and chat, or just soak up some knowledge. We make timely posts about the market, news, and strategy everyday. Our community isn't open only to subscribers - everyone is welcome to join.
For Trialers & Chat: t.me/cryptorhythms

Mathematical Derivatives of PriceThis indicator is meant to show the Velocity (1st order derivative), Acceleration (2nd order derivative), Jerk (3rd order derivative), Snap (4th order derivative), Crackle (5th order derivative), & Pop (6th order derivative) of price. The values at the top of the indicator window are in this order from left to right. I don't particularly know how this would be used in a trading strategy, but if you're ever curious about how quickly price is moving and how much it is accelerating, then you could use this tool.
*If you only care about velocity and acceleration, and don't like how squished the window is because of the long decimal numbers then edit the "precision" value in the first line of the script to a smaller number of your choosing.*

Quantitative R-Difference Trading Strategy/SystemWorks extremely well with many stocks.
This strategy was tested on all components of the Dow since 1987. It averaged 22% a year. Slippage and commission were accounted for. 70% of the trades were profitable. The average maximum drawdown was around 15%.
This strategy has also been tested against random. The results indicate that this strategy's results are not due to random chance, but rather it has an edge in the stock market.
Does not repaint, and is not a curve fitted strategy.

DVDIQQE [DW]This is an experimental study inspired by the Quantitative Qualitative Estimation indicator designed to identify trend and wave activity.
In this study, rather than using RSI for the calculation, the Dual Volume Divergence Index oscillator is utilized.
First, the DVDI oscillator is calculated by taking the difference between PVI and its EMA, and NVI and its EMA, then taking the difference between the two results.
Optional parameters for DVDI calculation are included within this script:
- An option to use tick volume rather than real volume for the volume source
- An option to use cumulative data, which sums the movements of the oscillator from the beginning to the end of TradingView's maximum window to give a more broad picture of market sentiment
Next, two trailing levels are calculated using the average true range of the oscillator. The levels are then used to determine wave direction.
Lastly, rather than using 0 as the center line, it is instead calculated by taking a cumulative average of the oscillator.
Custom bar colors are included.
Note: For charts that have no real volume component, use tick volume as the volume source.
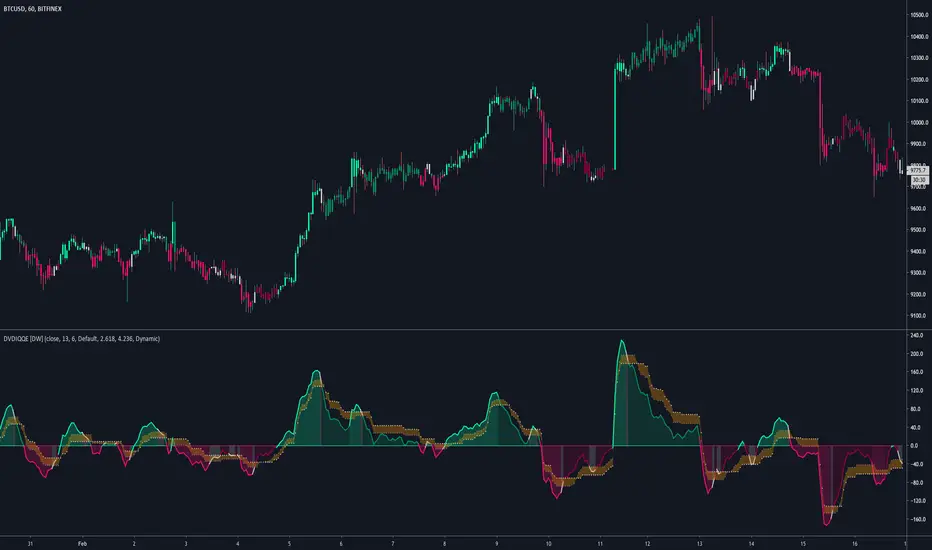
Quantitative Qualitative Estimation (QQE)The indicator QQE, is an interesting tool based on a Relative Strength Index (RSI). While the original RSI is often used as a pointer for overbought or oversold market phases, the QQE provides additional information. Use the QQE to display trend direction and trend strength .
For me this is one of the most important indicator for Trend Following.
##This QQE indicator is an improved version made by 'mladen' for Metatrader 4.
The histogram does not differ from the original QQE! The developer has adapted the scaling so that the central horizontal level is zero. It has no effect to the result, but is much more convenient to analyze the trend.
Main Signals
Background changes when the black line crosses the grey line.
Identify the trend direction
Singal turns green while the main QQE trendline is above the zero line and red while it is below.
This works best in the major timeframes like Daily or Weekly.
You can activate this signal in the settings.
NYSE:THO
Identify the trend strength
_Histogram Colors_
Green (above 10): bullish
Red (below -10): bearish
Yellow: flat
It is not a buy or sell signal when the color of the histogram changes. It only says that one side could gained the advantage.
If you use a large timeframe like Monthly, you can reduce the number of false signal by setting the SF (Slow Factor) from 5 (default) to 1.
S&P 500, Monthly
Please always remember, there is no holy grail indicator!
...but this one defines trends quite accurately.
