Price Projection by Linear RegressionPurpose:
This is a TradingView Pine Script indicator that performs a linear regression on historical price data to project potential future price levels. It's designed to help traders visualize long-term price trends and potential future price targets.
Key Components:
User Inputs:
Historical Data Points (default 1000 bars) - The amount of historical data used to calculate the trend
Years to Project (default 10 years) - How far into the future to project the price
Technical Implementation:
Uses linear regression (ta.linreg) to calculate the trend slope
Converts years to trading days using 252 trading days per year
Limits visible projection to 500 bars due to TradingView's drawing limitations
Projects prices using the formula: current_price + (slope × number_of_bars)
Visual Elements:
Blue line showing actual historical prices
Red projection line showing the expected price path
Label showing the projected price at the visible end of the line
Information table in the top-right corner showing:
Current price
Final projected price after the full time period
Limitations:
Can only display projections up to 500 bars into the future (about 2 years) due to TradingView limitations
The full projection value is still calculated and shown in the table
Past performance doesn't guarantee future results - this is a mathematical projection based on historical trends
Usage:
Traders can use this to:
Visualize potential long-term price trends
Set long-term price targets
Understand the historical trend's trajectory
Compare current prices with projected future values
Regressions

Previous Candle Sweep IndicatorThis script identifies candlesticks where the current candle's high is higher than the previous candle's high, and the current candle's low is lower than the previous candle's low. If both conditions are met, the candle's body is highlighted in blue on the chart, allowing traders to quickly spot these patterns.
Features:
Highlights candles with both higher highs and lower lows.
Uses clear visual cues (blue body) for easy identification.
Ideal for traders looking to identify specific volatility patterns or reversals.

Adjust Asset for Future Interest (Brazil)Este script foi criado para ajustar o preço de um ativo com base na taxa de juros DI11!, que reflete a expectativa do mercado para os juros futuros. O objetivo é mostrar como o valor do ativo seria influenciado se fosse diretamente ajustado pela variação dessa taxa de juros.
Como funciona?
Preço do Ativo
O script começa capturando o preço de fechamento do ativo que está sendo visualizado no gráfico. Esse é o ponto de partida para o cálculo.
Taxa de Juros DI11!
Em seguida, ele busca os valores diários da taxa DI11! no mercado. Esta taxa é uma referência de juros de curto prazo, usada para ajustes financeiros e projeções econômicas.
Fator de Ajuste
Com a taxa de juros DI11!, o script calcula um fator de ajuste simples:
Fator de Ajuste
=
1
+
DI11
100
Fator de Ajuste=1+
100
DI11
Esse fator traduz a taxa percentual em um multiplicador aplicado ao preço do ativo.
Cálculo do Ativo Ajustado
Multiplica o preço do ativo pelo fator de ajuste para obter o valor ajustado do ativo. Este cálculo mostra como o preço seria se fosse diretamente influenciado pela variação da taxa DI11!.
Exibição no Gráfico
O script plota o preço ajustado do ativo como uma linha azul no gráfico, com maior espessura para facilitar a visualização. O resultado é uma curva que reflete o impacto teórico da taxa de juros DI11! sobre o ativo.
Utilidade
Este indicador é útil para entender como as taxas de juros podem influenciar ativos financeiros de forma hipotética. Ele é especialmente interessante para analistas que desejam avaliar a relação entre o mercado de renda variável e as condições de juros no curto prazo.
This script was created to adjust the price of an asset based on the DI11! interest rate, which reflects the market's expectation for future interest rates. The goal is to show how the asset's value would be influenced if it were directly adjusted by the variation of this interest rate.
How does it work?
Asset Price
The script starts by capturing the closing price of the asset that is being viewed on the chart. This is the starting point for the calculation.
DI11! Interest Rate
The script then searches for the daily values of the DI11! rate in the market. This rate is a short-term interest reference, used for financial adjustments and economic projections.
Adjustment Factor
With the DI11! interest rate, the script calculates a simple adjustment factor:
Adjustment Factor
=
1
+
DI11
100
Adjustment Factor=1+
100
DI11
This factor translates the percentage rate into a multiplier applied to the asset's price.
Adjusted Asset Calculation
Multiplies the asset price by the adjustment factor to obtain the adjusted asset value. This calculation shows how the price would be if it were directly influenced by the variation of the DI11! rate.
Display on the Chart
The script plots the adjusted asset price as a blue line on the chart, with greater thickness for easier visualization. The result is a curve that reflects the theoretical impact of the DI11! interest rate on the asset.
Usefulness
This indicator is useful for understanding how interest rates can hypothetically influence financial assets. It is especially interesting for analysts who want to assess the relationship between the equity market and short-term interest rate conditions.

Moving Average Cross; Linear RegressionThis Pine Script is designed to display smoothed linear regression lines on a chart, with an option to adjust the regression period lengths and smoothing factor. The script calculates short-term and long-term linear regression lines based on the selected timeframe. These regression lines act as a regressed moving average cross , visually representing the interaction between the two smoothed linear regressions.
Short Regression Line: A linear regression line based on a short lookback period, colored blue for an uptrend and orange for a downtrend .
Long Regression Line: A linear regression line based on a longer lookback period, similarly colored blue for an uptrend and orange for a downtrend .
The script provides input options to adjust:
The length of short and long regression periods.
The smoothing length for the regression lines.
The timeframe for the linear regression calculations.
This tool can help traders observe the crossovers between the two smoothed linear regression lines, which are similar to moving average crossovers, but with the added benefit of regression-based smoothing to reduce noise. The color-coding allows for easy trend identification, with blue indicating an uptrend and orange indicating a downtrend.

Log Regression OscillatorThe Log Regression Oscillator transforms the logarithmic regression curves into an easy-to-interpret oscillator that displays potential cycle tops/bottoms.
🔶 USAGE
Calculating the logarithmic regression of long-term swings can help show future tops/bottoms. The relationship between previous swing points is calculated and projected further. The calculated levels are directly associated with swing points, which means every swing point will change the calculation. Importantly, all levels will be updated through all bars when a new swing is detected.
The "Log Regression Oscillator" transforms the calculated levels, where the top level is regarded as 100 and the bottom level as 0. The price values are displayed in between and calculated as a ratio between the top and bottom, resulting in a clear view of where the price is situated.
The main picture contains the Logarithmic Regression Alternative on the chart to compare with this published script.
Included are the levels 30 and 70. In the example of Bitcoin, previous cycles showed a similar pattern: the bullish parabolic was halfway when the oscillator passed the 30-level, and the top was very near when passing the 70-level.
🔹 Proactive
A "Proactive" option is included, which ensures immediate calculations of tentative unconfirmed swings.
Instead of waiting 300 bars for confirmation, the "Proactive" mode will display a gray-white dot (not confirmed swing) and add the unconfirmed Swing value to the calculation.
The above example shows that the "Calculated Values" of the potential future top and bottom are adjusted, including the provisional swing.
When the swing is confirmed, the calculations are again adjusted, showing a red dot (confirmed top swing) or a green dot (confirmed bottom swing).
🔹 Dashboard
When less than two swings are available (top/bottom), this will be shown in the dashboard.
The user can lower the "Threshold" value or switch to a lower timeframe.
🔹 Notes
Logarithmic regression is typically used to model situations where growth or decay accelerates rapidly at first and then slows over time, meaning some symbols/tickers will fit better than others.
Since the logarithmic regression depends on swing values, each new value will change the calculation. A well-fitted model could not fit anymore in the future.
Users have to check the validity of swings; for example, if the direction of swings is downwards, then the dataset is not fitted for logarithmic regression.
In the example above, the "Threshold" is lowered. However, the calculated levels are unreliable due to the swings, which do not fit the model well.
Here, the combination of downward bottom swings and price accelerates slower at first and faster recently, resulting in a non-fit for the logarithmic regression model.
Note the price value (white line) is bound to a limit of 150 (upwards) and -150 (down)
In short, logarithmic regression is best used when there are enough tops/bottoms, and all tops are around 100, and all bottoms around 0.
Also, note that this indicator has been developed for a daily (or higher) timeframe chart.
🔶 DETAILS
In mathematics, the dot product or scalar product is an algebraic operation that takes two equal-length sequences of numbers (arrays) and returns a single number, the sum of the products of the corresponding entries of the two sequences of numbers.
The usual way is to loop through both arrays and sum the products.
In this case, the two arrays are transformed into a matrix, wherein in one matrix, a single column is filled with the first array values, and in the second matrix, a single row is filled with the second array values.
After this, the function matrix.mult() returns a new matrix resulting from the product between the matrices m1 and m2.
Then, the matrix.eigenvalues() function transforms this matrix into an array, where the array.sum() function finally returns the sum of the array's elements, which is the dot product.
dot(x, y)=>
if x.size() > 1 and y.size() > 1
m1 = matrix.new()
m2 = matrix.new()
m1.add_col(m1.columns(), y)
m2.add_row(m2.rows (), x)
m1.mult (m2)
.eigenvalues()
.sum()
🔶 SETTINGS
Threshold: Period used for the swing detection, with higher values returning longer-term Swing Levels.
Proactive: Tentative Swings are included with this setting enabled.
Style: Color Settings
Dashboard: Toggle, "Location" and "Text Size"

Engulfing Candle IndicatorThis indicator helps identify Bullish and Bearish Engulfing candle patterns on your chart.
Bullish Engulfing: Occurs when a green candle completely engulfs the prior red candle, signaling potential upward momentum.
Bearish Engulfing: Occurs when a red candle completely engulfs the prior green candle, signaling potential downward momentum.
The script highlights these patterns with green triangles below the bars for Bullish Engulfing and red triangles above the bars for Bearish Engulfing.
This tool is helpful for traders who use candlestick patterns as part of their technical analysis strategy.

Salience Theory Crypto Returns (AiBitcoinTrend)The Salience Theory Crypto Returns Indicator is a sophisticated tool rooted in behavioral finance, designed to identify trading opportunities in the cryptocurrency market. Based on research by Bordalo et al. (2012) and extended by Cai and Zhao (2022), it leverages salience theory—the tendency of investors, particularly retail traders, to overemphasize standout returns.
In the crypto market, dominated by sentiment-driven retail investors, salience effects are amplified. Attention disproportionately focused on certain cryptocurrencies often leads to temporary price surges, followed by reversals as the market stabilizes. This indicator quantifies these effects using a relative return salience measure, enabling traders to capitalize on price reversals and trends, offering a clear edge in navigating the volatile crypto landscape.
👽 How the Indicator Works
Salience Measure Calculation :
👾 The indicator calculates how much each cryptocurrency's return deviates from the average return of all cryptos over the selected ranking period (e.g., 21 days).
👾 This deviation is the salience measure.
👾 The more a return stands out (salient outcome), the higher the salience measure.
Ranking:
👾 Cryptos are ranked in ascending order based on their salience measures.
👾 Rank 1 (lowest salience) means the crypto is closer to the average return and is more predictable.
👾 Higher ranks indicate greater deviation and unpredictability.
Color Interpretation:
👾 Green: Low salience (closer to average) – Trending or Predictable.
👾 Red/Orange: High salience (far from average) – Overpriced/Unpredictable.
👾 Text Gradient (Teal to Light Blue): Helps visualize potential opportunities for mean reversion trades (i.e., cryptos that may return to equilibrium).
👽 Core Features
Salience Measure Calculation
The indicator calculates the salience measure for each cryptocurrency by evaluating how much its return deviates from the average market return over a user-defined ranking period. This measure helps identify which assets are trending predictably and which are likely to experience a reversal.
Dynamic Ranking System
Cryptocurrencies are dynamically ranked based on their salience measures. The ranking helps differentiate between:
Low Salience Cryptos (Green): These are trending or predictable assets.
High Salience Cryptos (Red): These are overpriced or deviating significantly from the average, signaling potential reversals.
👽 Deep Dive into the Core Mathematics
Salience Theory in Action
Salience theory explains how investors, particularly in the crypto market, tend to prefer assets with standout returns (salient outcomes). This behavior often leads to overpricing of assets with high positive returns and underpricing of those with standout negative returns. The indicator captures these deviations to anticipate mean reversions or trend continuations.
Salience Measure Calculation
// Calculate the average return
avgReturn = array.avg(returns)
// Calculate salience measure for each symbol
salienceMeasures = array.new_float()
for i = 0 to array.size(returns) - 1
ret = array.get(returns, i)
salienceMeasure = math.abs(ret - avgReturn) / (math.abs(ret) + math.abs(avgReturn) + 0.1)
array.push(salienceMeasures, salienceMeasure)
Dynamic Ranking
Cryptos are ranked in ascending order based on their salience measures:
Low Ranks: Cryptos with low salience (predictable, trending).
High Ranks: Cryptos with high salience (unpredictable, likely to revert).
👽 Applications
👾 Trend Identification
Identify cryptocurrencies that are currently trending with low salience measures (green). These assets are likely to continue their current direction, making them good candidates for trend-following strategies.
👾 Mean Reversion Trading
Cryptos with high salience measures (red to light blue) may be poised for a mean reversion. These assets are likely to correct back towards the market average.
👾 Reversal Signals
Anticipate potential reversals by focusing on high-ranked cryptos (red). These assets exhibit significant deviation and are prone to price corrections.
👽 Why It Works in Crypto
The cryptocurrency market is dominated by retail investors prone to sentiment-driven behavior. This leads to exaggerated price movements, making the salience effect a powerful predictor of reversals.
👽 Indicator Settings
👾 Ranking Period : Number of bars used to calculate the average return and salience measure.
Higher Values: Smooth out short-term volatility.
Lower Values: Make the ranking more sensitive to recent price movements.
👾 Number of Quantiles : Divide ranked assets into quantile groups (e.g., quintiles).
Higher Values: More detailed segmentation (deciles, percentiles).
Lower Values: Broader grouping (quintiles, quartiles).
👾 Portfolio Percentage : Percentage of the portfolio allocated to each selected asset.
Enter a percentage (e.g., 20 for 20%), automatically converted to a decimal (e.g., 0.20).
Disclaimer: This information is for entertainment purposes only and does not constitute financial advice. Please consult with a qualified financial advisor before making any investment decisions.

Linear Regression Channel [TradingFinder] Existing Trend Line🔵 Introduction
The Linear Regression Channel indicator is one of the technical analysis tool, widely used to identify support, resistance, and analyze upward and downward trends.
The Linear Regression Channel comprises five main components : the midline, representing the linear regression line, and the support and resistance lines, which are calculated based on the distance from the midline using either standard deviation or ATR.
This indicator leverages linear regression to forecast price changes based on historical data and encapsulates price movements within a price channel.
The upper and lower lines of the channel, which define resistance and support levels, assist traders in pinpointing entry and exit points, ultimately aiding better trading decisions.
When prices approach these channel lines, the likelihood of interaction with support or resistance levels increases, and breaking through these lines may signal a price reversal or continuation.
Due to its precision in identifying price trends, analyzing trend reversals, and determining key price levels, the Linear Regression Channel indicator is widely regarded as a reliable tool across financial markets such as Forex, stocks, and cryptocurrencies.
🔵 How to Use
🟣 Identifying Entry Signals
One of the primary uses of this indicator is recognizing buy signals. The lower channel line acts as a support level, and when the price nears this line, the likelihood of an upward reversal increases.
In an uptrend : When the price approaches the lower channel line and signs of upward reversal (e.g., reversal candlesticks or high trading volume) are observed, it is considered a buy signal.
In a downtrend : If the price breaks the lower channel line and subsequently re-enters the channel, it may signal a trend change, offering a buying opportunity.
🟣 Identifying Exit Signals
The Linear Regression Channel is also used to identify sell signals. The upper channel line generally acts as a resistance level, and when the price approaches this line, the likelihood of a price decrease increases.
In an uptrend : Approaching the upper channel line and observing weakness in the uptrend (e.g., declining volume or reversal patterns) indicates a sell signal.
In a downtrend : When the price reaches the upper channel line and reverses downward, this is considered a signal to exit trades.
🟣 Analyzing Channel Breakouts
The Linear Regression Channel allows traders to identify price breakouts as strong signals of potential trend changes.
Breaking the upper channel line : Indicates buyer strength and the likelihood of a continued uptrend, often accompanied by increased trading volume.
Breaking the lower channel line : Suggests seller dominance and the possibility of a continued downtrend, providing a strong sell signal.
🟣 Mean Reversion Analysis
A key concept in using the Linear Regression Channel is the tendency for prices to revert to the midline of the channel, which acts as a dynamic moving average, reflecting the price's equilibrium over time.
In uptrends : Significant deviations from the midline increase the likelihood of a price retracement toward the midline.
In downtrends : When prices deviate considerably from the midline, a return toward the midline can be used to identify potential reversal points.
🔵 Settings
🟣 Time Frame
The time frame setting enables users to view higher time frame data on a lower time frame chart. This feature is especially useful for traders employing multi-time frame analysis.
🟣 Regression Type
Standard : Utilizes classical linear regression to draw the midline and channel lines.
Advanced : Produces similar results to the standard method but may provide slightly different alignment on the chart.
🟣 Scaling Type
Standard Deviation : Suitable for markets with stable volatility.
ATR (Average True Range) : Ideal for markets with higher volatility.
🟣 Scaling Coefficients
Larger coefficients create broader channels for broader trend analysis.
Smaller coefficients produce tighter channels for precision analysis.
🟣 Channel Extension
None : No extension.
Left: Extends lines to the left to analyze historical trends.
Right : Extends lines to the right for future predictions.
Both : Extends lines in both directions.
🔵 Conclusion
The Linear Regression Channel indicator is a versatile and powerful tool in technical analysis, providing traders with support, resistance, and midline insights to better understand price behavior. Its advanced settings, including time frame selection, regression type, scaling options, and customizable coefficients, allow for tailored and precise analysis.
One of its standout advantages is its ability to support multi-time frame analysis, enabling traders to view higher time frame data within a lower time frame context. The option to use scaling methods like ATR or standard deviation further enhances its adaptability to markets with varying volatility.
Designed to identify entry and exit signals, analyze mean reversion, and assess channel breakouts, this indicator is suitable for a wide range of markets, including Forex, stocks, and cryptocurrencies. By incorporating this tool into your trading strategy, you can make more informed decisions and improve the accuracy of your market predictions.

AiTrend Pattern Matrix for kNN Forecasting (AiBitcoinTrend)The AiTrend Pattern Matrix for kNN Forecasting (AiBitcoinTrend) is a cutting-edge indicator that combines advanced mathematical modeling, AI-driven analytics, and segment-based pattern recognition to forecast price movements with precision. This tool is designed to provide traders with deep insights into market dynamics by leveraging multivariate pattern detection and sophisticated predictive algorithms.
👽 Core Features
Segment-Based Pattern Recognition
At its heart, the indicator divides price data into discrete segments, capturing key elements like candle bodies, high-low ranges, and wicks. These segments are normalized using ATR-based volatility adjustments to ensure robustness across varying market conditions.
AI-Powered k-Nearest Neighbors (kNN) Prediction
The predictive engine uses the kNN algorithm to identify the closest historical patterns in a multivariate dictionary. By calculating the distance between current and historical segments, the algorithm determines the most likely outcomes, weighting predictions based on either proximity (distance) or averages.
Dynamic Dictionary of Historical Patterns
The indicator maintains a rolling dictionary of historical patterns, storing multivariate data for:
Candle body ranges, High-low ranges, Wick highs and lows.
This dynamic approach ensures the model adapts continuously to evolving market conditions.
Volatility-Normalized Forecasting
Using ATR bands, the indicator normalizes patterns, reducing noise and enhancing the reliability of predictions in high-volatility environments.
AI-Driven Trend Detection
The indicator not only predicts price levels but also identifies market regimes by comparing current conditions to historically significant highs, lows, and midpoints. This allows for clear visualizations of trend shifts and momentum changes.
👽 Deep Dive into the Core Mathematics
👾 Segment-Based Multivariate Pattern Analysis
The indicator analyzes price data by dividing each bar into distinct segments, isolating key components such as:
Body Ranges: Differences between the open and close prices.
High-Low Ranges: Capturing the full volatility of a bar.
Wick Extremes: Quantifying deviations beyond the body, both above and below.
Each segment contributes uniquely to the predictive model, ensuring a rich, multidimensional understanding of price action. These segments are stored in a rolling dictionary of patterns, enabling the indicator to reference historical behavior dynamically.
👾 Volatility Normalization Using ATR
To ensure robustness across varying market conditions, the indicator normalizes patterns using Average True Range (ATR). This process scales each component to account for the prevailing market volatility, allowing the algorithm to compare patterns on a level playing field regardless of differing price scales or fluctuations.
👾 k-Nearest Neighbors (kNN) Algorithm
The AI core employs the kNN algorithm, a machine-learning technique that evaluates the similarity between the current pattern and a library of historical patterns.
Euclidean Distance Calculation:
The indicator computes the multivariate distance across four distinct dimensions: body range, high-low range, wick low, and wick high. This ensures a comprehensive and precise comparison between patterns.
Weighting Schemes: The contribution of each pattern to the forecast is either weighted by its proximity (distance) or averaged, based on user settings.
👾 Prediction Horizon and Refinement
The indicator forecasts future price movements (Y_hat) by predicting logarithmic changes in the price and projecting them forward using exponential scaling. This forecast is smoothed using a user-defined EMA filter to reduce noise and enhance actionable clarity.
👽 AI-Driven Pattern Recognition
Dynamic Dictionary of Patterns: The indicator maintains a rolling dictionary of N multivariate patterns, continuously updated to reflect the latest market data. This ensures it adapts seamlessly to changing market conditions.
Nearest Neighbor Matching: At each bar, the algorithm identifies the most similar historical pattern. The prediction is based on the aggregated outcomes of the closest neighbors, providing confidence levels and directional bias.
Multivariate Synthesis: By combining multiple dimensions of price action into a unified prediction, the indicator achieves a level of depth and accuracy unattainable by single-variable models.
Visual Outputs
Forecast Line (Y_hat_line):
A smoothed projection of the expected price trend, based on the weighted contribution of similar historical patterns.
Trend Regime Bands:
Dynamic high, low, and midlines highlight the current market regime, providing actionable insights into momentum and range.
Historical Pattern Matching:
The nearest historical pattern is displayed, allowing traders to visualize similarities
👽 Applications
Trend Identification:
Detect and follow emerging trends early using dynamic trend regime analysis.
Reversal Signals:
Anticipate market reversals with high-confidence predictions based on historically similar scenarios.
Range and Momentum Trading:
Leverage multivariate analysis to understand price ranges and momentum, making it suitable for both breakout and mean-reversion strategies.
Disclaimer: This information is for entertainment purposes only and does not constitute financial advice. Please consult with a qualified financial advisor before making any investment decisions.

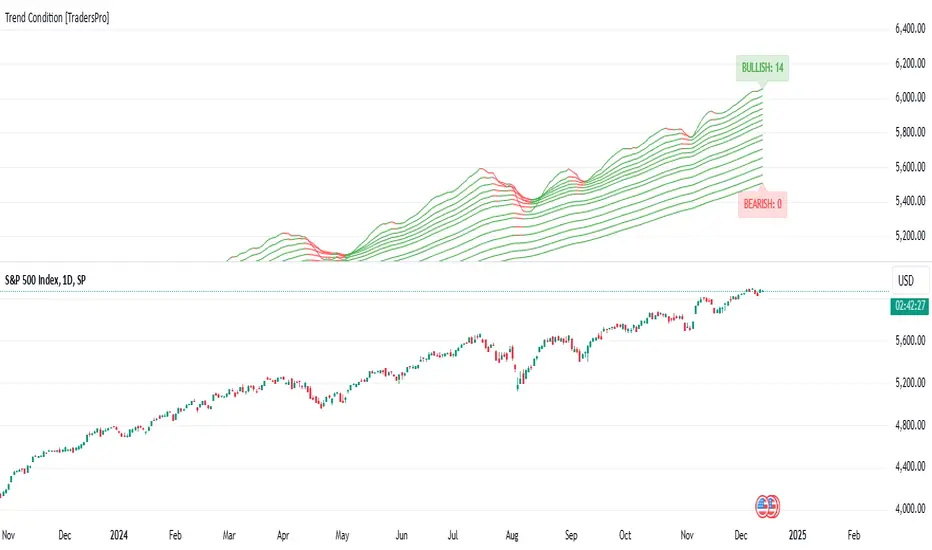
Trend Condition [TradersPro]
OVERVIEW
The Trend Condition Indicator measures the strength of the bullish or bearish trend by using a ribbon pattern of exponential moving averages and scoring system. Trend cycles naturally expand and contract as a normal part of the cycle. It is the rhythm of the market. Perpetual expansion and contraction of trend.
As trend cycles develop the indicator shows a compression of the averages. These compression zones are key locations as trends typically expand from there. The expansion of trend can be up or down.
As the trend advances the ribbon effect of the indicator can be seen as each average expands with the price action. Once they have “fanned” the probability of the current trend slowing is high.
This can be used to recognize a powerful trend may be concluding. Traders can tighten stops, exit positions or utilize other prudent strategies.
CONCEPTS
Each line will display green if it is higher than the prior period and red if it is lower than the prior period. If the average is green it is considered bullish and will score one point in the bullish display. Red lines are considered bearish and will score one point in the bearish display.
The indicator can then be used at a quick glance to see the number of averages that are bullish and the number that are bearish.
A trader may use these on any tradable instrument. They can be helpful in stock portfolio management when used with an index like the S&P 500 to determine the strength of the current market trend. This may affect trade decisions like possession size, stop location and other risk factors.
Scatter PlotThe Price Volume Scatter Plot publication aims to provide intrabar detail as a Scatter Plot .
🔶 USAGE
A dot is drawn at every intrabar close price and its corresponding volume , as can seen in the following example:
Price is placed against the white y-axis, where volume is represented on the orange x-axis.
🔹 More detail
A Scatter Plot can be beneficial because it shows more detail compared with a Volume Profile (seen at the right of the Scatter Plot).
The Scatter Plot is accompanied by a "Line of Best Fit" (linear regression line) to help identify the underlying direction, which can be helpful in interpretation/evaluation.
It can be set as a screener by putting multiple layouts together.
🔹 Easier Interpretation
Instead of analysing the 1-minute chart together with volume, this can be visualised in the Scatter Plot, giving a straightforward and easy-to-interpret image of intrabar volume per price level.
One of the scatter plot's advantages is that volumes at the same price level are added to each other.
A dot on the scatter plot represents the cumulated amount of volume at that particular price level, regardless of whether the price closed one or more times at that price level.
Depending on the setting "Direction" , which sets the direction of the Volume-axis, users can hoover to see the corresponding price/volume.
🔹 Highest Intrabar Volume Values
Users can display up to 5 last maximum intrabar volume values, together with the intrabar timeframe (Res)
🔹 Practical Examples
When we divide the recent bar into three parts, the following can be noticed:
Price spends most of its time in the upper part, with relative medium-low volume, since the intrabar close prices are mostly situated in the upper left quadrant.
Price spends a shorter time in the middle part, with relative medium-low volume.
Price moved rarely below 61800 (the lowest part), but it was associated with high volume. None of the intrabar close prices reached the lowest area, and the price bounced back.
In the following example, the latest weekly candle shows a rejection of the 45.8 - 48.5K area, with the highest volume at the 45.8K level.
The next three successive candles show a declining maximum intrabar volume, after which the price broke through the 45.8K area.
🔹 Visual Options
There are many visual options available.
🔹 Change Direction
The Scatter Plot can be set in 4 different directions.
🔶 NOTES
🔹 Notes
The script uses the maximum available resources to draw the price/volume dots, which are 500 boxes and 500 labels. When the population size exceeds 1000, a warning is provided ( Not all data is shown ); otherwise, only the population size is displayed.
The Scatter Plot ideally needs a chart which contains at least 100 bars. When it contains less, a warning will be shown: bars < 100, not all data is shown
🔹 LTF Settings
When 'Auto' is enabled ( Settings , LTF ), the LTF will be the nearest possible x times smaller TF than the current TF. When 'Premium' is disabled, the minimum TF will always be 1 minute to ensure TradingView plans lower than Premium don't get an error.
Examples with current Daily TF (when Premium is enabled):
500 : 3 minute LTF
1500 (default): 1 minute LTF
5000: 30 seconds LTF (1 minute if Premium is disabled)
🔶 SETTINGS
Direction: Direction of Volume-axis; Left, Right, Up or Down
🔹 LTF
LTF: LTF setting
Auto + multiple: Adjusts the initial set LTF
Premium: Enable when your TradingView plan is Premium or higher
🔹 Character
Character: Style of Price/Volume dot
Fade: Increasing this number fades dots at lower price/volume
Color
🔹 Linear Regression
Toggle (enable/disable), color, linestyle
Center Cross: Toggle, color
🔹 Background Color
Fade: Increasing this number fades the background color near lower values
Volume: Background color that intensifies as the volume value on the volume-axis increases
Price: Background color that intensifies as the price value on the price-axis increases
🔹 Labels
Size: Size of price/volume labels
Volume: Color for volume labels/axis
Price: Color for price labels/axis
Display Population Size: Show the population size + warning if it exceeds 1000
🔹 Dashboard
Location: Location of dashboard
Size: Text size
Display LTF: Display the intrabar Lower Timeframe used
Highest IB volume: Display up to 5 previous highest Intrabar Volume values

Logarithmic Regression AlternativeLogarithmic regression is typically used to model situations where growth or decay accelerates rapidly at first and then slows over time. Bitcoin is a good example.
𝑦 = 𝑎 + 𝑏 * ln(𝑥)
With this logarithmic regression (log reg) formula 𝑦 (price) is calculated with constants 𝑎 and 𝑏, where 𝑥 is the bar_index .
Instead of using the sum of log x/y values, together with the dot product of log x/y and the sum of the square of log x-values, to calculate a and b, I wanted to see if it was possible to calculate a and b differently.
In this script, the log reg is calculated with several different assumed a & b values, after which the log reg level is compared to each Swing. The log reg, where all swings on average are closest to the level, produces the final 𝑎 & 𝑏 values used to display the levels.
🔶 USAGE
The script shows the calculated logarithmic regression value from historical swings, provided there are enough swings, the price pattern fits the log reg model, and previous swings are close to the calculated Top/Bottom levels.
When the price approaches one of the calculated Top or Bottom levels, these levels could act as potential cycle Top or Bottom.
Since the logarithmic regression depends on swing values, each new value will change the calculation. A well-fitted model could not fit anymore in the future.
Swings are based on Weekly bars. A Top Swing, for example, with Swing setting 30, is the highest value in 60 weeks. Thirty bars at the left and right of the Swing will be lower than the Top Swing. This means that a confirmation is triggered 30 weeks after the Swing. The period will be automatically multiplied by 7 on the daily chart, where 30 becomes 210 bars.
Please note that the goal of this script is not to show swings rapidly; it is meant to show the potential next cycle's Top/Bottom levels.
🔹 Multiple Levels
The script includes the option to display 3 Top/Bottom levels, which uses different values for the swing calculations.
Top: 'high', 'maximum open/close' or 'close'
Bottom: 'low', 'minimum open/close' or 'close'
These levels can be adjusted up/down with a percentage.
Lastly, an "Average" is included for each set, which will only be visible when "AVG" is enabled, together with both Top and Bottom levels.
🔹 Notes
Users have to check the validity of swings; the above example only uses 1 Top Swing for its calculations, making the Top level unreliable.
Here, 1 of the Bottom Swings is pretty far from the bottom level, changing the swing settings can give a more reliable bottom level where all swings are close to that level.
Note the display was set at "Logarithmic", it can just as well be shown as "Regular"
In the example below, the price evolution does not fit the logarithmic regression model, where growth should accelerate rapidly at first and then slows over time.
Please note that this script can only be used on a daily timeframe or higher; using it at a lower timeframe will show a warning. Also, it doesn't work with bar-replay.
🔶 DETAILS
The code gathers data from historical swings. At the last bar, all swings are calculated with different a and b values. The a and b values which results in the smallest difference between all swings and Top/Bottom levels become the final a and b values.
The ranges of a and b are between -20.000 to +20.000, which means a and b will have the values -20.000, -19.999, -19.998, -19.997, -19.996, ... -> +20.000.
As you can imagine, the number of calculations is enormous. Therefore, the calculation is split into parts, first very roughly and then very fine.
The first calculations are done between -20 and +20 (-20, -19, -18, ...), resulting in, for example, 4.
The next set of calculations is performed only around the previous result, in this case between 3 (4-1) and 5 (4+1), resulting in, for example, 3.9. The next set goes even more in detail, for example, between 3.8 (3.9-0.1) and 4.0 (3.9 + 0.1), and so on.
1) -20 -> +20 , then loop with step 1 (result (example): 4 )
2) 4 - 1 -> 4 +1 , then loop with step 0.1 (result (example): 3.9 )
3) 3.9 - 0.1 -> 3.9 +0.1 , then loop with step 0.01 (result (example): 3.93 )
4) 3.93 - 0.01 -> 3.93 +0.01, then loop with step 0.001 (result (example): 3.928)
This ensures complicated calculations with less effort.
These calculations are done at the last bar, where the levels are displayed, which means you can see different results when a new swing is found.
Also, note that this indicator has been developed for a daily (or higher) timeframe chart.
🔶 SETTINGS
Three sets
High/Low
• color setting
• Swing Length settings for 'High' & 'Low'
• % adjustment for 'High' & 'Low'
• AVG: shows average (when both 'High' and 'Low' are enabled)
Max/Min (maximum open/close, minimum open/close)
• color setting
• Swing Length settings for 'Max' & 'Min'
• % adjustment for 'Max' & 'Min'
• AVG: shows average (when both 'Max' and 'Min' are enabled)
Close H/Close L (close Top/Bottom level)
• color setting
• Swing Length settings for 'Close H' & 'Close L'
• % adjustment for 'Close H' & 'Close L'
• AVG: shows average (when both 'Close H' and 'Close L' are enabled)
Show Dashboard, including Top/Bottom levels of the desired source and calculated a and b values.
Show Swings + Dot size

N-Degree Moment-Based Adaptive Detection🙏🏻 N-Degree Moment-Based Adaptive Detection (NDMBAD) method is a generalization of MBAD since the horizontal line fit passing through the data's mean can be simply treated as zero-degree polynomial regression. We can extend the MBAD logic to higher-degree polynomial regression.
I don't think I need to talk a lot about the thing there; the logic is really the same as in MBAD, just hit the link above and read if you want. The only difference is now we can gather cumulants not only from the horizontal mean fit (degree = 0) but also from higher-order polynomial regression fit, including linear regression (degree = 1).
Why?
Simply because residuals from the 0-degree model don't contain trend information, and while in some cases that's exactly what you need, in other cases, you want to model your trend explicitly. Imagine your underlying process trends in a steady manner, and you want to control the extreme deviations from the process's core. If you're going to use 0-degree, you'll be treating this beautiful steady trend as a residual itself, which "constantly deviates from the process mean." It doesn't make much sense.
How?
First, if you set the length to 0, you will end up with the function incrementally applied to all your data starting from bar_index 0. This can be called the expanding window mode. That's the functionality I include in all my scripts lately (where it makes sense). As I said in the MBAD description, choosing length is a matter of doing business & applied use of my work, but I think I'm open to talk about it.
I don't see much sense in using degree > 1 though (still in research on it). If you have dem curves, you can use Fourier transform -> spectral filtering / harmonic regression (regression with Fourier terms). The job of a degree > 0 is to model the direction in data, and degree 1 gets it done. In mean reversion strategies, it means that you don't wanna put 0-degree polynomial regression (i.e., the mean) on non-stationary trending data in moving window mode because, this way, your residuals will be contaminated with the trend component.
By the way, you can send thanks to @aaron294c , he said like mane MBAD is dope, and it's gonna really complement his work, so I decided to drop NDMBAD now, gonna be more useful since it covers more types of data.
I wanned to call it N-Order Moment Adaptive Detection because it abbreviates to NOMAD, which sounds cool and suits me well, because when I perform as a fire dancer, nomad style is one of my outfits. Burning Man stuff vibe, you know. But the problem is degree and order really mean two different things in the polynomial context, so gotta stay right & precise—that's the priority.
∞

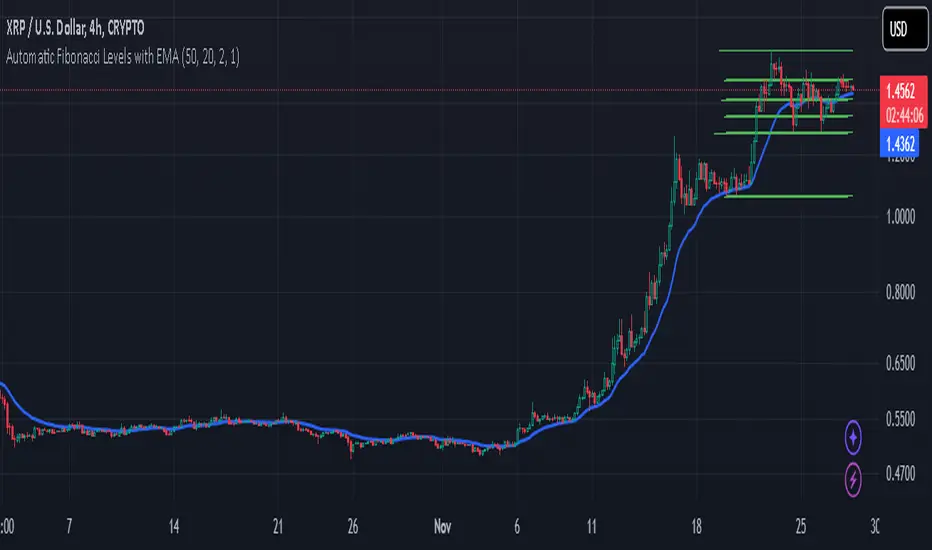
Automatic Fibonacci Levels with EMAAutomatic Fibonacci Levels with EMA
Description:
This script automatically calculates and displays Fibonacci retracement levels based on the highest and lowest prices over a dynamic lookback period. The Fibonacci levels are recalculated on every bar to adapt to price changes, providing an ongoing analysis of key support and resistance areas.
The Fibonacci levels are dynamically colored to reflect the trend direction, determined by the position of the price relative to the Exponential Moving Average (EMA). When the market is in an uptrend (price above EMA), Fibonacci levels are displayed in green, and in a downtrend (price below EMA), they are shown in red. This color coding helps traders quickly identify the current market direction.
Key Features:
Dynamic Fibonacci Levels: Automatically adjusts Fibonacci retracement levels based on recent price action, recalculated with each new bar.
EMA Trend Confirmation: The trend is confirmed by the position of the price relative to the 20-period EMA. Fibonacci levels are color-coded to reflect this trend.
Customizable Lookback Period: Adjust the base lookback period (default 50) and scale it according to your preferred timeframe for more or less sensitivity to recent price action.
Flexible Fibonacci Duration: The Fibonacci levels remain on the chart for a customizable duration (default 2 bars), allowing for visual clarity while adapting to new price action.
Timeframe Scaling: The script automatically adjusts the lookback period based on a scaling factor, making it suitable for different timeframes.
How to Use:
Use the Fibonacci levels to identify potential support and resistance zones based on the market's current price range.
Combine the trend color coding with your own strategy to enhance decision-making, whether for long or short entries.
Adjust the Lookback Period and Fibonacci Duration based on your trading style and timeframe preferences.
This script provides an automatic and customizable way to visualize Fibonacci retracements in a dynamic manner, helping traders make informed decisions based on trend direction and key price levels.
Note: As with any trading tool, always use proper risk management and test the script before using it in live trading.
SynthesisDeFi - Anchored TWAPA simple Anchored TWAP created by Oliver Fujimori
Key Concept
TWAP is calculated by taking the average of multiple asset prices at regular time intervals across a set period. By averaging out these prices, TWAP helps smooth out short-term fluctuations, providing a more stable price representation over time.
Advantages of TWAP
Simplicity: The TWAP calculation is straightforward and computationally light, making it practical for on-chain calculations in DeFi.
Protection Against Flash Loan Attacks: By averaging prices over time, TWAP offers some protection against temporary price manipulations commonly seen with flash loans.
Uses and Benefits of TWAP
Reducing Market Impact for Large Orders: TWAP is used as a strategy for executing large orders by breaking them into smaller parts over a period, ensuring that the average execution price is close to the TWAP value, reducing the risk of price manipulation.
Minimizing Slippage: In DeFi, TWAP provides a stable price reference by averaging prices over time, making it less susceptible to sudden price changes (slippage) that can occur in highly volatile markets.
Protection Against Manipulation: TWAP prices are less vulnerable to flash loan attacks and sudden price spikes since they rely on multiple price points over a period rather than a single spot price.

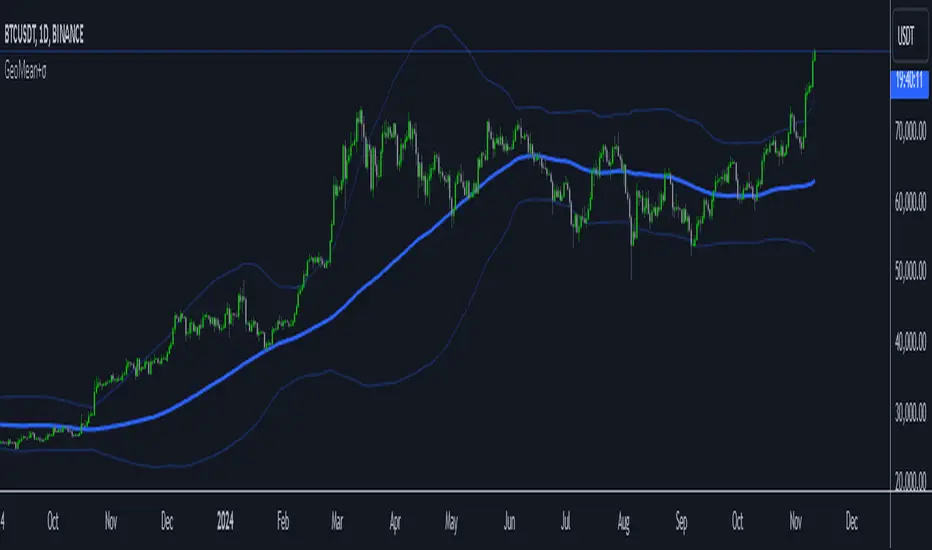
GeoMean+The Geometric Moving Average (GMA) with Sigma Bands is a technical indicator that combines trend following and volatility measurement. The blue center line represents the GMA, while the upper and lower bands (light blue) show price volatility using standard deviations (sigma). Traders can use this indicator for both trend following and mean reversion strategies. For trend following, enter long when price crosses above the GMA and short when it crosses below, using the bands as profit targets. For mean reversion, look for buying opportunities when price touches the lower band and selling opportunities at the upper band, with the GMA as your profit target. The indicator includes alerts for band touches and crosses, providing real-time notifications with symbol, timeframe, current price, and band level information. The default 100-period setting works well for daily charts, but can be adjusted shorter (20-50) for intraday trading or longer (200+) for position trading. Wider bands indicate higher volatility (use smaller positions), while narrower bands suggest lower volatility (larger positions possible). For best results, confirm signals with volume and avoid trading against strong trends. Stop losses can be placed beyond the touched band or at the GMA line, depending on your risk tolerance.
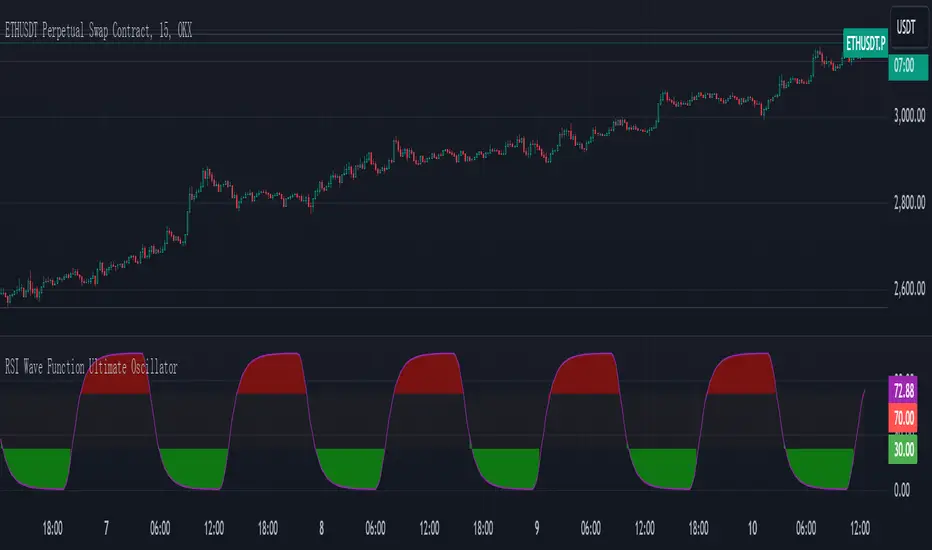
RSI Wave Function Ultimate OscillatorEnglish Explanation of the "RSI Wave Function Ultimate Oscillator" Pine Script Code
Understanding the Code
Purpose:
This Pine Script code creates a custom indicator that combines the Relative Strength Index (RSI) with a wave function to potentially provide more nuanced insights into market dynamics.
Key Components:
* Wave Function: This is a custom calculation that introduces a sinusoidal wave component to the price data. The frequency parameter controls the speed of the oscillation, and the decay factor determines how quickly the influence of past prices diminishes.
* Smoothed Signal: The wave function is applied to the closing price to create a smoothed signal, which is essentially a price series modulated by a sine wave.
* RSI: The traditional RSI is then calculated on this smoothed signal, providing a measure of the speed and change of price movements relative to recent price changes.
Calculation Steps:
* Wave Function Calculation:
* A sinusoidal wave is generated based on the bar index and the frequency parameter.
* The wave is combined with the closing price using a weighted average, where the decay factor determines the weight given to previous values.
* RSI Calculation:
* The RSI is calculated on the smoothed signal using a standard RSI formula.
* Plotting:
* The RSI values are plotted on a chart, along with horizontal lines at 70 and 30 to indicate overbought and oversold conditions.
* The area between the RSI line and the overbought/oversold lines is filled with color to visually represent the market condition.
Interpretation and Usage
* Wave Function: The wave function introduces cyclical patterns into the price data, which can help identify potential turning points or momentum shifts.
* RSI: The RSI provides a measure of the speed and change of price movements relative to recent price changes. When applied to the smoothed signal, it can help identify overbought and oversold conditions, as well as potential divergences between price and momentum.
* Combined Indicator: The combination of the wave function and RSI aims to provide a more sensitive and potentially earlier indication of market reversals.
* Signals:
* Crossovers: Crossovers of the RSI line above or below the overbought/oversold lines can be used to generate buy or sell signals.
* Divergences: Divergences between the price and the RSI can indicate a weakening trend.
* Oscillations: The amplitude and frequency of the oscillations in the RSI can provide insights into the strength and duration of market trends.
How it Reflects Market Volatility
* Amplified Volatility: The wave function can amplify the volatility of the price data, making it easier to identify potential turning points.
* Smoothing: The decay factor helps to smooth out short-term fluctuations, allowing the indicator to focus on longer-term trends.
* Sensitivity: The combination of the wave function and RSI can make the indicator more sensitive to changes in market momentum.
In essence, this custom indicator attempts to enhance traditional RSI analysis by incorporating a cyclical component that can potentially provide earlier signals of market reversals.
Note: The effectiveness of this indicator will depend on various factors, including the specific market, time frame, and the chosen values for the frequency and decay parameters. It is recommended to conduct thorough backtesting and optimize the parameters to suit your specific trading strategy.
Half Trend Regression [AlgoAlpha]Introducing the Half Trend Regression indicator by AlgoAlpha, a cutting-edge tool designed to provide traders with precise trend detection and reversal signals. This indicator uniquely combines linear regression analysis with ATR-based channel offsets to deliver a dynamic view of market trends. Ideal for traders looking to integrate statistical methods into their analysis to improve trade timing and decision-making.
Key Features
🎨 Customizable Appearance : Adjust colors for bullish (green) and bearish (red) trends to match your charting preferences.
🔧 Flexible Parameters : Configure amplitude, channel deviation, and linear regression length to tailor the indicator to different time frames and trading styles.
📈 Dynamic Trend Line : Utilizes linear regression of high, low, and close prices to calculate a trend line that adapts to market movements.
🚀 Trend Direction Signals : Provides clear visual signals for potential trend reversals with plotted arrows on the chart.
📊 Adaptive Channels : Incorporates ATR-based channel offsets to account for market volatility and highlight potential support and resistance zones.
🔔 Alerts : Set up alerts for bullish or bearish trend changes to stay informed of market shifts in real-time.
How to Use
🛠 Add the Indicator : Add the Half Trend Regression indicator to your chart from the TradingView library. Access the settings to customize parameters such as amplitude, channel deviation, and linear regression length to suit your trading strategy.
📊 Analyze the Trend : Observe the plotted trend line and the filled areas under it. A green fill indicates a bullish trend, while a red fill indicates a bearish trend.
🔔 Set Alerts : Use the built-in alert conditions to receive notifications when a trend reversal is detected, allowing you to react promptly to market changes.
How It Works
The Half Trend Regression indicator calculates linear regression lines for the high, low, and close prices over a specified period to determine the general direction of the market. It then computes moving averages and identifies the highest and lowest points within these regression lines to establish a dynamic trend line. The trend direction is determined by comparing the moving averages and previous price levels, updating as new data becomes available. To account for market volatility, the indicator calculates channels above and below the trend line, offset by a multiple of half the Average True Range (ATR). These channels help visualize potential support and resistance zones. The area under the trend line is filled with color corresponding to the current trend direction—green for bullish and red for bearish. When the trend direction changes, the indicator plots arrows on the chart to signal a potential reversal, and alerts can be set up to notify you. By integrating linear regression and ATR-based channels, the indicator provides a comprehensive view of market trends and potential reversal points, aiding traders in making informed decisions.
Enhance your trading strategy with the Half Trend Regression indicator by AlgoAlpha and gain a statistical edge in the markets! 🌟📊
Linear Regression Channel UltimateKey Features and Benefits
Logarithmic scale option for improved analysis of long-term trends and volatile markets
Activity-based profiling using either touch count or volume data
Customizable channel width and number of profile fills
Adjustable number of most active levels displayed
Highly configurable visual settings for optimal chart readability
Why Logarithmic Scale Matters
The logarithmic scale option is a game-changer for analyzing assets with exponential growth or high volatility. Unlike linear scales, log scales represent percentage changes consistently across the price range. This allows for:
Better visualization of long-term trends
More accurate comparison of price movements across different price levels
Improved analysis of volatile assets or markets experiencing rapid growth
How It Works
The indicator calculates a linear regression line based on the specified period
Upper and lower channel lines are drawn at a customizable distance from the regression line
The space between the channel lines is divided into a user-defined number of levels
For each level, the indicator tracks either:
- The number of times price touches the level (touch count method)
- The total volume traded when price is at the level (volume method)
The most active levels are highlighted based on this activity data
Understanding Touch Count vs Volume
Touch count method: Useful for identifying key support/resistance levels based on price action alone
Volume method: Provides insight into levels where the most trading activity occurs, potentially indicating stronger support/resistance
Practical Applications
Trend identification and strength assessment
Support and resistance level discovery
Entry and exit point optimization
Volume profile analysis for improved market structure understanding
This Linear Regression Channel indicator combines powerful statistical analysis with flexible visualization options, making it an invaluable tool for traders and analysts across various timeframes and markets. Its unique features, especially the logarithmic scale and activity profiling, provide deeper insights into market behavior and potential turning points.

Alpine Predictive BandsAlpine Predictive Bands - ADX & Trend Projection is an advanced indicator crafted to estimate potential price zones and trend strength by integrating dynamic support/resistance bands, ADX-based confidence scoring, and linear regression-based price projections. Designed for adaptive trend analysis, this tool combines multi-timeframe ADX insights, volume metrics, and trend alignment for improved confidence in trend direction and reliability.
Key Calculations and Components:
Linear Regression for Price Projection:
Purpose: Provides a trend-based projection line to illustrate potential price direction.
Calculation: The Linear Regression Centerline (LRC) is calculated over a user-defined lookbackPeriod. The slope, representing the rate of price movement, is extended forward using predictionLength. This projected path only appears when the confidence score is 70% or higher, revealing a white dotted line to highlight high-confidence trends.
Adaptive Prediction Bands:
Purpose: ATR-based bands offer dynamic support/resistance zones by adjusting to volatility.
Calculation: Bands are calculated using the Average True Range (ATR) over the lookbackPeriod, multiplied by a volatilityMultiplier to adjust the width. These shaded bands expand during higher volatility, guiding traders in identifying flexible support/resistance zones.
Confidence Score (ADX, Volume, and Trend Alignment):
Purpose: Reflects the reliability of trend projections by combining ADX, volume status, and EMA alignment across multiple timeframes.
ADX Component: ADX values from the current timeframe and two higher timeframes assess trend strength on a broader scale. Strong ADX readings across timeframes boost the confidence score.
Volume Component: Volume strength is marked as “High” or “Low” based on a moving average, signaling trend participation.
Trend Alignment: EMA alignment across timeframes indicates “Bullish” or “Bearish” trends, confirming overall trend direction.
Calculation: ADX, volume, and trend alignment integrate to produce a confidence score from 0% to 100%. When the score exceeds 70%, the white projection line is activated, underscoring high-confidence trend continuations.
User Guide
Projection Line: The white dotted line, which appears only when the confidence score is 70% or higher, highlights a high-confidence trend.
Prediction Bands: Adaptive bands provide potential support/resistance zones, expanding with market volatility to help traders visualize price ranges.
Confidence Score: A high score indicates a stronger, more reliable trend and can support trend-following strategies.
Settings
Prediction Length: Determines the forward length of the projection.
Lookback Period: Sets the data range for calculating regression and ATR.
Volatility Multiplier: Adjusts the width of bands to match volatility levels.
Disclaimer: This indicator is for educational purposes and does not guarantee future price outcomes. Additional analysis is recommended, as trading carries inherent risks.

Volume-Supported Linear Regression Trend TableThe "Volume-Supported Linear Regression Trend Table" (VSLRT Table) script helps traders identify buy and sell opportunities by analyzing price trends and volume dynamics across multiple timeframes. It uses linear regression to calculate the trend direction and volume strength, visually representing this data with color-coded signals on the chart and in a table. Green signals indicate buying opportunities, while red signals suggest selling, with volume acting as confirmation of trend strength. Traders can use these signals for both short and long positions, with additional risk management and multi-timeframe validation to enhance the strategy.
------------------------------------------------------------------------------
To use the "Volume-Supported Linear Regression Trend Table" (VSLRT Table) script in a trading strategy, you would incorporate it into your decision-making process to identify potential buy and sell opportunities based on the trend and volume dynamics. Here’s how you could apply it for trading:
1. Understanding the Key Elements:
Trend Direction (Slope of Price): The script uses linear regression to assess the trend direction of the price. If the price slope is positive, the asset is likely in an uptrend; if it's negative, the asset is in a downtrend.
Volume-Backed Signals: The buy or sell signal is not only based on the price trend but also on volume. Volume is crucial in validating the strength of a trend; large volume often indicates strong interest in a direction.
2. Interpreting the Table and Signals:
The table displayed at the bottom-right of your TradingView chart gives you a clear overview of the trends across different timeframes:
Trend Colors:
Green hues (e.g., ccol11, ccol12, etc.): Indicate a buying trend supported by volume.
Red hues (e.g., ccol21, ccol22, etc.): Indicate a selling trend supported by volume.
Gray: Indicates weak or unclear trends where no decisive direction is present.
Buy/Sell Signals:
The script plots triangles on the chart:
Upward triangle below the bar signals a potential buy.
Downward triangle above the bar signals a potential sell.
3. Building a Trading Strategy:
Here’s how you can incorporate the script’s information into a trading strategy:
Buy Signal (Long Entry):
Look for green triangles (indicating a buy signal) below a bar.
Confirm that the trend color in the table for the relevant timeframe is green, which shows that the buy signal is supported by strong volume.
Ensure that the price is in an uptrend (positive slope) and that volume is increasing on upward moves, as this indicates buying interest.
Execute a long position when these conditions align.
Sell Signal (Short Entry):
Look for red triangles (indicating a sell signal) above a bar.
Confirm that the trend color in the table for the relevant timeframe is red, which shows that the sell signal is supported by strong volume.
Ensure that the price is in a downtrend (negative slope) and that volume is increasing on downward moves, indicating selling pressure.
Execute a short position when these conditions align.
Exiting the Trade:
Exit a long position when a sell signal (red triangle) appears, or when the trend color in the table shifts to red.
Exit a short position when a buy signal (green triangle) appears, or when the trend color in the table shifts to green.
4. Multi-Timeframe Confirmation:
The script provides trends across multiple timeframes (tf1, tf2, tf3), which can help in validating your trade:
Short-Term Trading: Use shorter timeframes (e.g., 3, 5 minutes) for intraday trades. If both short and medium timeframes align in trend direction (e.g., both showing green), it strengthens the signal.
Longer-Term Trading: If you are trading on a higher timeframe (e.g., daily or weekly), confirm that the lower timeframes align with your intended trade direction.
5. Adding Risk Management:
Stop-Loss: Place stop-losses below recent lows (for long trades) or above recent highs (for short trades) to minimize risk.
Take Profit: Consider taking profit at key support/resistance levels or based on a fixed risk-to-reward ratio (e.g., 2:1).
Example Strategy Flow:
For Long (Buy) Trade:
Signal: A green triangle appears below a candle (Buy signal).
Trend Confirmation: Check that the color in the table for your selected timeframe is green, confirming the trend is supported by volume.
Execute Long: Enter a long trade if the price is trending upward (positive price slope).
Exit Long: Exit when a red triangle appears above a candle (Sell signal) or if the trend color shifts to red in the table.
For Short (Sell) Trade:
Signal: A red triangle appears above a candle (Sell signal).
Trend Confirmation: Check that the color in the table for your selected timeframe is red, confirming the trend is supported by volume.
Execute Short: Enter a short trade if the price is trending downward (negative price slope).
Exit Short: Exit when a green triangle appears below a candle (Buy signal) or if the trend color shifts to green in the table.
6. Fine-Tuning:
Backtesting: Before trading live, use TradingView’s backtesting features to test the strategy on historical data and optimize the settings (e.g., length of linear regression, timeframe).
Combine with Other Indicators: Use this strategy alongside other technical indicators (e.g., RSI, MACD) for better confirmation.
In summary, the script helps identify trends with volume support, giving more confidence in buy/sell decisions. Combining these signals with risk management and multi-timeframe analysis can create a solid trading strategy.

Linear Regression ChannelLinear Regression Channel Indicator
Overview:
The Linear Regression Channel Indicator is a versatile tool designed for TradingView to help traders visualize price trends and potential reversal points. By calculating and plotting linear regression channels, bands, and future projections, this indicator provides comprehensive insights into market dynamics. It can highlight overbought and oversold conditions, identify trend direction, and offer visual cues for future price movements.
Key Features:
Linear Regression Bands:
Input: Plot Linear Regression Bands
Description: Draws bands based on linear regression calculations, representing overbought and oversold levels.
Customizable Parameters:
Length: Defines the look-back period for the regression calculation.
Deviation: Determines the width of the bands based on standard deviations.
Linear Regression Channel:
Input: Plot Linear Regression Channel
Description: Plots a channel using linear regression to visualize the main trend.
Customizable Parameters:
Channel Length: Defines the look-back period for the channel calculation.
Deviation: Determines the channel's width.
Future Projection Channel:
Input: Plot Future Projection of Linear Regression
Description: Projects a linear regression channel into the future, aiding in forecasting potential price movements.
Customizable Parameters:
Length: Defines the look-back period for the projection calculation.
Deviation: Determines the width of the projected channel.
Arrow Direction Indicator:
Input: Plot Arrow Direction
Description: Displays directional arrows based on future projection, indicating expected price movement direction.
Color-Coded Price Bars:
Description: Colors the price bars based on their position within the regression bands or channel, providing a heatmap-like visualization.
Dynamic Visualization:
Colors: Uses a gradient color scheme to highlight different conditions, such as uptrend, downtrend, and mid-levels.
Labels and Markers: Plots visual markers for significant price levels and conditions, enhancing interpretability.
Usage Notes
Setting the Length:
Adjust the look-back period (Length) to suit the timeframe you are analyzing. Shorter lengths are responsive to recent price changes, while longer lengths provide a broader view of the trend.
Interpreting Bands and Channels:
The bands and channels help identify overbought and oversold conditions. Price moving above the upper band or channel suggests overbought conditions, while moving below the lower band or channel indicates oversold conditions.
Using the Future Projection:
Enable the future projection channel to anticipate potential price movements. This can be particularly useful for setting target prices or stop-loss levels based on expected trends.
Arrow Direction Indicator:
Use the arrow direction indicator to quickly grasp the expected price movement direction. An upward arrow indicates a potential uptrend, while a downward arrow suggests a potential downtrend.
Color-Coded Price Bars:
The color of the price bars changes based on their relative position within the regression bands or channel. This heatmap visualization helps quickly identify bullish, bearish, and neutral conditions.
Dynamic Adjustments:
The indicator dynamically adjusts its visual elements based on user settings and market conditions, ensuring that the most relevant information is always displayed.
Visual Alerts:
Pay attention to the labels and markers on the chart indicating significant events, such as crossovers and breakouts. These visual alerts help in making informed trading decisions.
The Linear Regression Channel Indicator is a powerful tool for traders looking to enhance their technical analysis. By offering multiple regression-based visualizations and customizable parameters, it helps identify key market conditions, trends, and potential reversal points. Whether you are a day trader or a long-term investor, this indicator can provide valuable insights to improve your trading strategy.

Leading Indicator by Parag RautBreakdown of the Leading Indicator:
Linear Regression (LRC):
A linear regression line is used to estimate the current trend direction. When the price is above or below the regression line, it indicates whether the price is deviating from its mean, signaling potential reversals.
Rate of Change (ROC):
ROC measures the momentum of the price over a set period. By using thresholds (positive or negative), we predict that the price will continue in the same direction if momentum is strong enough.
Leading Indicator Calculation:
We calculate the difference between the price and the linear regression line. This is normalized using the standard deviation of price over the same period, giving us a leading signal based on price divergence from the mean trend.
The leading indicator is used to forecast changes in price behavior by identifying when the price is either stretched too far from the mean (indicating a potential reversal) or showing strong momentum in a particular direction (predicting trend continuation).
Buy and Sell Signals:
Buy Signal: Generated when ROC is above a threshold and the leading indicator shows the price is above the regression line.
Sell Signal: Generated when ROC is below a negative threshold and the leading indicator shows the price is below the regression line.
Visual Representation:
The indicator oscillates around zero. Values above zero signal potential upward price movements, while values below zero signal potential downward movements.
Background colors highlight potential buy (green) and sell (red) areas based on our conditions.
How It Works as a Leading Indicator:
This indicator attempts to predict price movements before they happen by combining the trend (via linear regression) and momentum (via ROC).
When the price significantly diverges from the trendline and momentum supports a continuation, it signals a potential entry point (either buy or sell).
It is leading in that it anticipates price movement before it becomes fully apparent in the market.
Next Steps:
You can adjust the length of the linear regression and ROC to fine-tune the indicator’s sensitivity to your trading style.
This can be combined with other indicators or used as part of a larger strategy
