Candlesticks ANN for Stock Markets TF : 1WHello, this script consists of training candlesticks with Artificial Neural Networks (ANN).
In addition to the first series, candlesticks' bodies and wicks were also introduced as training inputs.
The inputs are individually trained to find the relationship between the subsequent historical value of all candlestick values 1.(High,Low,Close,Open)
The outputs are adapted to the current values with a simple forecast code.
Once the OHLC value is found, the exponential moving averages of 5 and 20 periods are used.
Reminder : OHLC = (Open + High + Close + Low ) / 4
First version :
Script is designed for S&P 500 Indices,Funds,ETFs, especially S&P 500 Stocks,and for all liquid Stocks all around the World.
NOTE: This script is only suitable for 1W time-frame for Stocks.
The average training error rates are less than 5 per thousand for each candlestick variable. (Average Error < 0.005 )
I've just finished it and haven't tested it in detail.
So let's use it carefully as a supporter.
Best regards !
Search in scripts for "Candlestick"

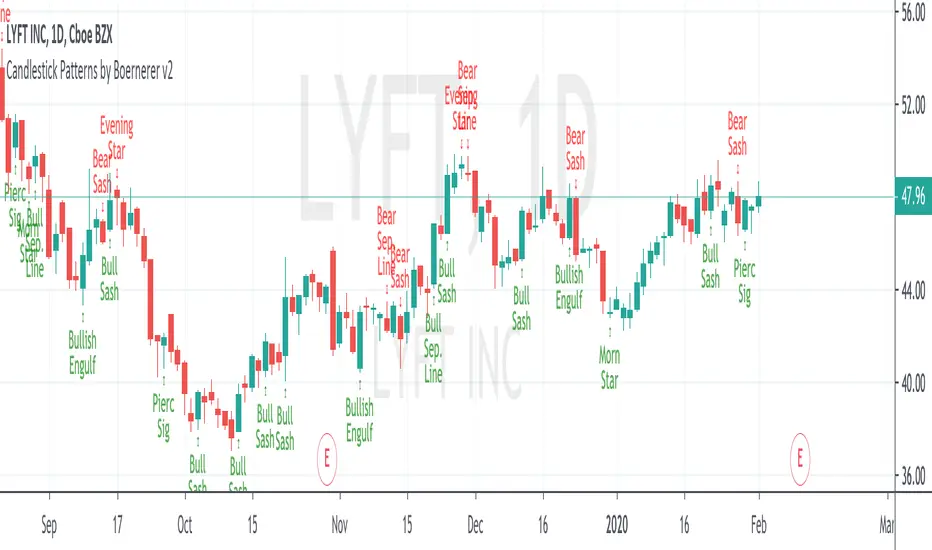
Candlestick Patterns by Boernerer v2New version 2 of my modifications of the original candlestick pattern script by Robert Waddell.
- Added window (= gaps) detection
- Added Bear/Bull Sash
- Added Bear/Bull Counter Attack
- Added Bear/Bull Seperating Line
- Modified candlestick ID code
- Added Lookback period instead of SMA (TLine) for trend detection
Candlestick Suite–(Phoenix) it colors the major Reversal candlesticks
BullEngulf or BearEngulf or Engulfing() -> DARK_ORANGE
PiercingLine or DarkCloudCover -> CYAN
BullishHarami or BearishHarami -> YELLOW
BullishInsideBar or BearishInsideBar -> WHITE

Candlestick Pattern Detector - Vijay PrasadOverview:
This Pine Script v6 indicator is designed to detect and label key candlestick patterns on TradingView charts. It provides real-time visual markers for major bullish and bearish reversal signals, aiding traders in decision-making.
Usefulness:
✅ Saves time by automating candlestick pattern detection.
✅ Reduces manual chart analysis errors.
✅ Works across all markets & timeframes.
✅ Enhances trading strategies with accurate signals.
Candlestick Patterns Recognises:
Bullish Engulfing – A strong bullish reversal pattern.
Bearish Engulfing – Indicates a potential downtrend.
Hammer – Suggests a market bottom or reversal.
Shooting Star – A bearish reversal signal at the top of an uptrend.
Doji – Signals market indecision and possible trend change.
Key Functions:
Automated Pattern Visible
Identifies candlestick patterns dynamically and plots them on the chart.
Visual Labels for Patterns
Labels to indicate specific candlestick formations.
Labels appear only when a valid pattern is detected, avoiding unnecessary clutter.
Buy/Sell Signal
Plots buy signals at bullish patterns and sell signals at bearish patterns.
Helps traders recognize trend reversals and entry/exit points.
Bullish Engulfing Pattern (Green Label)
What it means: A bullish engulfing pattern typically signals a potential reversal from a downtrend to an uptrend. The current candle fully engulfs the previous candle, signaling strong buying interest.
Identifying Candlestick Patterns on the Chart
How to use it:
Entry: Look for a green label (bullish engulfing) at the bottom of the chart. When it appears, consider entering a long position (buy).
Confirmation: To increase reliability, wait for confirmation by observing if price moves above the high of the bullish engulfing candle.
Exit: Exit when the trend shows signs of reversing or take profit at predefined levels (e.g., resistance or a risk-to-reward ratio).
Bearish Engulfing Pattern (Red Label)
What it means: A bearish engulfing pattern is a signal of a potential reversal from an uptrend to a downtrend. The current candle fully engulfs the previous candle, signaling strong selling pressure.
How to use it:
Entry: Look for a red label (bearish engulfing) at the top of the chart. When it appears, consider entering a short position (sell).
Confirmation: Wait for the price to move below the low of the bearish engulfing candle to confirm the bearish trend.
Exit: Close the trade when the price reaches support levels or the trend shows signs of reversing.
Doji Pattern (Blue Circle)
What it means: A Doji candle signals market indecision. It represents a balance between buyers and sellers, often marking a potential reversal or consolidation point.
How to use it:
Entry: If the Doji appears after a strong trend (bullish or bearish), wait for the next candle to break above or below the Doji's high or low. This can signal a continuation or reversal.
Confirmation: You can look for additional indicators like moving averages, RSI, or MACD for confirmation before taking any action.
Exit: Exit when the price shows clear momentum in your entry direction.
Hammer Pattern (Orange Triangle)
What it means: The hammer pattern is a bullish reversal pattern that appears after a downtrend. It suggests that sellers pushed the price down during the session, but buyers managed to push the price back up.
How to use it:
Entry: When a hammer appears, consider entering a long position (buy). The price should move above the hammer's high for confirmation.
Confirmation: Look for strong volume and a follow-up bullish candle to confirm the reversal.
Exit: Set a target based on the next resistance level, or use a trailing stop to lock in profits.
Using Candlestick Patterns with Other Indicators
To increase your chances of success, combine candlestick patterns with other technical indicators.
Here are some ideas:
RSI (Relative Strength Index): Use RSI to check whether the market is overbought or oversold. A bullish engulfing in an oversold market could indicate a stronger buy signal, and a bearish engulfing in an overbought market could indicate a stronger sell signal.
Moving Averages (e.g., 50 EMA, 200 EMA): Confirm trend direction. If the candlestick pattern aligns with the direction of the moving averages, it can give a stronger signal.
MACD (Moving Average Convergence Divergence): Use MACD to confirm momentum and potential trend changes. If a candlestick pattern aligns with a MACD crossover, it strengthens the signal.
Volume: Look for higher-than-average volume when a pattern appears. This can give you additional confirmation that the market is reacting strongly.
Practice and Refine
It's important to practice using the candlestick patterns in a demo account or backtest them to see how they perform under different market conditions. Over time, you can adjust the settings and patterns to fit your trading style and preferences.

Candlestick Patterns detection and backtester [TrendX_]INTRODUCTION:
The Candlestick Patterns detection and backtester is designed to empower traders by identifying and analyzing candlestick patterns. Leveraging the robust Pine Script's add-in “All Candlestick Patterns”, this indicator meticulously scans the market for candlestick formations, offering insights into potential market movements. With its backtesting capabilities, we evaluate historical data to present traders with performance metrics such as win rates, net profit, and profit factors for each pattern. This allows traders to make informed decisions based on empirical evidence. The customizable settings, including trend filters and exit conditions, provide a tailored experience, adapting to various trading styles and strategies.
CREDIT:
This indicator is powered by the Pinescript add-in, *All Candlestick Patterns*, which provides a comprehensive library of candlestick formations.
TABLE USAGE:
The indicator features a detailed usage table that presents backtested results of all candlestick patterns. This includes:
Win Rates: The percentage of trades that resulted in a profit.
Net Profit: The total profit after subtracting losses from gains.
Profit Factor: A measure of the indicator’s profitability (gross profit / gross loss).
Total Trades: The total number of trades taken for every candlestick pattern's appearance.
CHART CANDLESTICK USAGE:
The indicator integrates candlestick pattern detections directly into the chart, displaying:
Pattern Detections: Each detected pattern is marked on the chart.
Win Rates: The win rate of each pattern is shown in brackets next to the detection.
CHART SETTINGS:
Users can customize the indicator with a variety of trend filters and settings:
Trend Filters: Apply filters based on SMA50, SMA200, Supertrend, and RSI threshold to refine pattern detections.
Exit Condition: Set an exit condition based on the crossing of a simple moving average of customizable length.
Visibility: Choose to show or hide the candlestick patterns’ detections on the chart.

Candlestick Patterns + windows Mod by BoernererMy modifications for the candlestick pattern script by Robert Waddell.
Changelog
- Added window (= gaps) detection
- Added Bear/Bull Sash
- Modified candlestick ID code
- Candlesticks will only be displayed if above or below TLine
Originally created by Robert Waddell with special thanks to repo32 for his candlestick ID code, DavidR for EMA code and Chris Moody for barcolor code.
Enjoy and would love if you improve it further!

Candlestick Patterns [DW]This is a simple study designed to track multiple candlestick patterns. Custom alerts included.

Candlestick ScannerThis is a large compilation of candlestick patterns that allows the user to detect up to 42 different bullish and bearish patterns.
This script is intended to be a Pine Editor version of the one I normally used on a different platform, so your feedback is more than welcome to help me improve it, as fine tuning is ongoing.
New patterns will be added in the next couple of days.
Happy trading!

Candlestick MathThis is an updated version of my previous post, with the option to specify which symbol you want it to show up on.
This is a script I made to do what is called candlestick math (if you're not sure, Google it). It will take the first open, the last close, and the highest high and lowest low from a range of candlesticks, and plot it on top of the chart.
Unfortunately, there is no way to make it so you can move it with your mouse, and the bar numbering is not the same as the regular drawing tools, so to figure out what the line number is, create a new script with the text:
study("Plot N")
plot(n)
This will create another chart that will show you the bar numbers that correspond to the script's bar numbers. From there, figure out where you want to start the candlestick math, and enter that number in the "Start" field in the inputs for this script.

Candlestick Math(Re-post with better graph)
This is a script I made to do what is called candlestick math (if you're not sure, Google it). It will take the first open, the last close, and the highest high and lowest low from a range of candlesticks, and plot it on top of the chart.
Unfortunately, there is no way to make it so you can move it with your mouse, and the bar numbering is not the same as the regular drawing tools, so to figure out what the line number is, create a new script with the text:
study("Plot N")
plot(n)
This will create another chart that will show you the bar numbers that correspond to the script's bar numbers. From there, figure out where you want to start the candlestick math, and enter that number in the "Start" field in the inputs for this script.

Candlestick MathThis is a script I made to do what is called candlestick math (if you're not sure, Google it). It will take the first open, the last close, and the highest high and lowest low from a range of candlesticks, and plot it on top of the chart.
Unfortunately, there is no way to make it so you can move it with your mouse, and the bar numbering is not the same as the regular drawing tools, so to figure out what the line number is, create a new script with the text:
study("Plot N")
plot(n)
This will create another chart that will show you the bar numbers that correspond to the script's bar numbers. From there, figure out where you want to start the candlestick math, and enter that number in the "Start" field in the inputs for this script.

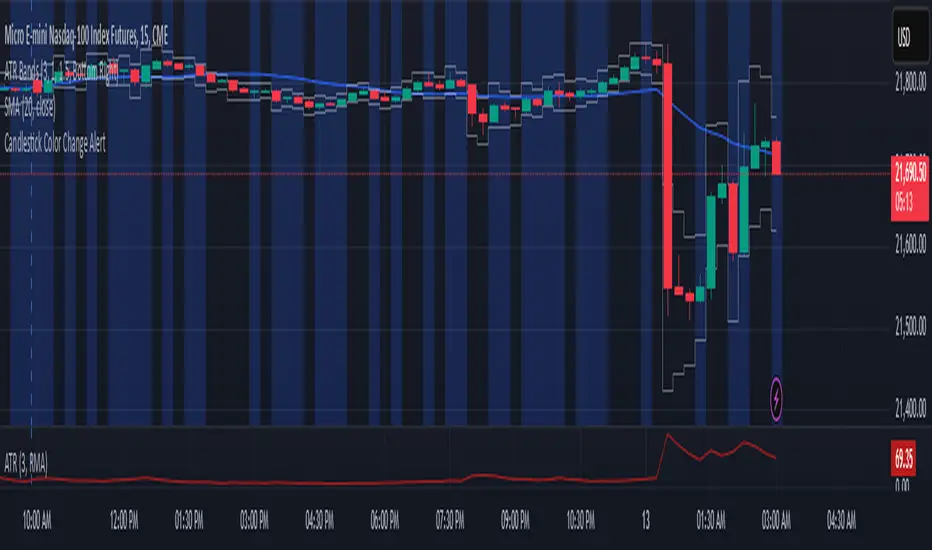
Candlestick Color Change AlertIt is an alert for change of candlestick color.
Identifies Candle Type
A candle is bullish if the closing price is higher than the opening price.
A candle is bearish if the closing price is lower than the opening price.
Detects a Color Change
The script checks if the current candle is bullish while the previous candle was bearish, or vice versa.
If a change is detected, an alert is triggered.
Triggers an Alert
Users receive an alert notification whenever a candlestick color change occurs.
Alerts can be set for popup, email, mobile push, or webhook notifications.
Visual Highlighting (Optional)
The script can also apply a background color (blue) on the chart to visually mark color changes.
Candlestick DataCandlestick Data Indicator
The Candlestick Data indicator provides a comprehensive overview of key metrics for analyzing price action and volume in real-time. This overlay indicator displays essential candlestick data and calculations directly on your chart, offering an all-in-one toolkit for traders seeking in-depth insights.
Key Features:
Price Metrics: View the daily high, low, close, and percentage change.
Volume Insights: Analyze volume, relative volume, and volume buzz for breakout or consolidation signals.
Range Analysis: Includes closing range, distance from low of day (LoD), and percentage change in daily range expansion.
Advanced Metrics: Calculate ADR% (Average Daily Range %), ATR (Average True Range), and % from 52-week high.
Moving Averages: Supports up to four customizable moving averages (EMA or SMA) with distance from price.
Market Context: Displays the sector and industry group for the asset.
This indicator is fully customizable, allowing you to toggle on or off specific metrics to suit your trading style. Designed for active traders, it brings critical data to your fingertips, streamlining decision-making and enhancing analysis.
Perfect for momentum, swing, and day traders looking to gain a data-driven edge!

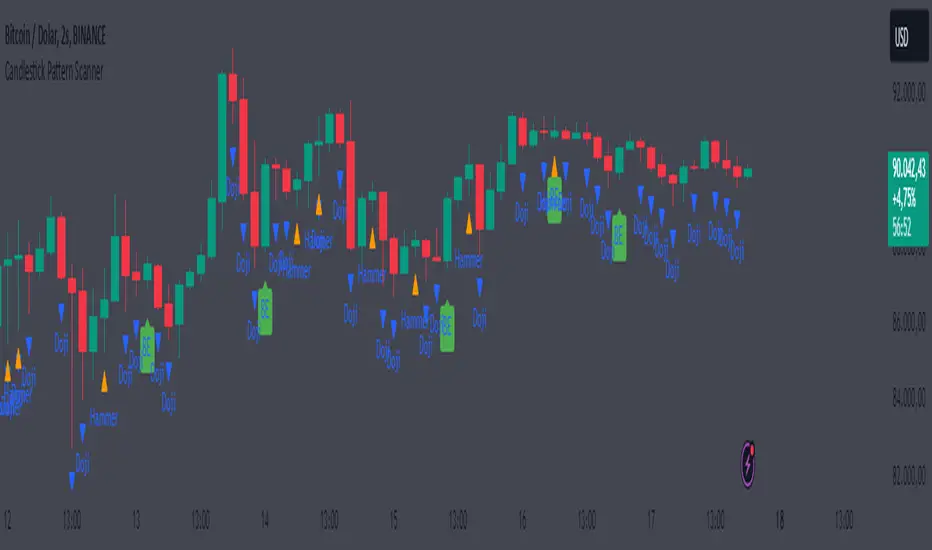
Candlestick Pattern ScannerCandlestick Pattern Scanner
This indicator identifies popular candlestick patterns on the chart and provides visual and alert-based support for traders. Based on technical analysis, it provides insights into potential trend reversals or continuation signals in price action. The following patterns are detected and marked:
1. Bullish Engulfing
Definition: Considered a strong bullish signal. A small red candle is followed by a large green candle that completely engulfs the previous one.
Chart Display: Marked with a green arrow below the price bar.
Alert Message: "Bullish Engulfing Pattern Detected!"
2. Bearish Engulfing
Definition: Considered a strong bearish signal. A small green candle is followed by a large red candle that completely engulfs the previous one.
Chart Display: Marked with a red arrow above the price bar.
Alert Message: "Bearish Engulfing Pattern Detected!"
3. Doji
Definition: Indicates indecision in the market. The candlestick has an opening and closing price that are almost the same, forming a very small body.
Chart Display: Marked with a blue triangle below the price bar.
Alert Message: "Doji Pattern Detected!"
4. Hammer
Definition: Can signal a strong bullish reversal. It has a long lower shadow and a small body, often appearing at the end of a downtrend.
Chart Display: Marked with an orange triangle below the price bar.
Alert Message: "Hammer Pattern Detected!"
5. Shooting Star
Definition: Can signal a strong bearish reversal. It has a long upper shadow and a small body, often appearing at the end of an uptrend.
Chart Display: Marked with a purple triangle above the price bar.
Alert Message: "Shooting Star Pattern Detected!"
Features:
Visual Support: Patterns are clearly marked on the chart using distinct shapes (arrows and triangles).
Alerts: Receive real-time notifications through TradingView’s alert system when a pattern is detected.
Versatility: Useful for identifying both trend reversals and continuation signals.
User-Friendly: Patterns are easily distinguishable with unique color coding.
Purpose:
This indicator helps traders identify potential reversal points or strong trend beginnings in price action. It can be used as a supportive tool in scalping, swing trading, or long-term investment strategies.
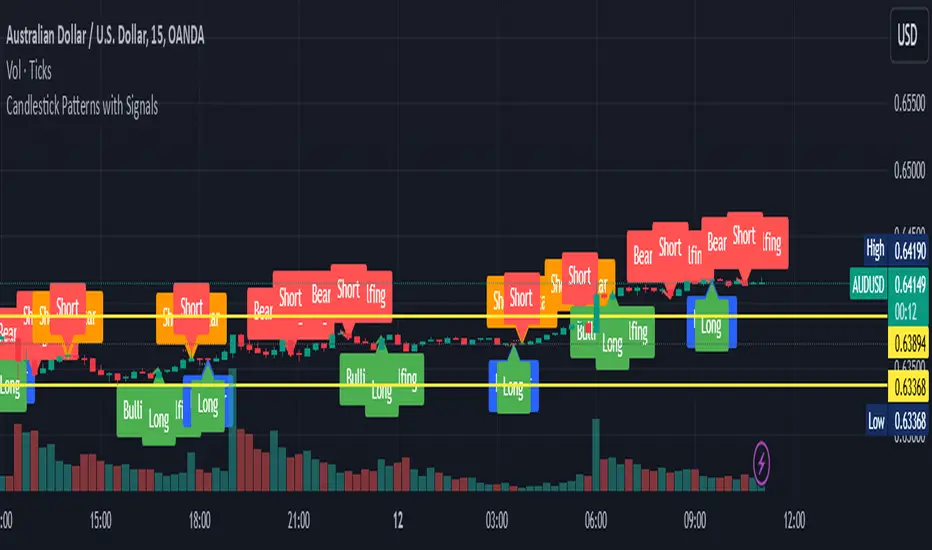
Candlestick Patterns with SignalsIdentified Patterns:
Bullish Engulfing: Indicates potential upward price movement, marked with green labels and lines.
Bearish Engulfing: Suggests potential downward price movement, marked with red labels and lines.
Hammer: A bullish reversal pattern, marked with blue labels.
Shooting Star: A bearish reversal pattern, marked with orange labels.
Signal Generation:
Long Signal: Triggered when a Bullish Engulfing or Hammer pattern is detected. A dotted green line marks the entry level.
Short Signal: Triggered when a Bearish Engulfing or Shooting Star pattern is detected. A dotted red line marks the entry level.
Visual Elements:
Labels indicating the candlestick pattern names appear at the relevant candles.
Lines connect the previous and current candles for engulfing patterns to highlight their range.
Dotted lines indicate potential entry levels for long or short trades.
Candlestick Patterns With EMA and Stochastic6/11/15, Corrected barcolor errors.
Candlestick patterns identified and color coded according to position above or below 8EMA(TLine).
Special thanks to repo32, DavidR, and Chris Moody for coding ideas.
Bullish candlestick buy signals have a greater probability of success when Stochastics are oversold. Bearish ones have a
greater probability of success when overbought. Stack as many factors in your favor as possible. A candlestick signal by itself is of little value unless you apply additional information with it. An 8 EMA is coded also to help with buy/sell signals. Some of the videos by Steven Bigalow are on the Web to see how he uses it.
www.youtube.com
Regardless of systems and strategies used, make your second trade first: Know when you're going to exit. Risk management rules. Good luck and good trading.

Candlestick Patterns Identified (updated 3/11/15)I decided to republish this one without the trend filter and with all the major symbols active. This will allow for all the patterns to show up.
Due to 15 different candlestick formations in this one script, it will be difficult to turn off the last few due to screen size. You can turn off individual patterns on the settings screen.
I have everything spelled out except the hammer and inverted hammer. They are "H" and "IH" respectively on the charts. They show up so often that they cluttered the charts.
The default script has: Doji, Evening Star, Morning Star, Shooting Star, Hammer, Inverted Hammer, Bearish Harami, Bullish Harami, Bearish Engulfing, Bullish Engulfing, Piercing Line, Bullish Belt, Bullish Kicker, Bearish Kicker, Hanging man, and Dark Cloud Cover. You can turn off what you don't like. The Piercing Line, Bullish Belt, and the Kickers will usually show up better in the daily charts.
I recommend watching videos with Stephen Bigalow to get a feel for how to trade these. You will want to add an 8 EMA to your chart with his setups. Enjoy.
If you want the old version: Take a look at the related ideas below.

Noteworthy CandlesticksThis indicator identifies noteworthy candlestick formations by analyzing the proportions of a candlestick’s body, wicks, and shadows in relation to its total range. It highlights specific patterns to assist in analyzing potential market activity.
Key Features
Lower Wick Candles: It identifies candlesticks with long lower wicks, which may indicate price rejection at lower levels.
Upper Wick Candles: It detects candlesticks with long upper wicks, which may indicate price rejection at higher levels.
Doji Candles: It recognizes candlesticks with small bodies relative to their range, often associated with market indecision.
Definitions of Wicks and Shadows
In traditional candlestick charting, the terms wick and shadow are interchangeable, referring to the thin lines extending above and below the candlestick's body. However, this indicator uses distinct definitions:
Wicks represent the distance from the edges of the candlestick body (the open and close prices) to the high or low.
Shadows measure the distance from the closing price to the high or low of the candlestick.
By distinguishing between wicks and shadows, the indicator provides separate insights into price extremes (wicks) and price behavior around the close (shadows).
How It Works
The indicator evaluates each candlestick against user-defined thresholds for wick and shadow length. It compares the overall range of the candlestick to the ATR (Average True Range) to ensure patterns are relevant in the context of recent volatility.
Candlesticks with noteworthy lower wicks are marked with a symbol below the bar.
Candlesticks with noteworthy upper wicks are marked with a symbol above the bar.
Doji candles are marked with symbols both above and below the bar.
Applications
This indicator can assist traders in identifying potential areas of price reversal, rejection, or indecision. It can also provide additional context when used alongside other technical tools like volume analysis, trendlines, or support and resistance levels.
Acknowledgment
This description was written by ChatGPT to facilitate the understanding of the indicator's features and functionality.

CandlestickPatternsLibrary "CandlestickPatterns"
This library provides a wide range of candlestick patterns, and available for user to call each pattern individually. It's a comprehensive and common tool designed for traders seeking to raise their technical analysis, and it may help users identify key turning of price action in financial instruments. Credit to public technical “*All Candlestick Patterns*” indicator.
abandonedBaby(order, d1)
The "Abandoned Baby" candlestick pattern is a bullish/bearish pattern consists of three candles.
Parameters:
order (simple string) : (simple string) Pattern order type "bull" or "bear".
d1 (simple float) : (simple float) Previous candle's body percentage out of candle range. Optional argument, default is 5.
darkCloudCover(c1, n)
The "Dark Cloud Cover" is a bearish pattern consists of two candles.
Parameters:
c1 (simple bool) : (simple bool) Previous candle's body must be higher than average. Optional argument, default is true.
n (simple int) : (simple int) Length of average candle's body. Optional argument, default is 14.
doji(d0)
The "Doji" is neither bullish or bearish consists of one candles.
Parameters:
d0 (simple float) : (simple float) Current candle's body percentage out of candle range. Optional argument, default is 5.
dojiStar(order, c1, n, d0)
The "Doji Star" is a bullish/bearish pattern consists of two candles.
Parameters:
order (simple string) : (simple string) Pattern order type "bull" or "bear" .
c1 (simple bool) : (simple bool) Previous candle's body must be higher than average. Optional argument, default is true.
n (simple int) : (simple int) Length of average candle's body. Optional argument, default is 14.
d0 (simple float) : (simple float) Current candle's body percentage out of candle range. Optional argument, default is 5.
downsideTasukiGap(c2, c1, n)
The "Downside Tasuki Gap" is a bearish pattern consists of three candles.
Parameters:
c2 (simple bool) : (simple bool) Before previous candle's body must be higher than average. Optional argument, default is true.
c1 (simple bool) : (simple bool) Previous candle's body must be lower than average. Optional argument, default is true.
n (simple int) : (simple int) Length of average candle's body. Optional argument, default is 14.
dragonflyDoji(d0)
The "Dragon Fly Doji" is a bullish pattern consists of one candle.
Parameters:
d0 (simple float) : (simple float) Current candle's body percentage out of candle range. Optional argument, default is 5.
engulfing(order, c1, c0, n)
The "Engulfing" is a bullish/bearish pattern consists of two candles.
Parameters:
order (simple string) : (simple string) Pattern order type "bull" or "bear".
c1 (simple bool) : (simple bool) Previous candle's body must be lower than average. Optional argument, default is true.
c0 (simple bool) : (simple bool) Current candle's body must be higher than average. Optional argument, default is true.
n (simple int) : (simple int) Length of average candle's body. Optional argument, default is 14.
eveningDojiStar(c2, c0, d1, n)
The "Evening Doji Star" is a bearish pattern consists of three candles.
Parameters:
c2 (simple bool) : (simple bool) Before previous candle's body must be higher than average, default is true.
c0 (simple bool) : (simple bool) Current candle's body must be higher than average. Optional argument, default is true.
d1 (simple float) : (simple float) Previous candle's body percentage out of candle range. Optional argument, default is 5.
n (simple int) : (simple int) Length of average candle's body. Optional argument, default is 14.
eveningStar(c2, c1, c0, n)
The "Evening Star" is a bearish pattern consists of three candles.
Parameters:
c2 (simple bool) : (simple bool) Before previous candle's body must be higher than average. Optional argument, default is true.
c1 (simple bool) : (simple bool) Previous candle's body must be lower than average. Optional argument, default is true.
c0 (simple bool) : (simple bool) Current candle's body must be higher than average. Optional argument, default is true.
n (simple int) : (simple int) Length of average candle's body. Optional argument, default is 14.
fallingThreeMethods(c4, c3, c2, c1, c0, n)
The "Falling Three Methods" is a bearish pattern consists of five candles.
Parameters:
c4 (simple bool) : (simple bool) 5th candle ago body must be higher than average. Optional argument, default is true.
c3 (simple bool) : (simple bool) 4th candle ago body must be lower than average. Optional argument, default is true.
c2 (simple bool) : (simple bool) 3rd candle ago body must be lower than average. Optional argument, default is true.
c1 (simple bool) : (simple bool) 2nd candle ago body must be lower than average. Optional argument, default is true.
c0 (simple bool) : (simple bool) Current candle's body must be higher than average. Optional argument, default is true.
n (simple int) : (simple int) Length of average candle's body. Optional argument, default is 14.
Returns: (bool)
fallingWindow()
The "Falling Window" is a bearish pattern consists of two candles.
gravestoneDoji(d0)
The "Gravestone Doji" is a bearish pattern consists of one candle.
Parameters:
d0 (simple float) : (simple float) Current candle's body percentage out of candle range. Optional argument, default is 5.
hammer(c0, n)
The "Hammer" is a bullish pattern consists of one candle.
Parameters:
c0 (simple bool) : (simple bool) Current candle's body must be lower than average. Optional argument, default is true.
n (simple int) : (simple int) Length of average candle's body. Optional argument, default is 14.
hangingMan(c0, n)
The "Hanging Man" is a bearish pattern consists of one candle.
Parameters:
c0 (simple bool) : (simple bool) Current candle's body must be lower than average. Optional argument, default is true.
n (simple int) : (simple int) Length of average candle's body. Optional argument, default is 14.
haramiCross(order, c1, n)
The "Harami Cross" candlestick pattern is a bullish/bearish pattern consists of two candles.
Parameters:
order (string) : (simple string) Pattern order type "bull" or "bear".
c1 (simple bool) : (simple bool) Previous candle's body must be higher than average. Optional argument, default is true.
n (simple int) : (simple int) Length of average candle's body. Optional argument, default is 14.
harami(order, c1, c0, n)
The "Harami" candlestick pattern is a bullish/bearish pattern consists of two candles.
Parameters:
order (string) : (simple string) Pattern order type "bull" or "bear"
c1 (simple bool) : (simple bool) Previous candle's body must be higher than average. Optional argument, default is true.
c0 (simple bool) : (simple bool) Current candle's body must be lower than average. Optional argument, default is true.
n (simple int) : (simple int) Length of average candle's body. Optional argument, default is 14.
invertedHammer(c0, n)
The "Inverted Hammer" is a bullish pattern consists of one candle.
Parameters:
c0 (simple bool) : (simple bool) Current candle's body must be lower than average. Optional argument, default is true.
n (simple int) : (simple int) Length of average candle's body. Optional argument, default is 14.
kicking(order, c1, c0, n)
The "Kicking" candlestick pattern is a bullish/bearish pattern consists of two candles.
Parameters:
order (string) : (simple string) Pattern order type "bull" or "bear"
c1 (simple bool) : (simple bool) Previous candle's body must be higher than average. Optional argument, default is true.
c0 (simple bool) : (simple bool) Current candle's body must be higher than average. Optional argument, default is true.
n (simple int) : (simple int) Length of average candle's body. Optional argument, default is 14.
longLowerShadow(l0)
The "Long Lower Shadow" candlestick pattern is a bullish pattern consists of one candles.
Parameters:
l0 (simple float) : (simple float) Current candle's lower wick min percentage out of candle range. Optional argument, default is 75.
longUpperShadow(u0)
The "Long Upper Shadow" candlestick pattern is a bearish pattern consists of one candles.
Parameters:
u0 (simple float) : (simple float) Current candle's upper wick min percentage out of candle range. Optional argument, default is 75.
marubozuBlack(c0, n)
The "Marubozu Black" candlestick pattern is a bearish pattern consists of one candles.
Parameters:
c0 (simple bool) : (simple bool) Current candle's body must be higher than average. Optional argument, default is true.
n (simple int) : (simple int) Length of average candle's body. Optional argument, default is 14.
marubozuWhite(c0, n)
The "Marubozu White" candlestick pattern is a bullish pattern consists of one candles.
Parameters:
c0 (simple bool) : (simple bool) Current candle's body must be higher than average. Optional argument, default is true.
n (simple int) : (simple int) Length of average candle's body. Optional argument, default is 14.
morningDojiStar(c2, d1, c0, n)
The "Morning Doji Star" candlestick pattern is a bullish pattern consists of three candles.
Parameters:
c2 (simple bool) : (simple bool) Before previous candle's body must be higher than average. Optional argument, default is true.
d1 (simple float) : (simple float) Previous candle's body percentage out of candle range. Optional argument, default is 5.
c0 (simple bool) : (simple bool) Current candle's body must be higher than average. Optional argument, default is true.
n (simple int) : (simple int) Length of average candle's body. Optional argument, default is 14.
morningStar(c2, c1, c0, n)
The "Morning Star" candlestick pattern is a bullish pattern consists of three candles.
Parameters:
c2 (simple bool) : (simple bool) Before previous candle's body must be higher than average. Optional argument, default is true.
c1 (simple bool) : (simple bool) Previous candle's body must be lower than average. Optional argument, default is true.
c0 (simple bool) : (simple bool) Cuurent candle's body must be higher than average. Optional argument, default is true.
n (simple int) : (simple int) Length of average candle's body. Optional argument, default is 14.
onNeck(c1, c0, n)
The "On Neck" candlestick pattern is a bearish pattern consists of two candles.
Parameters:
c1 (simple bool) : (simple bool) Previous candle's body must be higher than average. Optional argument, default is true.
c0 (simple bool) : (simple bool) Cuurent candle's body must be lower than average. Optional argument, default is true.
n (simple int) : (simple int) Length of average candle's body. Optional argument, default is 14.
piercing(c1, n)
The "Piercing" candlestick pattern is a bullish pattern consists of two candles.
Parameters:
c1 (simple bool) : (simple bool) Previous candle's body must be higher than average. Optional argument, default is true.
n (simple int) : (simple int) Length of average candle's body. Optional argument, default is 14.
risingThreeMethods(c4, c3, c2, c1, c0, n)
The "Rising Three Methods" candlestick pattern is a bullish pattern consists of five candles.
Parameters:
c4 (simple bool) : (simple bool) 5th candle ago body must be higher than average. Optional argument, default is true.
c3 (simple bool) : (simple bool) 4th candle ago body must be Lower than average. Optional argument, default is true.
c2 (simple bool) : (simple bool) 3rd candle ago body must be Lower than average. Optional argument, default is true.
c1 (simple bool) : (simple bool) 2nd candle ago body must be Lower than average. Optional argument, default is true.
c0 (simple bool) : (simple bool) Current candle's body must be higher than average. Optional argument, default is true.
n (simple int) : (simple int) Length of average candle's body. Optional argument, default is 14.
risingWindow()
The "Rising Window" candlestick pattern is a bullish pattern consists of two candle.
shootingStar(c0, n)
The "Shooting Star" candlestick pattern is a bearish pattern consists of one candle.
Parameters:
c0 (simple bool) : (simple bool) Current candle's body must be higher than average. Optional argument, default is true.
n (simple int) : (simple int) Length of average candle's body. Optional argument, default is 14.
spinningTopBlack(l0, u0)
The "Spinning Top Black" is neither bullish or bearish.
Parameters:
l0 (simple float) : (simple float) Current candle's lower wick min percentage out of candle range. Optional argument, default is 34.
u0 (simple float) : (simple float) Current candle's upper wick min percentage out of candle range. Optional argument, default is 34.
spinningTopWhite(l0, u0)
The "Spinning Top White" is neither bullish or bearish.
Parameters:
l0 (simple float) : (simple float) Current candle's lower wick min percentage out of candle range. Optional argument, default is 34.
u0 (simple float) : (simple float) Current candle's upper wick min percentage out of candle range. Optional argument, default is 34.
threeBlackCrows(c2, c1, c0, n)
The "Three Black Crows" candlestick pattern is a bearish pattern consists of three candles.
Parameters:
c2 (simple bool) : (simple bool) Before previous candle's body must be higher than average. Optional argument, default is true.
c1 (simple bool) : (simple bool) Previous candle's body must be higher than average. Optional argument, default is true.
c0 (simple bool) : (simple bool) Cuurent candle's body must be higher than average. Optional argument, default is true.
n (simple int) : (simple int) Length of average candle's body. Optional argument, default is 14.
threeWhiteSoldiers(c2, c1, c0, n)
The "Three White Soldiers" candlestick pattern is a bullish pattern consists of three candles.
Parameters:
c2 (simple bool) : (simple bool) Before previous candle's body must be higher than average. Optional argument, default is true.
c1 (simple bool) : (simple bool) Previous candle's body must be higher than average. Optional argument, default is true.
c0 (simple bool) : (simple bool) Cuurent candle's body must be higher than average. Optional argument, default is true.
n (simple int) : (simple int) Length of average candle's body. Optional argument, default is 14.
triStar(order, d2, d1, d0)
The "Tri Star" candlestick pattern is a bullish/bearish pattern consists of three candles.
Parameters:
order (simple string) : (simple string) Pattern order type "bull" or "bear".
d2 (simple float) : (simple float) Before previous candle's body percentage out of candle range. Optional argument, default is 5.
d1 (simple float) : (simple float) Previous candle's body percentage out of candle range. Optional argument, default is 5.
d0 (simple float) : (simple float) Current candle's body percentage out of candle range. Optional argument, default is 5.
tweezerBottom(c1, n)
The "Tweezer Bottom" candlestick pattern is a bullish pattern consists of two candles.
Parameters:
c1 (simple bool) : (simple bool) Previous candle's body must be higher than average. Optional argument, default is true.
n (simple int) : (simple int) Length of average candle's body. Optional argument, default is 14.
tweezerTop(c1, n)
The "Tweezer Top" candlestick pattern is a bearish pattern consists of two candles.
Parameters:
c1 (simple bool) : (simple bool) Previous candle's body must be higher than average. Optional argument, default is true.
n (simple int) : (simple int) Length of average candle's body. Optional argument, default is 14.
upsideTasukiGap(c2, c1, n)
The "Tri Star" candlestick pattern is a bullish pattern consists of three candles.
Parameters:
c2 (simple bool) : (simple bool) Before Previous candle's body must be higher than average. Optional argument, default is true.
c1 (simple bool) : (simple bool) Previous candle's body must be lower than average. Optional argument, default is true.
n (simple int) : (simple int) Length of average candle's body. Optional argument, default is 14.
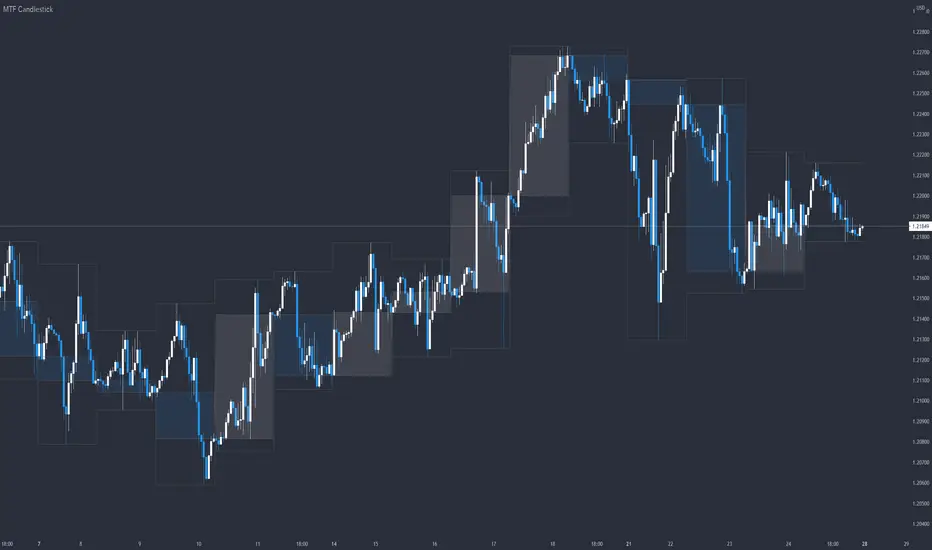
MTF CandlestickOne of the most important thing to understand in order to estimate the trend direction and its continuation is how the lower time frame candlesticks have been formed.
There are many processes by which candlesticks have been formed even if same size.
So in this script, daily candlestick is overlapped on the currently chart as default, and that can be changed.
Only real body is shown so as not to interfere with the currently chart.
Hap Mum Formasyonu - Candlestick PatternsThis indicator is a comprehensive tool that automatically scans for popular Candlestick Patterns on symbols you select and displays the results in a table on your screen.
Unlike standard scanners, this script allows you to create 10 Different Custom Watchlists. You can add up to 20 symbols to each list and switch between lists via the settings menu to see instant scanning results.
🚀 Key Features
10 Custom Lists: Organize your portfolio into groups (e.g., Indices, Crypto, Forex). Each list holds 20 symbols.
Trend Filter: Patterns are validated based on the trend direction, not just the candle shape. Bullish patterns are searched in downtrends, and Bearish patterns in uptrends.
Option 1: Is Price above/below SMA 50?
Option 2: Price relative to SMA 50 & SMA 200 alignment.
Visual Table: Bullish signals are shown in the Green box, Bearish signals in the Red box.
Flexible Settings: You can toggle specific patterns on/off and change the trend detection method.
📊 Supported Patterns & Legend
Abbreviations used in the dashboard:
Bullish Signals:
DD: Dragonfly Doji
H: Hammer
IH: Inverted Hammer
EB: Engulfing Bullish
MS: Morning Star
MDS: Morning Doji Star
P: Piercing Line
HB: Harami Bullish
TWS: Three White Soldiers
Bearish Signals:
GD: Gravestone Doji
HM: Hanging Man
SS: Shooting Star
EB: Engulfing Bearish
ES: Evening Star
EDS: Evening Doji Star
HB: Harami Bearish
TBC: Three Black Crows
DCC: Dark Cloud Cover
🛠 How to Use?
Add the indicator to your chart.
Open Settings.
Select a list from "Which List Do You Want to Scan?" (e.g., List 1).
Enter your ticker symbols into the corresponding group fields below (LIST 1, LIST 2...).
Click OK, and the table will update with the signals.
Disclaimer: This tool is for educational purposes only. Candlestick patterns do not guarantee future market movements. Always manage your risk.

MTF VWAP + Candlestick VWAP Reactions (Bounce + Score)It’s an intraday VWAP + candlestick confluence tool that:
Draws daily, weekly, monthly, yearly VWAPs.
Detects textbook candlestick patterns, classed as BuH/BuM (bullish high/moderate) and BeH/BeM (bearish high/moderate) with colored boxes.
Triggers long/short arrows only when price bounces off a VWAP by at least 0.15% AND there’s a recent matching pattern.
Grades every signal as A / B / C with a score 1–10:
A (8–10) = high-reliability pattern (BuH/BeH) + strong 2-candle body reaction (your A+ setups).
B (5–8) = moderate pattern (BuM/BeM) + one solid bounce.
C (1–5) = weaker / mixed context (scalpy or gamble).

Open - Candlestick-ChartIt forces the Open indicator to use the candlestick open values. For example, if you need to use a Heikin-Ashi chart with the Open indicator based on regular candlestick data, this indicator will ensure it does not change.
