Trend and Trendline DetectorTrend and Trendline Detector
Overview
The Trend and Trendline Detector indicator provides both major and minor trend analysis using Simple Moving Averages (SMA) and automatically plots dynamic support and resistance trendlines based on pivot highs and lows.
Key Features
Major Trend Detection: Uses a configurable SMA to determine primary market direction.
Minor Trend Visualization: Optional minor SMA with color-coded line segments to mark smaller trend fluctuations.
Dynamic Pivot Trendlines: Automatically detects pivot highs/lows and draws major (solid) and minor (dashed) trendlines, with user-controlled extension modes.
Customizable Inputs: User can adjust SMA lengths, pivot look back/look forward periods, line extend mode, and toggle features on/off.
Search in scripts for "TRENDLINES"

Juice RemedyThis Remedy suite is a remake of the Auto Remedy suite.
We have improved the performance and added a few new features.
Updated:
- Converted some boxes to lines to mitigate the limit of 500.
- Rewrote the code and disabled blocks if features are turned off
New features:
- RSI based candle colors
- Added features to limit historical renders
---
RSI Candles tells you the RSI and volatility by coloring the candlesticks. The different stages are: overbought, oversold, neutral and a top and bottom RSI / EMA crossover.
There is also an option to enable the RSI signal on the chart to see when it's entering an overbought or oversold area.
---
Volume Profile displays a vertical histogram on the right side of the price chart, representing the volume traded at each price level. The length of each bar corresponds to the total volume traded at that particular price level. Traders can analyze the shape and distribution of the Volume Profile to gain valuable information about the market structure.
Here's how Volume Profile is used and applied in trading:
Identifying Areas of High Volume:
Volume Profile helps traders identify areas of high trading activity. Peaks in the Volume Profile histogram indicate price levels where significant buying or selling pressure was present. These areas can act as support or resistance levels in the future, as they represent levels where traders have previously shown interest.
Understanding Price Acceptance and Rejection:
Volume Profile assists in determining whether the market has accepted or rejected specific price levels. When the volume is higher at a particular price level, it suggests that traders have accepted that price and consider it fair. On the other hand, low volume at a price level indicates rejection, suggesting that traders are not willing to transact at that price.
Identifying Value Areas:
Volume Profile can help identify value areas, which are price regions where the most volume has been traded. These areas are considered significant as they reflect levels where the market has found fair value and attracted substantial trading activity. Traders often pay attention to these value areas as potential support or resistance zones.
Confirming Breakouts and Reversals:
Volume Profile can be used to confirm the validity of breakouts and reversals. If a price breaks out of a range with high volume, it suggests strong conviction and increases the likelihood of a sustained move. Similarly, if a price reverses near a high-volume area, it provides additional confirmation of a potential trend reversal.
Assessing Market Sentiment:
By analyzing the shape and structure of the Volume Profile, traders can gain insights into market sentiment. A balanced Volume Profile with volume evenly distributed across price levels indicates a neutral market. Skewed or asymmetrical Volume Profiles may suggest bullish or bearish sentiment, depending on where the volume is concentrated.
It's important to note that traders often combine Volume Profile with price patterns, trendlines, and momentum indicators to validate signals and develop a comprehensive understanding of the market.
By studying the Volume Profile, traders can gain a clearer picture of where significant trading activity has occurred and identify levels of potential support, resistance, and value. This information can assist in making more informed trading decisions and improving overall market analysis.
---
VWAP(Volume Weighted Average Price) is a technical analysis tool that calculates the average price weighted by trading volume over a specified time period. It provides traders with insights into the average price at which a particular asset has traded during a given period, considering the volume traded at each price level.
Here's a general explanation of VWAP and its application in trading:
Calculation of VWAP:
VWAP is calculated by multiplying the price of each trade by its corresponding volume, summing these values over a specific time period, and dividing the total by the cumulative volume. The calculation continuously updates as new trades occur within the specified time frame.
Interpretation of VWAP:
VWAP is primarily used as a reference point to assess whether a current price is relatively high or low compared to the average price weighted by volume. Traders compare the current price to the VWAP to gauge whether the price is trading above or below the average level. If the price is above VWAP, it suggests that the asset is trading at a premium, while a price below VWAP indicates a discount.
VWAP as a Trading Indicator:
Traders use VWAP in various ways to support their trading decisions. Here are a few common applications:
a. Trend Identification: Traders analyze the relationship between the current price and VWAP to identify the prevailing market trend. If the price consistently trades above VWAP, it is often seen as a bullish signal, while prices below the VWAP is considered a bearish signal. This approach helps traders align their trades with the overall market direction.
b. Support and Resistance Levels: VWAP can act as a dynamic support or resistance level. Traders observe how the price reacts when approaching the VWAP. If the price bounces off the VWAP and continues in the direction of the prevailing trend, it may indicate support or resistance. Traders can use the VWAP as a reference for setting stop-loss levels or determining potential entry or exit points.
c. Reversal Signals: In some cases, when the price deviates significantly from VWAP, it may indicate overbought or oversold conditions. Traders watch for price reversals when the price moves away from the VWAP, potentially signaling a short-term market reversal.
d. Volume Analysis: VWAP considers volume along with price, providing insights into the significance of price moves. Traders analyze the relationship between volume and VWAP to evaluate the strength of price movements. Higher volume trading near the VWAP may suggest increased market interest and potential continuation of the trend.
It's worth noting that the VWAP is often used in intra-day trading and is more relevant for short-term analysis. Traders typically adjust the VWAP time frame based on their trading style and the asset being analyzed.
---
The Zig Zag works by filtering out price movements below a certain threshold (percentage or points) and only displaying significant price changes. This helps to eliminate minor price fluctuations and focus on the more substantial market movements.
When applying the Zig Zag indicator, traders typically select a percentage or point value as the threshold. For example, if a 5% threshold is chosen, the Zig Zag indicator will only plot a new point when the price has moved up or down by at least 5% from the previous significant high or low.
The indicator plots lines connecting the significant highs and lows on the price chart, creating a zigzag pattern. The lines are drawn in a way that reflects the change in the trend direction. The indicator can be adjusted to suit different timeframes and trading styles.
The primary purpose of the Zig Zag indicator is to identify and highlight trend reversals and price swings. Traders often use it to:
Identify major turning points: The Zig Zag indicator helps traders spot major highs and lows in the price action. These levels can act as potential support or resistance areas for future price movements.
Filter out noise: By filtering out minor price fluctuations, the Zig Zag indicator helps traders focus on the more significant price moves and trends. This can provide a clearer picture of the overall market direction.
Confirm chart patterns: The Zig Zag indicator can be used to confirm the validity of chart patterns, such as trendlines, channels, or chart formations. It can help traders validate breakouts, pullbacks, or continuation patterns.
Set trailing stops: Traders may use the Zig Zag indicator to set trailing stops based on the significant swing highs and lows. This allows them to trail their stop-loss orders behind the price action and potentially lock in profits as the trend develops.
Additionally, it's essential to customize the settings of the Zig Zag indicator according to the specific market being analyzed, as different markets and timeframes may require different threshold values for optimal performance.
Please keep in mind that while the Zig Zag indicator can provide valuable insights, it should be used alongside other analysis tools and not solely relied upon for trading decisions.
---
Fibonacci extensions and retracements are both technical analysis tools that traders use to identify potential levels of support and resistance in financial markets. Here's a clear understanding of each concept and how they are used in trading:
1. Fibonacci Retracement:
Fibonacci retracement is based on the idea that after an upward or downward price movement, the price tends to retrace a portion of that move before continuing in the original direction. The key levels used in Fibonacci retracement are based on ratios derived from the Fibonacci sequence, such as 0.382 (38.2%), 0.500 (50%), and 0.618 (61.8%).
To apply Fibonacci retracements, traders typically select two significant points on a price chart: a swing high and a swing low. The retracement levels are then plotted as horizontal lines based on the Fibonacci ratios. These levels act as potential support (in an uptrend) or resistance (in a downtrend) where the price may reverse or consolidate before resuming the overall trend.
Traders often use Fibonacci retracement levels to identify potential entry or exit points, place stop-loss orders, or assess the strength of a trend. The most commonly used retracement levels are 38.2%, 50%, and 61.8%, but other Fibonacci ratios like 23.6% and 78.6% are also sometimes used.
2. Fibonacci Extension:
Fibonacci extension is used to identify potential price targets beyond the initial trend or price move. It helps traders determine where the price may reach once it surpasses the previous swing high or swing low.
Similar to Fibonacci retracement, Fibonacci extension levels are derived from the Fibonacci sequence. The most commonly used extension levels are 138.2%, 161.8%, 261.8%, and 423.6%, although other ratios can also be applied.
To use Fibonacci extension, traders select three points on a price chart: a swing low, a swing high (corresponding to the previous trend), and a subsequent swing low or swing high (from where the extension is projected). The extension levels are then projected beyond the swing high or swing low, acting as potential price targets or areas of interest.
Fibonacci extension levels are often used to determine potential profit targets or to identify areas where a trend may reverse or consolidate. Traders may also use extensions in conjunction with other technical analysis tools to confirm trade signals or assess the overall market structure
---
The Pitchfan tool is based on the concept of Andrew's Pitchfork, which is a popular technical analysis tool developed by Dr. Alan H. Andrews. It consists of three parallel trendlines that are drawn to encompass the price action of an asset. The trendlines are typically drawn by connecting three significant points on a price chart - usually a pivot high, a pivot low, and another pivot high.
Once the Pitchfork is plotted, the Pitchfan tool extends the concept by adding additional trendlines that are parallel to the original Pitchfork. These additional trendlines are drawn based on certain mathematical ratios (e.g., Fibonacci ratios) applied to the distance between the original trendlines.
The Pitchfan can be used to identify potential support and resistance levels, as well as potential areas for price reversal or continuation. Traders may look for price reactions near these trendlines, with the expectation that the price may find support or encounter resistance at these levels.
---
Higher timeframe opens refer to the opening prices of different sessions or timeframes above the one being currently analyzed. For example, in intra-day trading, higher timeframe opens can refer to the daily session open or the opening prices of other significant market sessions in the forex market.
In addition to higher timeframe opens, traders often utilize daily reference ranges by incorporating indicators such as Average True Range (ATR) and the previous day's range. These tools help traders gauge the potential price volatility for the day and establish reference levels for stop-loss orders, profit targets, overall risk management strategies and market knowledge to develop a comprehensive trading approach.
---
Disclaimer : Please note that trading success relies on adhering to your trading strategy, and indicators should be used in accordance with your strategy rather than being the sole basis for trading decisions.
The provided script is intended solely for informational and educational purposes. Its use does not constitute professional or financial advice. It is your sole responsibility to evaluate the script's output and assess the risks associated with its use. By utilizing the script, you agree not to hold "JuiceSignals" TradingView user liable for any potential claims for damages that may arise from decisions made based on the use of the script.

TrendLine ScythesTrendline Scythes is a script designed to automatically detect and draw special curved trendlines, resembling scythes or blades, based on pivotal points in price action. These trendlines adapt to the volatility of the market, providing a unique perspective on trend dynamics.
🔲 Methodology
Traditional trendlines connect consecutive pivot points on a price chart, providing a linear representation of trend direction. However, this script employs a distinctive methodology by automatically detecting price pivots and then calculating special curved trendlines based on the Average True Range (ATR) of the price. This introduces a curvature to the trendlines, resembling scythes, offering a unique way to interpret market trends.
🔲 Auto Breakout and Target Detection
Trendline Scythes includes features for automatic breakout detection, signaling potential trend changes. Additionally, the script assists in target detection, helping traders set realistic and data-driven profit-taking levels based on market volatility and user adjustment.
🔲 Utility
Trend Confirmation - Use Trendline Scythes to confirm existing trends by observing how price interacts with the curved trendlines.
Breakout Signals - Auto-detection of breakouts adds a proactive element to your trading strategy, helping you stay ahead of potential trend reversals.
Target Setting - Utilize the script to set profit-taking targets based on volatility, aligning with the current market conditions.
🔲 Settings
Pivot Length - Swing detection length
Scythe Length - Adjusts the length of the scythes blade
Sensitivity - Controls how restrained the target calculation is, higher values will result in tighter targets.
🔲 Alerts
Breakout
Breakdown
Target Reached
Target Invalidated
As well as the option to trigger 'any alert' call.
Trendline Scythes is a versatile tool combining the benefits of traditional trendlines with the dynamic adaptability of curved lines for a unique approach to trend analysis.

Dynamic Trendline Break - Strategy [presentTrading]- Introduction and How It Is Different
The Dynamic Trendline Break Strategy is a unique trading algorithm that leverages the power of trendlines and swing detection to identify potential trading opportunities.
Unlike traditional trendline strategies that rely on static trendlines, this strategy dynamically calculates trendlines based on pivot highs and lows.
This dynamic approach allows the strategy to adapt to changing market conditions (especially 24hr markets like Crypto) and potentially identify trading opportunities that static trendlines might miss.
BTCUSD 6hr chart
Tencent 700.HK 1D chart
- Strategy, How It Works
The strategy works by first identifying pivot highs and lows using a lookback period defined by the user. These pivot points are then used to calculate the slope of the trendlines. The slope calculation method can be chosen from three options: Average True Range (ATR), Standard Deviation (Stdev), or Linear Regression (Linreg), providing flexibility to the trader.
Once the trendlines are calculated, the strategy identifies potential trading opportunities when the price crosses over the upper trendline (for long trades) or crosses under the lower trendline (for short trades). The strategy also allows the user to define the trade direction (Long, Short, or Both) and the stop loss method (Fixed or SuperTrend).
- Trade Direction
The trade direction parameter allows the user to define the direction of the trades that the strategy will take. If set to "Long", the strategy will only take long trades when the price crosses over the upper trendline. If set to "Short", the strategy will only take short trades when the price crosses under the lower trendline. If set to "Both", the strategy will take both long and short trades.
- Usage
To use this strategy, simply input your desired parameters for the swing detection lookback, slope, slope calculation method, trade direction, stop loss method, and stop loss level. Once these parameters are set, the strategy will automatically calculate the trendlines and identify potential trading opportunities based on the defined parameters.
- Default Settings
The default settings for the strategy are as follows:
Swing Detection Lookback: 30
Slope: 0.618
Slope Calculation Method: ATR
Trade Direction: Both
Stop Loss Method: SuperTrend
Stop Loss Level: 15%
SuperTrend Factor: 3
SuperTrend Lookback: 21
These settings can be adjusted to suit your trading style and risk tolerance. Always remember to backtest any changes to the settings before live trading.

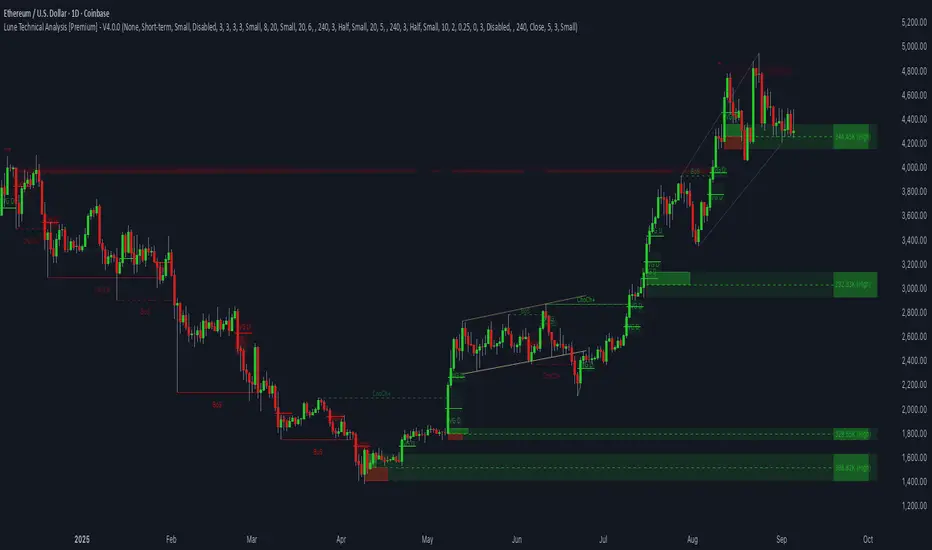
Lune Technical Analysis Premium⬛️ Overview
Lune Technical Analysis is a state-of-the-art TradingView indicator, meticulously designed to provide real-time market insights. Distinguished by its non-repainting features that operate in real-time, this tool brings enhanced accuracy and timeliness to your market analysis.
🟦 Features
Lune Technical Analysis equips traders with an array of innovative features:
🔹 Candle Coloring: The Candle Coloring feature introduces an innovative approach to visualizing market sentiment by coloring chart candles. It is devised to streamline your market analysis, offering a readily digestible snapshot of market trends. For example, if you aim to gauge the predominant market sentiment promptly, enable this feature for instant candle color-coding in accordance with prevailing bullish or bearish market structures. Though it currently supports only Market Structure-based Candle Coloring, its settings can be manipulated for enabling or disabling this feature. This feature operates by applying predefined algorithms that interpret market sentiment, coloring the candles accordingly.
🔹 Chart Pattern Detection: This sophisticated tool automatically detects and illustrates common chart patterns on your chart, simplifying the process of pattern identification. It identifies a range of patterns such as Head & Shoulders, Inverted Head & Shoulders, Ascending/Descending Wedges, Broadening Wedges, various Triangles, and Double Tops/Bottoms, enhancing your confluence detection in the market. For example, upon detecting a Double Top pattern, you could anticipate a potential price reversal due to this bearish signal. The sensitivity of this tool can be customized according to your trading style, with lower settings for short-term changes and higher for long-term. This feature leverages predefined formulas and price action analysis to identify these patterns.
🔹 Trendlines: With the Automatic Trendline Drawing tool, your technical analysis becomes significantly more efficient and precise. This feature is engineered to identify upward and downward Trendlines, aiding in locating potential pivots, and market support/resistance. For instance, if the price consistently rebounds off a Trendline, it may continue to do so, serving as a support/resistance level. However, a break through the Trendline could signal potential volatility and trend change. This feature's sensitivity to price changes can be adjusted to either short or long-term. It works by tracing Trendlines based on price action and wick formations to detect potential pivots.
🔹 Liquidity Bubbles: Liquidity Bubbles is an advanced tool that pinpoints key liquidity areas and large positions in real-time. This feature significantly contributes to effective trading strategy formulation by highlighting potential entry and exit points. It operates in real-time, ensuring zero repaint or lag, and supports two modes: Enhanced Bubbles and Basic Bubbles. For instance, the detection of multiple bullish Liquidity Bubbles during a ranging market could suggest an upward price movement due to dominant bullish volume. This feature's settings include thresholds for insignificant bubble filtering and a mode selection feature. Liquidity Bubbles operates by applying a proprietary formula to volume data, determining general volume direction and potential positions.
🔹 Market Structure: The Market Structure tool identifies key market structures such as Break of Structures (BoS) and Change of Character (ChoCh), thereby enhancing your ability to read market trends and sentiment. This smart money concept gives you a unique insight into short-term and long-term market trends. For instance, the appearance of a bullish Break of Structure and Change of Character after a predominantly bearish market sentiment could suggest a new bullish trend. This feature allows users to select which Market Structures to display and calculates these structures based on the market's high and low points.
🔹 Order Blocks: Order Blocks provide a visual representation of areas where large market participants are likely to place orders. These zones, where significant buying or selling activity has occurred in the past, offer insightful data for future price movements. The Order Blocks feature operates in real-time, providing real-time Order Blocks without any lag. For instance, if the price enters a large Order Block with predominantly bullish volume, an upward price movement can be anticipated. However, if the price breaks through the block, it could suggest the block's invalidation and a likely continued price fall. You can configure the settings to enable an additional Order Block, customize timeframes, overlap functions, and apply a quality filter. This feature calculates Order Blocks using the volume and candle size data.
🔹 Supply/Demand Zones: This real-time tool identifies crucial supply and demand zones, revealing potential price reaction points. These zones, where supply (selling pressure) and demand (buying pressure) have historically impacted price significantly, provide traders with insights into potential areas of strong support (demand) and resistance (supply). For example, if the price enters a large supply zone, a price rejection could be anticipated due to historical selling pressure at this zone. The settings enable users to add an additional Supply/Demand Zone, customize the timeframe, and apply a quality filter. This feature identifies common Supply/Demand Zones patterns based on volume and the size of the zone and displays them on the chart.
🔹 Fair Value Gaps: The Fair Value Gaps tool is designed to identify potential price correction zones or "gaps". These areas, where the market price sharply deviated from the fair value, suggest potential price adjustments in the future. For instance, the formation of a bullish Fair Value Gap could indicate a future price drop to fill this gap, potentially followed by an upward movement if the gap was of fair value. The settings allow users to enable additional Fair Value Gaps, customize the timeframe, and apply a quality filter. This feature measures large market gaps based on the size of the gap and its volume.
These features and tools collectively offer a comprehensive solution for traders to understand and navigate the financial markets. It's important to remember that they are designed to assist in making informed trading decisions and should be used as part of a balanced trading strategy.
🟧 Usage
Lune Technical Analysis's unique feature set can be leveraged both individually and synergistically. It is important to understand each feature and experiment with different configurations to best suit your unique trading needs.
🔸 Example #1: The following example demonstrates how the Order Block and Liquidity Bubbles feature can be used together to enhance your market analysis.
Order Blocks work in real-time to identify key order zones based on price action. These zones are often crucial for predicting price fluctuations. Meanwhile, Liquidity Bubbles act as real-time visual cues that detect significant market positions, facilitating an understanding of market accumulation, distribution, and trapped positions.
In this instance, at point 1, a bearish Basic and Enhanced Liquidity Bubble is visible within a crucial Order Block. The combination of these indicators augments the bearish sentiment, leading to a potential price decrease. Similarly, at point 2, the conjunction of two bullish Basic Liquidity Bubbles within an Order Block strengthens the bullish sentiment, culminating in a subsequent price increase.
🔸 Example #2: The following example demonstrates how Supply and Demand Zones can be used to detect strong and quality supports and resistance.
Supply and Demand Zones operate in real-time, detecting crucial zones based on price action and volume. This feature is invaluable for predicting potential price reaction points.
At point 1, the price enters a Supply Zone, a historical hotspot for selling activity, which usually leads to a price rejection and consequent decrease. At point 2, a Demand Zone indicating a bullish sentiment suggests a potential reversal when the price touches this level.
🔸 Example #3: The following example demonstrates how the Chart Pattern Detection feature is able to detect chart patterns to help enhance your trades.
Chart Pattern Detection employs formulas and price action analysis to identify common chart patterns as they form. Here, it successfully detects a 'Head and Shoulders' pattern, a conventionally bearish pattern, indicating a potential price drop.
🟥 Conclusion
Lune Technical Analysis stands as an exceptional blend of real-time insights into market activity. Its real-time, non-repainting features offer traders a more precise and timely approach to market analysis, promoting improved decision making in ever-changing market conditions.
🔻 Access
You can see the Author's instructions below to get instant access to this indicator & our Premium Suite.
🔻 Disclaimer
Lune Technical Analysis is a tool for aiding in market analysis and is not a guarantee of future market performance or individual trading success. We strongly recommend that users combine our tool with their trading strategies and do their due diligence before making any trading decisions.
Remember, past performance is not indicative of future results. Please trade responsibly.
Trend Lines ProHello Traders!
We need to make things better & better to solve the puzzle and I try to do my best on this way. now I am here with my new Trend Lines Pro script.
As you know, Trend Lines is very subjective and many people (even professionals) draw different Trend Lines on the same chart. This is confusing and there must be an automation to make the life easer. with this tool I tried to automate it.
The idea in this script is different from my previous trend lines scripts. In this, I use channel idea so it can check number of pivot points it contains, it checks H/L/C in the channels as well. it also checks the angle while choosing trend lines. then we get stronger and useful Trend Lines automatically.
There are some option in the script, let see one by one:
Pivot Period: The Length to calculate Pivot Highs/Lows
Source : Option to use "High/Low" or "Close" as the source for Pivot Points
Threshold Rate : This rate is used for channel width. it you give bigger numbers then you get bigger channels. it's 4 by default
Minimum Angle Rate for new Trendline: if there are different trend lines, there must be an angle between them to choose best trend lines. you can set the angle with this option.
Minimum Strength: there can be many trend lines but we need to choose/use stronger ones. with this option you can set the number of pivot points a trend channel have to contains.
Maximum Loopback Length: by default the script can check 40 pivot highs and 40 pivot lows but to make the script faster and useful I needed to add a limitation for the number of bars that the script can go back.
Show Trendlines as: you can see trend lines as "Trendline", "Channel", "Trend Channel". you can see examples below.
Enable Weak Trend Lines: if there is no trend lines strong enough (as defined in "Minimum Strength" option) you have option to see a weak trend line. that is useful sometimes. if you enable this option weak lines are shown as dotted lines.
Show Price Labels on Trendlines: the script can show the price levels to break trend lines. the examples are below
Line Style: trend lines can be Solid or Dashed as you wish
Color theme: colors of the Up/Down Trend lines can be set. 'Red', Lime, Blue, White, Black, Olive, Gray
you can see the Trend Lines as channels:
you can see Trend Channels to see the big picture.also there is dotted trend line as weak trend line defined above.
you can set color/width of trend lines as you wish.
the script is fast enough to run on 1sec chart:
you can use this script on any chart, fx pairs, stocks, indices etc
I made a short video to explain how to use it and some options:
Please PM for access.
Enjoy!
DISCLAIMER: No sharing, copying, reselling, modifying, or any other forms of use are authorized for our documents, script / strategy, and the information published with them. This informational planning script / strategy is strictly for individual use and educational purposes only. This is not financial or investment advice. Investments are always made at your own risk and are based on your personal judgement. I am not responsible for any losses you may incur. Please invest wisely.
Paid script

Smart Breakout Detector: Trendline Retest & Angle FilteringDetect trendline breakouts with two important filtering controls: retest validation and angle filtering. Require multiple price retests (2-4 touches) before a trendline is considered valid, eliminating weak single-touch lines. Set precise angle limits to filter out unreliable steep or shallow trendlines. Three independent timeframe sets (fast/medium/slow) with customizable pivot lengths allow you to get low risk entry point for both short-term and major trend continuations/reversals.
═══════════════════════════════════════════
CORE METHODOLOGY
═══════════════════════════════════════════
This indicator identifies trendline breakouts using two configurable filtering parameters that are uncommon in publicly available indicators:
1. RETEST VALIDATION
Requires a specified number of price touches (2-4) before considering a trendline valid. This reduces false signals from randomly aligned single-touch lines. Higher thresholds decrease signal frequency while increasing reliability.
2. ANGLE FILTERING
Applies maximum angle constraints (0-20) to trendlines independently for resistance and support, both upward and downward slopes. This filters trendlines with extreme angles that typically lack predictive value.
═══════════════════════════════════════════
TECHNICAL IMPLEMENTATION
═══════════════════════════════════════════
DETECTION ALGORITHM:
1. Identifies pivot highs/lows using configurable lookback periods
2. Connects pivots within ATR-based proximity threshold
3. Validates trendlines only after minimum retest requirement is met
4. Applies angle constraints using arctangent calculations
5. Verifies no price penetration occurred between pivot points
6. Triggers breakout signals when price breaches validated lines
THREE INDEPENDENT TREND LINE BANKS:
The indicator operates three parallel detection systems with separate parameters:
- Level Set A: Short pivot periods (default 5 bars)
- Level Set B: Medium pivot periods (default 10 bars)
- Level Set C: Long pivot periods (default 6 bars)
Each system maintains independent arrays of resistance and support lines.
ADAPTIVE COMPONENTS:
- Proximity tolerance scales with ATR(40) to accommodate volatility
- Angle thresholds adjust using combined absolute and percentage ATR factors
- Line lifespan configurable by bar count (default 180/200/300 bars per set)
══════════════════════════════════════════
USE CASES
══════════════════════════════════════════
Appropriate for:
- Filtering breakout candidates by reliability metrics
- Multi-timeframe trendline analysis
- Automated breakout monitoring
- Reducing chart noise from weak trendlines
Not appropriate for:
- Range-bound or highly choppy markets
- Instruments with insufficient historical data
- Strategies requiring predictive (non-historical) trendlines

Breakout Patterns Detector: Triangle & Wedge [Splirus]This indicator identifies Breakout Patterns such as Ascending Triangles , Descending Triangles , Symmetric Triangles , Ascending Wedges , and Descending Wedges , using candlestick charts and Trendlines. It provides visual cues, stop-loss (SL), and take-profit (TP) levels, alongside a detailed dashboard to evaluate performance. The indicator supports two alert modes: Manual Mode for trader notifications and Bot Mode for automated trading signals.
To achieve optimal results, users are encouraged to experiment with indicator parameters and analyze the dashboard summary to find the perfect configuration for each timeframe, pair, and market condition.
Pattern Identification
The indicator detects the following breakout patterns based on pivot highs and lows:
Ascending Triangle : Flat upper trendline, rising lower trendline.
Descending Triangle : Flat lower trendline, declining upper trendline.
Symmetric Triangle : Converging trendlines with similar slopes (within a user-defined threshold).
Ascending Wedge : Both trendlines slope upward, converging.
Descending Wedge : Both trendlines slope downward, converging.
Patterns are identified using configurable left and right bars for small and big patterns, with slope thresholds normalized by ATR. A trend confirmation filter ensures breakouts align with market direction, and users can adjust breakout confirmation bars to validate signals.
The goal is to fine-tune these settings to suit specific timeframes and pairs, as each combination may require a unique setup for optimal performance.
Stop-Loss Calculation
Stop-loss levels are calculated dynamically based on pattern type and breakout direction:
Symmetric Triangle : SL is set at the first pivot of the opposite trendline, adjusted by a buffer percentage.
Ascending/Descending Triangle : SL is placed at the breakout trendline’s price, plus the buffer.
Ascending/Descending Wedge : SL is set at the second pivot of the opposite trendline, adjusted by the buffer.
The indicator calculates leverage based on a user-defined risk tolerance percentage. Users should adjust the SL buffer and risk tolerance to balance risk and reward, monitoring the dashboard to assess how these settings impact performance across different timeframes and pairs.
Take-Profit Calculation
Three take-profit levels ( TP1 , TP2 , TP3 ) are calculated using pattern height and user-defined multipliers:
For Ascending/Descending Triangles, height is the difference between the max and min prices within the pattern.
For Symmetric Triangles and Wedges, height is the vertical distance between trendlines at the pattern’s start.
TP levels are set as:
TP1 = Breakout price ± (Height × TP1 Multiplier).
TP2 = Breakout price ± (Height × TP2 Multiplier).
TP3 = Breakout price ± (Height × TP3 Multiplier, with a 1.5x adjustment for Wedges).
Experiment with TP multipliers to optimize the risk-reward ratio, using the dashboard to evaluate TP hit rates and overall profitability for each configuration.
Symmetric Triangle:
Ascending/Descending Wedge:
Ascending/Descending Triangles:
Finding the Perfect Configuration
The indicator’s dashboard provides a comprehensive summary of performance metrics, including total trades, TP1/TP2/TP3 hits, SL hits, profit/loss percentages, and win rates for bullish, bearish, and combined trades. These metrics are crucial for identifying the ideal parameter settings:
Timeframe and Pair Variability : Each timeframe (e.g., 15m, 30min, 1H, 4H, Daily) and pair (e.g., BTC/USD, EUR/USD) behaves differently. Adjust parameters like left/right bars, minimum pattern length, and breakout confirmation bars to match the volatility and trend characteristics of the chosen pair and timeframe.
Parameter Tuning : Modify slope thresholds, trend confirmation filters, and bars inside the pattern to filter out false breakouts. For example, a higher breakout confirmation bar setting may reduce signals but increase reliability on longer timeframes.
Dashboard Analysis : Focus on the dashboard’s win rate, profit/loss ratio, and TP/SL hit frequencies. A “Perfect” win rate (>66%) or high TP hit rate indicates a strong configuration. If the SL hit rate is high, consider tightening the trend confirmation filter or increasing the SL buffer.
Iterative Testing : Test different combinations of settings (e.g., small vs. big patterns, aggressive vs. conservative breakout confirmation) and compare dashboard results over time. The goal is to find a balance where the indicator consistently delivers high win rates and profitability for your specific trading setup.
Alert Modes
The indicator supports two alert modes to suit different trading styles:
Manual Mode : Generates alerts for breakouts with entry price, SL, TP1/TP2/TP3, and leverage, tailored for Crypto or Forex markets. Use this mode to manually evaluate signals while refining configurations.
Bot Mode : Sends automated trading signals. To avoid conflicts, Bot Mode ensures no short position alert is triggered while a long position is active, and vice versa. This mode is ideal once you’ve identified an optimal configuration via the dashboard.
Additional Features
Historical Patterns : Displays past trendlines with customizable transparency and extension, helping users analyze how patterns performed under different settings.
Customizable Settings : Adjust pattern size, breakout confirmation, trend filters, and visual preferences (colors, dashboard location) to match your trading style.
Market Compatibility : Supports Crypto and Forex markets across all timeframes, but requires careful tuning for each market type.
Usage Notes
Start with default settings and monitor the dashboard to establish a baseline performance for your chosen timeframe and pair.
Gradually adjust one parameter at a time (e.g., left/right bars, TP multipliers) and compare dashboard results to identify improvements.
Use historical pattern analysis to understand how past breakouts performed under different configurations, guiding your optimization process.
Once a high win rate and profitability are achieved, consider automating trades with Bot Mode for consistent execution.
Disclaimer
This indicator is intended for educational purposes only and should not be considered financial advice. Trading involves significant risk, and past performance is not indicative of future results. Users are strongly advised to thoroughly test and validate the indicator’s signals in a demo environment before using it in live trading. The author is not responsible for any financial losses incurred while using this indicator. Always conduct your own research and consult with a qualified financial advisor before making trading decisions.

Trend Lines [LuxAlgo]Our new "Trend Lines" indicator detects and highlights relevant trendlines on the user chart while keeping it free of as much clutter as possible.
The indicator is thought for real-time usage and includes several filters as well as the ability to estimate trendline angles.
🔶 USAGE
Trendlines can act as support/resistance, with a higher number of tests indicating a more significant support/resistance role.
A broken TrendLine can be indicative of a potential trend reversal. The script highlights breaks with a label.
Users can additionally filter trendlines, only showing trendlines whose angles fall within a user set range:
This allows for the removal of potential clutter from the chart but also helps keep steeper or more horizontal trendlines.
🔶 DETAILS
When a swing (pivot point) is found, a Trendline is drawn when certain conditions are fulfilled.
An essential condition is that a Bearish Trendline (red) always occurs on a lower high, while a Bullish Trendline (blue) occurs on a higher low.
Our implementation will first show an initial dotted-styled TrendLine on confirmation, after which a solid-styled secondary TrendLine will develop. The latter will be used for the real-time detection of breaks at that line:
Furthermore, the script allows you to add more conditions:
🔹 Length (Swings)
A swing develops when a high/low is the highest/lowest against x highs/lows on the left AND right of that bar. x can be set by "Length" in settings.
The following images clarify this. The script confirms a swing where the yellow flag is shown; the high (here visualized with a purple label) is the highest point against x bars left and right of that point.
At that moment, this swing is checked against the previous swing. If all conditions are fulfilled, an initial TrendLine is drawn on confirmation.
After that point, a secondary thicker solid line is seen which keeps progressing bar after bar, until:
• a new TrendLine is formed
• the TrendLine is broken
🔹 Breaks between Swings
Once there is confirmation that a TrendLine can be drawn, the script allows you to filter for breakthroughs on that line. This can be set with "Check breaks between"
Disabled : the initial TrendLine is allowed to be pierced:
Check breaks between point A - point B : no breaks are allowed between both Swing points:
Point A - Current bar : no breaks are allowed between the first Swing point and the point of confirmation ('current' bar):
🔹 TrendLine breaks
As mentioned, the secondary TrendLine (solid line) progresses bar after bar until a new TrendLine is formed or the TrendLine is broken. When a TrendLine is broken, the TrendLine stops progressing, but if there isn't a new TrendLine and price return back, the TrendLine will re-appear, potentially giving several signals when the TrendLine is broken again.
Minimal bars allow you to regulate the amount of signals when the TrendLine is broken.
-> The secondary TrendLine must be uninterrupted for at least x bars before a potential break can be considered.
The following example shows 1 signal against 3 by adjusting this setting from 2 to 5:
🔹 Angles
Angles should normally be calculated when the units of the X and Y axis are the same. However, on our charts, the unit of the X-axis is bar_index (bars), and on the Y-axis the unit is price (¥, €, £, $,...).
It is not easy to normalize and create reasonably valid angles. Often certain angle calculations can differ through price changes or volatility.
Our calculate_slope() function tries to make corresponding angles through all bars.
We do this by calculating the difference between the highest/lowest price values in a certain bar range. The bar range is our X-axis, and the price difference is our Y-axis.
Zooming in/out will not change the amount of bars or the price. Since it does change our view on the chart, and thereby how we see the angles, we have included a setting where you can personalize the ratio between X and Y-axis (Angles -> Ratio X-Y axis).
Settings: Angles - Ratio X-Y axis:
🔶 SETTINGS
🔹 Swings
Length: Lookback period for the detection of swing points.
🔹 Trendline validation
Check breaks between :
Disabled : the initial TrendLine is allowed to be pierced
Check breaks between point A - point B : no breaks are allowed between both Swing points
Point A - Current bar : no breaks are allowed between the first Swing point and the point of confirmation ('current' bar)
Source (breaks) : Source which invalidates TrendLine, default: close
🔹 TrendLine breaks
Minimal bars : The secondary TrendLine must be uninterrupted for at least x bars before a potential break can be considered.
🔹 Angles
Show : Toggle labels.
Ratio X-Y axis : Every user has his preferences regarding zoom, chart layout,...
If the shown angles are not according to your expectations, you can adjust this number.
Only TrendLine between : Only allow TrendLines between the minimum and maximum degrees. Set only the minimal and maximum values above 0.

Slark Signal - Telegram Alert---
Indicator Description: Slark Signal - Telegram Alert
The Slark Signal - Telegram Alert is a custom trading indicator designed to detect potential buy and sell signals based on pivots and trendlines. This indicator sends real-time alerts via Telegram when specific market conditions are met and provides automatic Stop-Loss (SL) and Take-Profit (TP) levels for better trade management.
---
What Does the Indicator Do?
Pivot-Based Signals: Detects significant pivot highs and lows to identify potential trend reversals.
Automatic SL and TP Levels: Projects customizable Stop-Loss and Take-Profit levels on the chart based on user-defined parameters.
Telegram Alerts: Sends buy or sell signals with relevant trade details (entry price, SL, and TP) to your Telegram channel when conditions are met.
Session-Based Signals: Limits the signals to a specific trading session (8:00 - 10:00).
---
How Does the Indicator Work?
Customizable Input Parameters:
- Pivot Detection Length: Defines the length used to detect pivot highs and lows.
- Slope Multiplier: Controls the slope of trendlines based on ATR.
- Session Start and End Hours: Specifies the time window during which signals can be generated.
- SL and TP Ticks: Defines the distance (in ticks) for Stop-Loss and Take-Profit levels.
- Telegram Chat ID: Input your Telegram chat ID to receive alerts in your Telegram channel.
Pivot Highs and Lows Detection:
- The indicator calculates pivot highs (PH) and pivot lows (PL) over the specified period, drawing trendlines for both based on the slope multiplier.
- Trendline Breakouts: When the price crosses above the upper trendline or below the lower trendline, it generates a buy or sell signal.
Signal Generation and Trade Levels:
- If a buy signal is detected, the indicator automatically sets and displays the entry price, Stop-Loss, and Take-Profit levels.
- The same applies for sell signals when a sell condition is met.
- Signals are valid only within the defined trading session (8:00 - 10:00).
Telegram Alerts:
- When a buy or sell signal is triggered, an alert with the trade details (entry price, SL, and TP) is sent to your Telegram chat via the chat ID you have provided.
---
How to Use the Indicator?
Set Up Input Parameters:
- Pivot Detection Length: Set the period for detecting pivot highs and lows (default: 5).
- Slope Multiplier: Adjust the slope multiplier for trendlines based on ATR (default: 0.4).
- SL and TP Ticks: Define the tick distance for SL and TP (default: SL = 100, TP = 300).
- Session Start and End Hours: Set the time window for signal generation (default: 8:00 - 10:00).
- Telegram Chat ID: Input your Telegram channel’s chat ID to receive alerts.
Interpreting Buy and Sell Signals:
- Buy Signal: When a buy condition is met, a label "COMPRA" is shown below the bar, and the system sends the signal to Telegram with all trade details.
- Sell Signal: When a sell condition is met, a label "VENTA" is displayed above the bar, and the system sends the corresponding alert to Telegram.
- The system ensures signals are only triggered during the defined session time (8:00 - 10:00).
Trade Planning and Risk Management:
- **Stop-Loss and Take-Profit:** Automatically drawn on the chart, use these levels to plan your trades.
- **Telegram Alerts:** Stay updated with real-time buy or sell signals in your Telegram channel for quick decision-making.
---
What Makes This Indicator Original?
Pivot and Trendline Logic: The indicator uses pivot highs and lows to draw dynamic trendlines, identifying key reversal points and breakouts.
Real-Time Telegram Alerts: Unique in its ability to send automatic alerts with detailed trade information directly to your Telegram channel, allowing you to act quickly on signals.
Built-In SL/TP Visualization: The system automatically calculates and displays SL and TP levels, making it easier to manage risk and reward.
Session-Based Signals: Helps traders focus on key trading hours by limiting signal generation to a specific time range.
---
Additional Considerations
Complement with Other Analysis: It is recommended to use this indicator in conjunction with other analysis tools to confirm trade setups.
Testing: Before using the indicator live, consider testing it on a demo account to fine-tune your settings.
Risk Management: Ensure that the SL and TP levels fit your trading strategy and risk tolerance.
Market Awareness: Stay informed about news and events that could impact market conditions during your trading session.
---
Example Configuration
To help you get started, here is an example configuration:
Pivot Detection Length: 5
Slope Multiplier: 0.4
SL Ticks: 100
TP Ticks: 300
Session Start Hour: 8
Session End Hour: 10
Telegram Chat ID: Input your unique Telegram chat ID here.
---
Conclusion
The Slark Signal - Telegram Alert indicator provides a highly customizable and automated solution for detecting buy and sell signals based on pivots and trendline breaks. By utilizing real-time alerts via Telegram, you can stay updated on key trading opportunities. It also offers automatic SL and TP levels, making trade planning and risk management straightforward.
Ready for immediate use in TradingView, this indicator can become a vital part of your trading strategy.
---

Parallel Projections [theEccentricTrader]█ OVERVIEW
This indicator automatically projects parallel trendlines or channels, from a single point of origin. In the example above I have applied the indicator twice to the 1D SPXUSD. The five upper lines (green) are projected at an angle of -5 from the 1-month swing high anchor point with a projection ratio of -72. And the seven lower lines (blue) are projected at an angle of 10 with a projection ratio of 36 from the 1-week swing low anchor point.
█ CONCEPTS
Green and Red Candles
• A green candle is one that closes with a high price equal to or above the price it opened.
• A red candle is one that closes with a low price that is lower than the price it opened.
Swing Highs and Swing Lows
• A swing high is a green candle or series of consecutive green candles followed by a single red candle to complete the swing and form the peak.
• A swing low is a red candle or series of consecutive red candles followed by a single green candle to complete the swing and form the trough.
Peak and Trough Prices (Basic)
• The peak price of a complete swing high is the high price of either the red candle that completes the swing high or the high price of the preceding green candle, depending on which is higher.
• The trough price of a complete swing low is the low price of either the green candle that completes the swing low or the low price of the preceding red candle, depending on which is lower.
Historic Peaks and Troughs
The current, or most recent, peak and trough occurrences are referred to as occurrence zero. Previous peak and trough occurrences are referred to as historic and ordered numerically from right to left, with the most recent historic peak and trough occurrences being occurrence one.
Support and Resistance
• Support refers to a price level where the demand for an asset is strong enough to prevent the price from falling further.
• Resistance refers to a price level where the supply of an asset is strong enough to prevent the price from rising further.
Support and resistance levels are important because they can help traders identify where the price of an asset might pause or reverse its direction, offering potential entry and exit points. For example, a trader might look to buy an asset when it approaches a support level , with the expectation that the price will bounce back up. Alternatively, a trader might look to sell an asset when it approaches a resistance level , with the expectation that the price will drop back down.
It's important to note that support and resistance levels are not always relevant, and the price of an asset can also break through these levels and continue moving in the same direction.
Trendlines
Trendlines are straight lines that are drawn between two or more points on a price chart. These lines are used as dynamic support and resistance levels for making strategic decisions and predictions about future price movements. For example traders will look for price movements along, and reactions to, trendlines in the form of rejections or breakouts/downs.
█ FEATURES
Inputs
• Anchor Point Type
• Swing High/Low Occurrence
• HTF Resolution
• Highest High/Lowest Low Lookback
• Angle Degree
• Projection Ratio
• Number Lines
• Line Color
Anchor Point Types
• Swing High
• Swing Low
• Swing High (HTF)
• Swing Low (HTF)
• Highest High
• Lowest Low
• Intraday Highest High (intraday charts only)
• Intraday Lowest Low (intraday charts only)
Swing High/Swing Low Occurrence
This input is used to determine which historic peak or trough to reference for swing high or swing low anchor point types.
HTF Resolution
This input is used to determine which higher timeframe to reference for swing high (HTF) or swing low (HTF) anchor point types.
Highest High/Lowest Low Lookback
This input is used to determine the lookback length for highest high or lowest low anchor point types.
Intraday Highest High/Lowest Low Lookback
When using intraday highest high or lowest low anchor point types, the lookback length is calculated automatically based on number of bars since the daily candle opened.
Angle Degree
This input is used to determine the angle of the trendlines. The output is expressed in terms of point or pips, depending on the symbol type, which is then passed through the built in math.todegrees() function. Positive numbers will project the lines upwards while negative numbers will project the lines downwards. Depending on the market and timeframe, the impact input values will have on the visible gaps between the lines will vary greatly. For example, an input of 10 will have a far greater impact on the gaps between the lines when viewed from the 1-minute timeframe than it would on the 1-day timeframe. The input is a float and as such the value passed through can go into as many decimal places as the user requires.
It is also worth mentioning that as more lines are added the gaps between the lines, that are closest to the anchor point, will get tighter as they make their way up the y-axis. Although the gaps between the lines will stay constant at the x2 plot, i.e. a distance of 10 points between them, they will gradually get tighter and tighter at the point of origin as the slope of the lines get steeper.
Projection Ratio
This input is used to determine the distance between the parallels, expressed in terms of point or pips. Positive numbers will project the lines upwards while negative numbers will project the lines downwards. Depending on the market and timeframe, the impact input values will have on the visible gaps between the lines will vary greatly. For example, an input of 10 will have a far greater impact on the gaps between the lines when viewed from the 1-minute timeframe than it would on the 1-day timeframe. The input is a float and as such the value passed through can go into as many decimal places as the user requires.
Number Lines
This input is used to determine the number of lines to be drawn on the chart, maximum is 500.
█ LIMITATIONS
All green and red candle calculations are based on differences between open and close prices, as such I have made no attempt to account for green candles that gap lower and close below the close price of the preceding candle, or red candles that gap higher and close above the close price of the preceding candle. This may cause some unexpected behaviour on some markets and timeframes. I can only recommend using 24-hour markets, if and where possible, as there are far fewer gaps and, generally, more data to work with.
If the lines do not draw or you see a study error saying that the script references too many candles in history, this is most likely because the higher timeframe anchor point is not present on the current timeframe. This problem usually occurs when referencing a higher timeframe, such as the 1-month, from a much lower timeframe, such as the 1-minute. How far you can lookback for higher timeframe anchor points on the current timeframe will also be limited by your Trading View subscription plan. Premium users get 20,000 candles worth of data, pro+ and pro users get 10,000, and basic users get 5,000.
█ RAMBLINGS
It is my current thesis that the indicator will work best when used in conjunction with my Wavemeter indicator, which can be used to set the angle and projection ratio. For example, the average wave height or amplitude could be used as the value for the angle and projection ratio inputs. Or some factor or multiple of such an average. I think this makes sense as it allows for objectivity when applying the indicator across different markets and timeframes with different energies and vibrations.
“If you want to find the secrets of the universe, think in terms of energy, frequency and vibration.”
― Nikola Tesla

Fan Projections [theEccentricTrader]█ OVERVIEW
This indicator automatically projects trendlines in the shape of a fan, from a single point of origin. In the example above I have applied the indicator twice to the 1D SPXUSD. The seven upper lines (green) are projected at an angle of -5 from the 1-month swing high anchor point. And the five lower lines (blue) are projected at an angle of 10 from the 1-week swing low anchor point.
█ CONCEPTS
Green and Red Candles
• A green candle is one that closes with a high price equal to or above the price it opened.
• A red candle is one that closes with a low price that is lower than the price it opened.
Swing Highs and Swing Lows
• A swing high is a green candle or series of consecutive green candles followed by a single red candle to complete the swing and form the peak.
• A swing low is a red candle or series of consecutive red candles followed by a single green candle to complete the swing and form the trough.
Peak and Trough Prices (Basic)
• The peak price of a complete swing high is the high price of either the red candle that completes the swing high or the high price of the preceding green candle, depending on which is higher.
• The trough price of a complete swing low is the low price of either the green candle that completes the swing low or the low price of the preceding red candle, depending on which is lower.
Historic Peaks and Troughs
The current, or most recent, peak and trough occurrences are referred to as occurrence zero. Previous peak and trough occurrences are referred to as historic and ordered numerically from right to left, with the most recent historic peak and trough occurrences being occurrence one.
Support and Resistance
• Support refers to a price level where the demand for an asset is strong enough to prevent the price from falling further.
• Resistance refers to a price level where the supply of an asset is strong enough to prevent the price from rising further.
Support and resistance levels are important because they can help traders identify where the price of an asset might pause or reverse its direction, offering potential entry and exit points. For example, a trader might look to buy an asset when it approaches a support level , with the expectation that the price will bounce back up. Alternatively, a trader might look to sell an asset when it approaches a resistance level , with the expectation that the price will drop back down.
It's important to note that support and resistance levels are not always relevant, and the price of an asset can also break through these levels and continue moving in the same direction.
Trendlines
Trendlines are straight lines that are drawn between two or more points on a price chart. These lines are used as dynamic support and resistance levels for making strategic decisions and predictions about future price movements. For example traders will look for price movements along, and reactions to, trendlines in the form of rejections or breakouts/downs.
█ FEATURES
Inputs
• Anchor Point Type
• Swing High/Low Occurrence
• HTF Resolution
• Highest High/Lowest Low Lookback
• Angle Degree
• Number Lines
• Line Color
Anchor Point Types
• Swing High
• Swing Low
• Swing High (HTF)
• Swing Low (HTF)
• Highest High
• Lowest Low
• Intraday Highest High (intraday charts only)
• Intraday Lowest Low (intraday charts only)
Swing High/Swing Low Occurrence
This input is used to determine which historic peak or trough to reference for swing high or swing low anchor point types.
HTF Resolution
This input is used to determine which higher timeframe to reference for swing high (HTF) or swing low (HTF) anchor point types.
Highest High/Lowest Low Lookback
This input is used to determine the lookback length for highest high or lowest low anchor point types.
Intraday Highest High/Lowest Low Lookback
When using intraday highest high or lowest low anchor point types, the lookback length is calculated automatically based on number of bars since the daily candle opened.
Angle Degree
This input is used to determine the angle of the trendlines. The output is expressed in terms of point or pips, depending on the symbol type, which is then passed through the built in math.todegrees() function. Positive numbers will project the lines upwards while negative numbers will project the lines downwards. Depending on the market and timeframe, the impact input values will have on the visible gaps between the lines will vary greatly. For example, an input of 10 will have a far greater impact on the gaps between the lines when viewed from the 1-minute timeframe than it would on the 1-day timeframe. The input is a float and as such the value passed through can go into as many decimal places as the user requires.
It is also worth mentioning that as more lines are added the gaps between the lines, that are closest to the anchor point, will get tighter as they make their way up the y-axis. Although the gaps between the lines will stay constant at the x2 plot, i.e. a distance of 10 points between them, they will gradually get tighter and tighter at the point of origin as the slope of the lines get steeper.
Number Lines
This input is used to determine the number of lines to be drawn on the chart, maximum is 500.
█ LIMITATIONS
All green and red candle calculations are based on differences between open and close prices, as such I have made no attempt to account for green candles that gap lower and close below the close price of the preceding candle, or red candles that gap higher and close above the close price of the preceding candle. This may cause some unexpected behaviour on some markets and timeframes. I can only recommend using 24-hour markets, if and where possible, as there are far fewer gaps and, generally, more data to work with.
If the lines do not draw or you see a study error saying that the script references too many candles in history, this is most likely because the higher timeframe anchor point is not present on the current timeframe. This problem usually occurs when referencing a higher timeframe, such as the 1-month, from a much lower timeframe, such as the 1-minute. How far you can lookback for higher timeframe anchor points on the current timeframe will also be limited by your Trading View subscription plan. Premium users get 20,000 candles worth of data, pro+ and pro users get 10,000, and basic users get 5,000.
█ RAMBLINGS
It is my current thesis that the indicator will work best when used in conjunction with my Wavemeter indicator, which can be used to set the angle. For example, the average wave height or amplitude could be used as the value for the angle input. Or some factor or multiple of such an average. I think this makes sense as it allows for objectivity when applying the indicator across different markets and timeframes with different energies and vibrations.
“If you want to find the secrets of the universe, think in terms of energy, frequency and vibration.”
― Nikola Tesla

TraderDemircan Auto Fibonacci RetracementDescription:
What This Indicator Does:This indicator automatically identifies significant swing high and swing low points within a customizable lookback period and draws comprehensive Fibonacci retracement and extension levels between them. Unlike the manual Fibonacci tool that requires you to constantly redraw levels as price action evolves, this automated version continuously updates the Fibonacci grid based on the most recent major swing points, ensuring you always have current and relevant support/resistance zones displayed on your chart.Key Features:
Automatic Swing Detection: Continuously scans the specified lookback period to find the most significant high and low points, eliminating manual drawing errors
Comprehensive Level Coverage: Plots 16 Fibonacci levels including 7 retracement levels (0.0 to 1.0) and 9 extension levels (1.115 to 3.618)
Top-Down Methodology: Draws from swing high to swing low (right-to-left), following the traditional Fibonacci retracement convention where 100% is at the top
Dual Labeling System: Shows both exact price values and Fibonacci percentages for easy reference
Complete Customization: Individual toggle controls and color selection for each of the 16 levels
Flexible Display Options: Adjust line thickness (1-5), style (solid/dashed/dotted), and extension direction (left/right/both)
Visual Swing Markers: Red diamond at the swing high (starting point) and green diamond at the swing low (ending point)
Optional Trend Line: Connects the two swing points to visualize the overall price movement direction
How It Works:The indicator employs a sophisticated swing point detection algorithm that operates in two stages:Stage 1 - Find the Swing Low (Support Base):
Scans the entire lookback period to identify the lowest low, which becomes the anchor point (0.0 level in traditional retracement terms, though displayed at the bottom of the grid).Stage 2 - Find the Swing High (Resistance Peak):
After identifying the swing low, searches for the highest high that occurred after that low point, establishing the swing range. This creates a valid price movement range for Fibonacci analysis.Fibonacci Calculation Method:
The indicator uses the top-down approach where:
1.0 Level = Swing High (100% retracement, the top)
0.0 Level = Swing Low (0% retracement, the bottom)
Retracement Levels (0.236 to 0.786) = Potential support zones during pullbacks from the high
Extension Levels (1.115 to 3.618) = Potential target zones below the swing low
Formula: Price = SwingHigh - (SwingHigh - SwingLow) × FibonacciLevelThis ensures that 0.0 is at the bottom and extensions (>1.0) plot below the swing low, following standard Fibonacci retracement convention.Fibonacci Levels Explained:Retracement Levels (0.0 - 1.0):
0.0 (Gray): Swing low - the base support level
0.236 (Red): Shallow retracement, first minor support
0.382 (Orange): Moderate retracement, commonly watched support
0.5 (Purple): Psychological midpoint, significant support/resistance
0.618 (Blue - Golden Ratio): The most important retracement level, high-probability reversal zone
0.786 (Cyan): Deep retracement, last defense before full reversal
1.0 (Gray): Swing high - the initial resistance level
Extension Levels (1.115 - 3.618):
1.115 (Green): First extension, minimal downside target
1.272 (Light Green): Minor extension, common profit target
1.414 (Yellow-Green): Square root of 2, mathematical significance
1.618 (Gold - Golden Extension): Primary downside target, most watched extension level
2.0 (Orange-Red): 200% extension, psychological round number
2.382 (Pink): Secondary extension target
2.618 (Purple): Deep extension, major target zone
3.272 (Deep Purple): Extreme extension level
3.618 (Blue): Maximum extension, rare but powerful target
How to Use:For Retracement Trading (Buying Pullbacks in Uptrends):
Wait for price to make a significant move up from swing low to swing high
When price starts pulling back, watch for reactions at key Fibonacci levels
Most common entry zones: 0.382, 0.5, and especially 0.618 (golden ratio)
Enter long positions when price shows reversal signals (candlestick patterns, volume increase) at these levels
Place stop loss below the next Fibonacci level
Target: Return to swing high or higher extension levels
For Extension Trading (Profit Targets):
After price breaks below the swing low (0.0 level), use extensions as profit targets
First target: 1.272 (conservative)
Primary target: 1.618 (golden extension - most commonly reached)
Extended target: 2.618 (for strong trends)
Extreme target: 3.618 (only in powerful trending moves)
For Counter-Trend Trading (Fading Extremes):
When price reaches deep retracements (0.786 or below), look for exhaustion signals
Watch for divergences between price and momentum indicators at these levels
Enter reversal trades with tight stops below the swing low
Target: 0.5 or 0.382 levels on the bounce
For Trend Continuation:
In strong uptrends, shallow retracements (0.236 to 0.382) often hold
Use these as low-risk entry points to join the existing trend
Failure to hold 0.5 suggests weakening momentum
Breaking below 0.618 often indicates trend reversal, not just retracement
Multi-Timeframe Strategy:
Use daily timeframe Fibonacci for major support/resistance zones
Use 4H or 1H Fibonacci for precise entry timing within those zones
Confluence between multiple timeframe Fibonacci levels creates high-probability zones
Example: Daily 0.618 level aligning with 4H 0.5 level = strong support
Settings Guide:Lookback Period (10-500):
Short (20-50): Captures recent swings, more frequent updates, suited for day trading
Medium (50-150): Balanced approach, good for swing trading (default: 100)
Long (150-500): Identifies major market structure, suited for position trading
Higher values = more stable levels but slower to adapt to new trends
Pivot Sensitivity (1-20):
Controls how many candles are required to confirm a swing point
Low (1-5): More sensitive, identifies minor swings (default: 5)
High (10-20): Less sensitive, only major swings qualify
Use higher sensitivity on lower timeframes to filter noise
Individual Level Toggles:
Enable only the levels you actively trade to reduce chart clutter
Common minimalist setup: Show only 0.382, 0.5, 0.618, 1.0, 1.618, 2.618
Comprehensive setup: Enable all levels for maximum information
Visual Customization:
Line Thickness: Thicker lines (3-5) for presentation, thinner (1-2) for trading
Line Style: Solid for primary levels (0.5, 0.618, 1.618), dashed/dotted for secondary
Price Labels: Essential for knowing exact entry/exit prices
Percent Labels: Helpful for quickly identifying which Fibonacci level you're looking at
Extension Direction: Extend right for forward-looking analysis, left for historical context
What Makes This Original:While Fibonacci indicators are common on TradingView, this script's originality comes from:
Intelligent Two-Stage Detection: Unlike simple high/low finders, this uses a sequential approach (find low first, then find the high that occurred after it), ensuring logical price flow representation
Comprehensive Level Set: Includes 16 levels spanning from retracement to extreme extensions, more than most Fibonacci tools
Top-Down Methodology: Properly implements the traditional Fibonacci retracement convention (high to low) rather than the reverse
Automatic Range Validation: Only draws Fibonacci when both swing points are valid and in the correct temporal order
Dual Extension Options: Separate controls for extending lines left (historical context) and right (forward projection)
Smart Label Positioning: Places percentage labels on the left and price labels on the right for clarity
Visual Swing Confirmation: Diamond markers at swing points help users understand why levels are positioned where they are
Important Considerations:
Historical Nature: Fibonacci retracements are based on past price swings; they don't predict future moves, only suggest potential support/resistance
Self-Fulfilling Prophecy: Fibonacci levels work partly because many traders watch them, creating actual support/resistance at those levels
Not All Levels Hold: In strong trends, price may slice through multiple Fibonacci levels without pausing
Context Matters: Fibonacci works best when aligned with other support/resistance (previous highs/lows, moving averages, trendlines)
Volume Confirmation: The most reliable Fibonacci reversals occur with volume spikes at key levels
Dynamic Updates: The levels will redraw as new swing highs/lows form, so don't rely solely on static screenshots
Best Practices:
Don't Trade Blindly: Fibonacci levels are zones, not exact prices. Look for confirmation (candlestick patterns, indicators, volume)
Combine with Price Action: Watch for pin bars, engulfing candles, or doji at key Fibonacci levels
Use Stop Losses: Place stops beyond the next Fibonacci level to give trades room but limit risk
Scale In/Out: Consider entering partial positions at 0.5 and adding more at 0.618 rather than all-in at one level
Check Multiple Timeframes: Daily Fibonacci + 4H Fibonacci convergence = high-probability zone
Respect the 0.618: This golden ratio level is historically the most reliable for reversals
Extensions Need Strong Trends: Don't expect extensions to be hit unless there's clear momentum beyond the swing low
Optimal Timeframes:
Scalping (1-5 minutes): Lookback 20-30, watch 0.382, 0.5, 0.618 only
Day Trading (15m-1H): Lookback 50-100, all retracement levels important
Swing Trading (4H-Daily): Lookback 100-200, focus on 0.5, 0.618, 0.786, and extensions
Position Trading (Daily-Weekly): Lookback 200-500, all levels relevant for long-term planning
Common Fibonacci Trading Mistakes to Avoid:
Wrong Swing Selection: Choosing insignificant swings produces meaningless levels
Premature Entry: Entering as soon as price touches a Fibonacci level without confirmation
Ignoring Trend: Fighting the main trend by buying deep retracements in downtrends
Over-Reliance: Using Fibonacci in isolation without confirming with other technical factors
Static Analysis: Not updating your Fibonacci as market structure evolves
Arbitrary Lookback: Using the same lookback period for all assets and timeframes
Integration with Other Tools:Fibonacci + Moving Averages:
When 0.618 level aligns with 50 or 200 EMA, confluence creates stronger support
Price bouncing from both Fibonacci and MA simultaneously = high-probability trade
Fibonacci + RSI/Stochastic:
Oversold indicators at 0.618 or deeper retracements = strong buy signal
Overbought indicators at swing high (1.0) = potential reversal warning
Fibonacci + Volume Profile:
High-volume nodes aligning with Fibonacci levels create robust support/resistance
Low-volume areas near Fibonacci levels may see rapid price movement through them
Fibonacci + Trendlines:
Fibonacci retracement level + ascending trendline = double support
Breaking both simultaneously confirms trend change
Technical Notes:
Uses ta.lowest() and ta.highest() for efficient swing detection across the lookback period
Implements dynamic line and label arrays for clean redraws without memory leaks
All calculations update in real-time as new bars form
Extension options allow customization without modifying core code
Format.mintick ensures price labels match the symbol's minimum price increment
Tooltip on swing markers shows exact price values for precision

MEGA Ultimate MTF SwingTradingView Script Description: MEGA Ultimate MTF Swing
Overview
The "MEGA Ultimate MTF Swing" is a sophisticated, multi-timeframe (MTF) swing trading indicator designed for the 4-hour chart. It integrates trend analysis, price action signals, and dynamic support/resistance levels from higher timeframes (1H and 45M) to provide high-probability entry and exit points. The system is built to identify the start of new swing moves, manage risk with clear profit targets and stop-losses, and warn you of potential reversals.
Core Philosophy: To catch the beginning of a new trend direction on the 4H chart, using MTF levels for confirmation, and to manage the trade with a structured target/stop framework until the swing is complete.
Key Features & How It Works
1. 4H Trend Framework & Entry Signals
Trend Definition: The script uses a Simple Moving Average (SMA) to define the primary trend. A crossover above the SMA generates a BUY signal; a crossover below generates a SELL signal.
Sloping Trendlines: It automatically draws dynamic support and resistance lines by connecting the most recent significant 4H pivot highs and lows. This helps visualize the broader trend channel.
2. Multi-Timeframe (MTF) Confirmation
This is a core strength of the script. For each new 4H signal, it fetches the most significant Resistance (for buys) and Support (for sells) levels from the 1-hour and 45-minute charts.
These MTF levels are displayed as horizontal dashed lines inside the trade box, showing you the immediate barriers price must overcome for the trade to continue in your favor.
3. Structured Trade Management (Boxes, Targets & Stops)
Upon a new signal, the script draws a clear visual box on the chart.
For BUY Signals: The box spans from the Stop Loss (below entry) to the Profit Target (above entry).
For SELL Signals: The box spans from the Profit Target (below entry) to the Stop Loss (above entry).
Profit Target: Calculated as a percentage above (for long) or below (for short) the recent high/low.
Stop Loss: A tight, fixed percentage below (for long) or above (for short) the entry price, designed to protect your capital. The "Use wider targets/stops" input allows you to adjust risk tolerance.
4. Advanced Price Action & Alert System
Candle Pattern Detection: The script analyzes individual candles, labeling strong patterns like Engulfing Bars, Pin Bars, and Dojis to give context to the market's momentum.
"Caution" Labels: A smart warning system activates if the price approaches the edge of the trade box (i.e., near its stop or target) or touches a 4H trendline, signaling potential exhaustion.
"Trade Getting Reverse" Warning: If strong opposing price action is detected against your active trade position, a prominent label appears, suggesting a possible early reversal.
5. Actionable Trade Dashboard
A clean table at the bottom-right corner provides an at-a-glance summary.
It tells you the current Recommendation (e.g., "BUY SIGNAL," "WAITING," "EXCELLENT TRADE"), a short Analysis, and a Context line that often includes the current trade's profit/loss percentage.
6. Comprehensive Alerts
You can set alerts for various events:
Basic BUY/SELL entry signals.
Enhanced entries with MTF confirmation.
Warnings when price is near a 4H trendline.
How to Use This Script - A Step-by-Step Guide
Step 1: Setup
Apply the script to a 4-hour (4H) chart. It will not work on other timeframes.
Customize the visuals and logic in the "Inputs" tab to your preference (e.g., colors, whether to show boxes, alert settings).
Step 2: Identifying a Trade
Wait for a BUY or SELL label to appear on a closed 4H candle.
A colored box will appear, projecting the next ~20 bars. The top and bottom of this box are your Profit Target and Stop Loss.
Confirm with MTF: Look inside the box for the 1H and 45M levels. A strong signal will have the price breaking through these levels.
Step 3: Managing the Trade
Ideal Scenario: The price moves steadily towards your target without touching the stop. The dashboard will show positive profit percentages.
Exit on Completion: The trade is considered complete and all visuals are cleared once the price touches either the target or the stop loss.
Watch for Warnings: Pay close attention to "Caution" and "Trade Getting Reverse" labels. They are your cue to consider an early exit to protect profits or minimize losses.
Step 4: Post-Trade
After a trade completes, the dashboard will show "TRADE COMPLETED." Wait for the next clean signal to enter a new position.
Input Settings Summary
Visuals: Toggle boxes, trendlines, and the dashboard on/off.
Logic: Adjust the MA length and choose between tighter or wider stops/targets.
MTF Settings: Configure the lookback period for finding 1H/45M highs and lows.
4H Trendline Settings: Adjust the sensitivity for identifying pivot points and trendline touches.
Alerts: Enable/disable different types of push notifications and audible alerts.
Optimization: Manage script performance with object cleanup and trade duration limits.

Confluence Tiered Bullish Entries (MTF Trend Confirm)Draws only the key trendlines: previous day’s high/low, last completed 4H high/low, and last completed 1H high/low.
Fires an alert the instant price touches any of those lines.
Detects bullish Fair Value Gaps (early, as they form), then marks a confluence only when price revisits that FVG.
Confirms with a volume spike + a green candle that closes near the bottom of its range (tunable).
Labels entries as Tier 3 (one confluence), Tier 2 (two), or Tier 1 BUY (all three).
Only shows those trendlines and bullish entry labels on chart.
SMC style josh )SMC style josh — FVG, OB, BOS/CHoCH, EQH/EQL, PD, HTF, Trendlines
What it does
A clean-room Smart-Money–style study that visualizes market structure and liquidity concepts:
Structure: BOS & CHoCH for swing and internal legs (width/style controls, preview of last pivots)
Order Blocks: internal & swing OBs with midline (50%), mitigated/invalid handling, optional auto Breaker creation
Fair Value Gaps (FVG): auto boxes with optional 50% line, ATR filter, extend length, and “after-CHoCH only” window
Equal High/Low (EQH/EQL): ATR-based proximity threshold
Liquidity Grabs: wick-through/close-back tags
Premium/Discount (PD) zones: live boxes + equilibrium line from latest swing range
HTF levels: previous Daily/Weekly/Monthly highs/lows with labels (PDH/PDL, PWH/PWL, PMH/PML)
Trendlines: auto swing-to-swing lines (liquidity)
Confluence Score: column plot summarizing recent events (+/− weighting)
Key options
Safety switch to pause all drawings
Per-module visibility, label sizes/colors, line styles/widths
ATR-based filters for impulses and gaps
Limits for lines/labels/boxes to avoid runtime errors
How to read
BOS = continuation break of the current leg; CHoCH = potential regime shift
OB mitigated when price returns into the block; invalid when price closes beyond; mitigated-then-invalid can form a Breaker
FVG is considered “filled” when price closes through the gap boundary (optional hide/gray-out)
Strong/Weak High/Low tags reflect the active swing bias (potential liquidity/targets)
Good practice
Combine with risk management, multiple timeframes, and your own rules. All drawings are for study/visualization; signals are not trade instructions.
Compliance / Disclaimer
This script is for educational and research purposes only. It is not financial advice or a solicitation to buy/sell any asset. Past performance does not guarantee future results. Always test and manage risk responsibly.
License / Credits
Built with Pine Script® v5. “SMC style josh” is an original, clean-room implementation and does not reuse third-party code.
Z Distance from VWAP Enhanced (ZVWAP)The "Z Distance from VWAP Enhanced" (ZVWAP) indicator is a comprehensive oscillator that provides deep insights into market dynamics. It calculates a Z-score, which tells you how many standard deviations the current price is away from the VWAP. This normalization makes it a consistent and reliable tool for identifying market extremes.
The indicator comes packed with features, including:
Customizable Overbought & Oversold Zones
Built-in Bullish & Bearish Divergence Detection
Automatic Trendline Plotting
A Moving Exponential Average (MEA) for crossover signals
Fully customizable alerts for every key event.
How to Use It - The BTC Dominance Strategy for Altcoins
As shown in the screenshot, this indicator is an exceptional tool for trading altcoins by analyzing the BTC Dominance (BTC.D) chart. The relationship is typically inverse:
When ZVWAP on BTC.D is RISING (or Overbought) ➔ It's BEARISH for Altcoins.
This means Bitcoin is gaining dominance, and capital is flowing out of altcoins and into Bitcoin. This is a time to be cautious with or short altcoins.
When ZVWAP on BTC.D is FALLING (or Oversold) ➔ It's BULLISH for Altcoins.
This means Bitcoin is losing dominance, and capital is flowing into altcoins, often starting an "altcoin season." This is a great time to look for long entries on your favorite altcoins.
Key Signals on the BTC.D Chart:
Zone Entries: When ZVWAP enters the red (Overbought) zone, prepare for altcoins to weaken. When it enters the blue (Oversold) zone, look for altcoin strength.
MEA Crossover: A crossover of the yellow ZVWAP line below the cyan MEA line is a strong confirmation that dominance is falling and the trend is becoming bullish for altcoins.
Divergences: A bearish divergence on the BTC.D chart can be an early warning that dominance is about to fall, signaling a potential bullish move for altcoins.
Key Features Explained
Overbought / Oversold Zones: The red and blue shaded areas clearly define when an asset is statistically over-extended. These are prime areas to look for mean reversion or trend exhaustion.
Divergence Detection: The script automatically detects and plots divergences between price and the ZVWAP.
• Bullish Divergence: Price makes a lower low, but ZVWAP makes a higher low. (Potential buy signal).
• Bearish Divergence: Price makes a higher high, but ZVWAP makes a lower high. (Potential sell signal).
The Reference Lines (+1 / -1): These gray lines represent one standard deviation from the VWAP. They act as an early warning system. When the ZVWAP crosses these lines, it shows that momentum is building, and the price is starting to deviate significantly from its average.
Automatic Trendlines: The indicator can automatically draw and manage trendlines based on recent pivots in the ZVWAP, helping you visualize the current momentum and potential breakout points. This feature can be turned off if you prefer a cleaner chart.
Customization and Alerts
The indicator is fully customizable. You can adjust the lengths, zone levels, and visual settings to fit your trading style. Most importantly, it includes a comprehensive set of alerts:
Enter Overbought Zone
Enter Oversold Zone
Bullish Divergence Detected
Bearish Divergence Detected
Enter Any Zone (OB/OS) - a single alert for either condition.
Any Divergence (Bull/Bear) - a single alert for any divergence.
This allows you to stay informed of every important signal without having to watch the charts all day.
i.imgur.com

Volume Based Analysis V 1.00
Volume Based Analysis V1.00 – Multi-Scenario Buyer/Seller Power & Volume Pressure Indicator
Description:
1. Overview
The Volume Based Analysis V1.00 indicator is a comprehensive tool for analyzing market dynamics using Buyer Power, Seller Power, and Volume Pressure scenarios. It detects 12 configurable scenarios combining volume-based calculations with price action to highlight potential bullish or bearish conditions.
When used in conjunction with other technical tools such as Ichimoku, Bollinger Bands, and trendline analysis, traders can gain a deeper and more reliable understanding of the market context surrounding each signal.
2. Key Features
12 Configurable Scenarios covering Buyer/Seller Power convergence, divergence, and dominance
Advanced Volume Pressure Analysis detecting when both buy/sell volumes exceed averages
Global Lookback System ensuring consistency across all calculations
Dominance Peak Module for identifying strongest buyer/seller dominance at structural pivots
Real-time Signal Statistics Table showing bullish/bearish counts and volume metrics
Fully customizable inputs (SMA lengths, multipliers, timeframes)
Visual chart markers (S01 to S12) for clear on-chart identification
3. Usage Guide
Enable/Disable Scenarios: Choose which signals to display based on your trading strategy
Fine-tune Parameters: Adjust SMA lengths, multipliers, and lookback periods to fit your market and timeframe
Timeframe Control: Use custom lower timeframes for refined up/down volume calculations
Combine with Other Indicators:
Ichimoku: Confirm volume-based bullish signals with cloud breakouts or trend confirmation
Bollinger Bands: Validate divergence/convergence signals with overbought/oversold zones
Trendlines: Spot high-probability signals at breakout or retest points
Signal Tables & Peaks: Read buy/sell volume dominance at a glance, and activate the Dominance Peak Module to highlight key turning points.
4. Example Scenarios & Suggested Images
Image #1 – S01 Bullish Convergence Above Zero
S01 activated, Buyer Power > 0, both buyer power slope & price slope positive, above-average buy volume. Show S01 ↑ marker below bar.
Image #2 – Combined with Ichimoku
Display a bullish scenario where price breaks above Ichimoku cloud while S01 or S09 bullish signal is active. Highlight both the volume-based marker and Ichimoku cloud breakout.
Image #3 – Combined with Bollinger Bands & Trendlines
Show a bearish S10 signal at the upper Bollinger Band near a descending trendline resistance. Highlight the confluence of the volume pressure signal with the band touch and trendline rejection.
Image #4 – Dominance Peak Module
Pivot low with green ▲ Bull Peak and pivot high with red ▼ Bear Peak, showing strong dominance counts.
Image #5 – Statistics Table in Action
Bottom-left table showing buy/sell volume, averages, and bullish/bearish counts during an active market phase.
5. Feedback & Collaboration
Your feedback and suggestions are welcome — they help improve and refine this system. If you discover interesting use cases or have ideas for new features, please share them in the script’s comments section on TradingView.
6. Disclaimer
This script is for educational purposes only. It is not financial advice. Past performance does not guarantee future results. Always do your own analysis before making trading decisions.
Tip: Use this tool alongside trend confirmation indicators for the most robust signal interpretation.

TrendZoneTrendZone - Fibonacci Trendline Indicator
TrendZone is a custom Pine Script indicator that automatically draws fibonacci-based trendlines between key pivot points on your chart.
Key Features:
3 Pivot Points: Set start point, major pivot (reversal), and end point
Dual Trendlines: First trendline (Point 1 → 2) and second trendline (Point 2 → 3)
Fibonacci Levels: Automatically draws 25%, 50%, and 100% fibonacci levels for each trendline
Auto Trend Detection: Automatically identifies bullish/bearish trends and adjusts colors accordingly
Customizable: Full control over colors, line styles, and widths for each fibonacci level
How it Works:
The indicator uses your selected pivot points to create two connected trendline systems. Point 2 serves as the major pivot where the first trend ends and the reversal begins. Each trendline system includes fibonacci retracement levels that extend to the right, helping identify potential support/resistance zones.
Use Cases:
Identifying trend reversals at key pivot points
Finding potential support/resistance levels using fibonacci projections
Visualizing market structure changes between different time periods
Planning entries/exits based on fibonacci trendline interactions
Perfect for traders who use fibonacci analysis combined with trend structure to identify high-probability trading zones.
Auto FaustAuto Faust – Intraday Market Context & Structure
Auto Faust is a visual market overlay designed for intraday traders who want fast context without relying on signals or automation. It combines classic price tools — VWAP, EMAs, RSI, Chop Score, and market structure trendlines — into a single glanceable dashboard.
🔍 What It Does:
VWAP (Volume Weighted Average Price): Shows the day's fair value price anchor.
EMAs (3, 21, 113, 200): Map short-term to long-term trend alignment. Crossovers can be used for confluence or caution.
RSI (10): Monitors local momentum. Displayed in a compact table.
Chop Score: Measures how directional price action is. High chop = ranging conditions; low = trending.
Session High/Low Tracker: Tracks the daily extremes in real-time.
Volume Monitor: Shows current candle volume, color-coded vs previous bar (green = higher, red = lower).
Dynamic Support & Resistance Lines: Plotted from pivot highs/lows (not static levels).
Automatic Trendlines: Drawn from swing structure, updating live.
📊 How to Use:
Use EMAs + VWAP alignment to assess directional bias.
Confirm clean trends with low Chop Score and RSI support.
Watch for price interaction around dynamic S/R lines and trendline breaks.
Use volume coloring to assess if momentum is increasing or fading.
No buy/sell signals are generated — this is a trader-facing tool to guide discretionary decision-making.

Dow waveform analyzerDow Waveform Analyzer
1. Overview and Features of the Indicator
This indicator is a tool designed to analyze chart waveforms based on Dow Theory, identifying swing lows (support) and swing highs (resistance). It allows users to quickly and consistently determine trend direction. Compared to manual analysis, it provides more efficient and accurate results.
By using swing lows and swing highs, the indicator offers a more detailed understanding of trends than simple updates to highs and lows, aiding in the creation of effective trading strategies.
2. Identifying Wave Lows and Highs
Stock prices do not move in straight lines; instead, they rise and fall in waves. This indicator starts by identifying the wave lows and wave highs.
- Wave Low: The lowest point during a temporary price decline.
- Wave High: The highest point during a temporary price increase.
These are automatically identified using Pine Script’s built-in functions `pivotlow` and `pivothigh`.
3. Drawing the Waveform
The identified wave lows and highs are alternately connected to draw the waveform. However, there are cases where wave lows or highs occur consecutively:
- Consecutive Wave Lows: The lower low is used for drawing the waveform.
- Consecutive Wave Highs: The higher high is used for drawing the waveform.
4. Tracking Swing Lows/Highs and Trend Determination
Swing lows and swing highs are crucial markers that indicate the state of wave progression:
- Swing Low: The starting point of a wave (wave low) when the closing price exceeds the previous wave high.
- Swing High: The starting point of a wave (wave high) when the closing price falls below the previous wave low.
The changes in swing lows and swing highs as the waves progress allow for trend state determination.
5. Examples of Trend States
During an Uptrend:
- When the price surpasses a wave high, the swing low is updated, confirming the continuation of the uptrend.
End of an Uptrend:
- When the price falls below the swing low, the swing low disappears, and a swing high appears, signaling the end of the uptrend.
Sideways Movement:
- Swing lows and swing highs alternately appear, indicating a sideways trend.
Start of a Downtrend:
- When the price breaks below a wave low for the first time, the swing high is updated, confirming the start of the downtrend.
During a Downtrend:
- When the price breaks below a wave low, the swing high is updated, confirming the continuation of the downtrend.
End of a Downtrend:
- When the price surpasses a wave high, the swing high disappears, and a swing low reappears, signaling the end of the downtrend.
Restart of an Uptrend:
- When the swing low is updated, the uptrend resumes. The uptrend begins when the price surpasses a wave high, and the swing low is updated for the first time.
6. Applications
Trade Entries and Exits:
- Set stop orders for entry at the price level where a trend starts.
- Set stop orders for exit at the price level where a trend ends.
Trend Filtering:
- Use the indicator to confirm whether market conditions are suitable for entry based on the trend state. Analyze waveforms to aid trading strategies.
Guide for Drawing Trendlines:
- Utilize wave lows and highs as starting and ending points when drawing trendlines with drawing tools.
7. Parameters and Display Items
Pivot Points:
- Wave lows are marked with circles below the candlestick’s low, and wave highs are marked with circles above the candlestick’s high.
Number of Bars for Pivot Calculation:
- Specify the number of bars on either side used to identify highs (default: 2).
Waveform:
- Specify the color (default: blue) or toggle its visibility (default: visible).
Swing Lows/Highs:
- Displayed as large circles. The rightmost large circle on the chart indicates the current swing low or swing high. Historical swing points are also displayed to show the progression of state changes. Specify the color (default: green) or toggle visibility (default: visible).
1. インジケーターの概要と特徴
このインジケーターは、ダウ理論を基にチャートの波形を分析し、押し安値や戻り高値を特定するツールです。これにより、トレンドの方向を迅速かつ一貫して判断できます。手動での分析と比較して、効率的かつ精度の高い結果が得られる点が特徴です。
押し安値や戻り高値を利用することで、単純な高値・安値の更新よりも詳細にトレンドの状況を把握し、効果的な取引戦略の構築に役立ちます。
2. 波の谷と波の頂の特定
株価は直線的に動くのではなく、波を描きながら上昇や下落を繰り返します。このインジケーターは、まず波の谷と波の頂を特定するところから始まります。
波の谷: 一時的な下落の最安値
波の頂: 一時的な上昇の最高値
これらを Pine Script の内蔵関数(ピボットローとピボットハイ)を用いて自動的に特定しています。
3. 波形の描画方法
特定した波の谷と波の頂を交互に結んで波形を描画します。ただし、波の谷や頂が連続する場合があります。
波の谷が連続する場合: より低い谷を採用して波形を描く
波の頂が連続する場合: より高い頂を採用して波形を描く
4. 押し安値・戻り高値の追跡とトレンド判断
押し安値と戻り高値は、波の進行状況を示す重要な指標です。
押し安値: 終値が前回の高値を超えた際の波の谷
戻り高値: 終値が前回の安値を割り込んだ際の波の頂
波の進行に伴う押し安値・戻り高値の変化から、トレンドの状態を判断します。
5. トレンド状態の具体例
上昇トレンド中:
波の頂を株価が上抜け押し安値が更新され続けることで上昇トレンドを継続。
上昇トレンドの終了:
株価が押し安値を割ると、押し安値が消え、戻り高値が新たに出現して、上昇トレンドを終了。
横ばい状態:
押し安値と戻り高値が交互に切り替わる。
下降トレンドの開始:
波の谷を株価が下抜け戻り高値がはじめて更新されることで下降トレンド開始を確認。
下降トレンド中:
波の谷を株価が下抜け戻り高値が更新され続けることで下降トレンドを継続。
下降トレンドの終了:
株価が波の頂を超えると、戻り高値が消え、押し安値が再び出現して、下降トレンドを終了。
横ばい状態:
押し安値と戻り高値が交互に切り替わる。
上昇トレンドの再開:
押し安値が更新されることで上昇トレンドを確認。
波の頂を株価が上抜け押し安値がはじめて更新されることで上昇トレンド開始を確認。
6. 応用例
トレードのエントリーとエグジット:
トレンド発生の価格に逆指値を設定してエントリー。
トレンド終了の価格に逆指値を設定してエグジット。
トレンドフィルターとして活用:
エントリーに適したトレンド状況かを確認。波形を分析してトレード戦略の参考に。
トレンドラインを描く時の参考として活用:
波の谷と頂を描画ツールを使ってトレンドラインを描く時の起点や終点として活用。
7. パラメーターと表示項目
ピボット: 波の谷はローソク足の安値にサークルを表示、波の頂はローソク足の高値にサークルを表示。
ピボット計算用のバーの数: 高値を特定するために左右何本のローソク足を使用するかを設定(初期値: 2)。
波形: 色(初期値: 青)や表示(初期値: 表示)の指定。
押し安値・戻り高値: 大きなサークルで表示。チャートの一番右の大きなサークルが現在のもの。過去のものも状態変化の経緯を示すために表示。色(初期値: 緑)や表示(初期値: 表示)の指定。

RR SummaThis is my favourite Indicator
Support and resistance are fundamental concepts in technical analysis used by traders to predict potential price movements in financial markets such as stocks, forex, and cryptocurrencies.
### 1. **Support**
Support refers to a price level at which an asset tends to find buying interest, preventing the price from falling further. It acts as a "floor" where demand is strong enough to halt the downward movement and potentially reverse it. When the price approaches support, buyers may step in, believing the asset is undervalued.
- **Characteristics of Support:**
- **Previous lows:** Historical price points where the price has repeatedly bounced upward.
- **Increased buying pressure:** When prices approach the support level, traders tend to buy, believing it's a good entry point.
- **Psychological factor:** Traders view support levels as a point where the price is unlikely to fall below for a while.
- **Example:** A stock may be trading at $50, and whenever it drops near that price, buyers step in and push it back up. In this case, $50 is the support level.
### 2. **Resistance**
Resistance is the opposite of support. It is a price level at which an asset faces selling pressure, preventing the price from rising further. It acts as a "ceiling," where supply exceeds demand, often leading to a reversal or consolidation.
- **Characteristics of Resistance:**
- **Previous highs:** Historical price points where the price has struggled to break through or where it has reversed downward.
- **Increased selling pressure:** Sellers are more likely to take profits or short the asset near resistance levels.
- **Psychological factor:** Traders may perceive resistance levels as a point where the asset is overvalued or where the trend will reverse.
- **Example:** A stock may approach a price of $100, but every time it gets close, sellers appear and push the price back down. In this case, $100 is the resistance level.
### **Key Points about Support and Resistance**
- **Breakout and Breakdown:** If a price moves beyond a support or resistance level, it is considered a breakout (above resistance) or breakdown (below support). This may signal a new trend in the market.
- **Role Reversal:** Once a resistance level is broken, it can turn into a support level, and vice versa. Traders often look for such shifts in market behavior.
- **Trend Continuation or Reversal:** Support and resistance can indicate whether the market is in a trend or preparing for a reversal. A test of support or resistance can lead to a continuation if the level holds, or a reversal if the level is breached.
### **Identifying Support and Resistance**
- **Historical Price Action:** Look for points where the price has reversed or consolidated multiple times.
- **Trendlines:** Draw trendlines that connect swing highs (resistance) and swing lows (support) to identify these levels.
- **Moving Averages:** Key moving averages (e.g., 50-day, 200-day) can act as dynamic support and resistance levels.
### **Why Support and Resistance Matter**
- **Risk Management:** Traders use these levels to place stop-loss orders to manage risk.
- **Entry and Exit Points:** These levels can help traders decide when to enter or exit trades, aiming to buy near support and sell near resistance.
- **Market Sentiment:** Support and resistance levels reflect the collective psychology of market participants, indicating areas where sentiment may shift.
In summary, support and resistance are essential tools for traders to identify potential price points where assets may reverse or consolidate. Understanding these levels allows traders to make more informed decisions about when to buy, sell, or stay on the sidelines.

Support & Resistance AI (K means/median) [ThinkLogicAI]█ OVERVIEW
K-means is a clustering algorithm commonly used in machine learning to group data points into distinct clusters based on their similarities. While K-means is not typically used directly for identifying support and resistance levels in financial markets, it can serve as a tool in a broader analysis approach.
Support and resistance levels are price levels in financial markets where the price tends to react or reverse. Support is a level where the price tends to stop falling and might start to rise, while resistance is a level where the price tends to stop rising and might start to fall. Traders and analysts often look for these levels as they can provide insights into potential price movements and trading opportunities.
█ BACKGROUND
The K-means algorithm has been around since the late 1950s, making it more than six decades old. The algorithm was introduced by Stuart Lloyd in his 1957 research paper "Least squares quantization in PCM" for telecommunications applications. However, it wasn't widely known or recognized until James MacQueen's 1967 paper "Some Methods for Classification and Analysis of Multivariate Observations," where he formalized the algorithm and referred to it as the "K-means" clustering method.
So, while K-means has been around for a considerable amount of time, it continues to be a widely used and influential algorithm in the fields of machine learning, data analysis, and pattern recognition due to its simplicity and effectiveness in clustering tasks.
█ COMPARE AND CONTRAST SUPPORT AND RESISTANCE METHODS
1) K-means Approach:
Cluster Formation: After applying the K-means algorithm to historical price change data and visualizing the resulting clusters, traders can identify distinct regions on the price chart where clusters are formed. Each cluster represents a group of similar price change patterns.
Cluster Analysis: Analyze the clusters to identify areas where clusters tend to form. These areas might correspond to regions of price behavior that repeat over time and could be indicative of support and resistance levels.
Potential Support and Resistance Levels: Based on the identified areas of cluster formation, traders can consider these regions as potential support and resistance levels. A cluster forming at a specific price level could suggest that this level has been historically significant, causing similar price behavior in the past.
Cluster Standard Deviation: In addition to looking at the means (centroids) of the clusters, traders can also calculate the standard deviation of price changes within each cluster. Standard deviation is a measure of the dispersion or volatility of data points around the mean. A higher standard deviation indicates greater price volatility within a cluster.
Low Standard Deviation: If a cluster has a low standard deviation, it suggests that prices within that cluster are relatively stable and less likely to exhibit sudden and large price movements. Traders might consider placing tighter stop-loss orders for trades within these clusters.
High Standard Deviation: Conversely, if a cluster has a high standard deviation, it indicates greater price volatility within that cluster. Traders might opt for wider stop-loss orders to allow for potential price fluctuations without getting stopped out prematurely.
Cluster Density: Each data point is assigned to a cluster so a cluster that is more dense will act more like gravity and
2) Traditional Approach:
Trendlines: Draw trendlines connecting significant highs or lows on a price chart to identify potential support and resistance levels.
Chart Patterns: Identify chart patterns like double tops, double bottoms, head and shoulders, and triangles that often indicate potential reversal points.
Moving Averages: Use moving averages to identify levels where the price might find support or resistance based on the average price over a specific period.
Psychological Levels: Identify round numbers or levels that traders often pay attention to, which can act as support and resistance.
Previous Highs and Lows: Identify significant previous price highs and lows that might act as support or resistance.
The key difference lies in the approach and the foundation of these methods. Traditional methods are based on well-established principles of technical analysis and market psychology, while the K-means approach involves clustering price behavior without necessarily incorporating market sentiment or specific price patterns.
It's important to note that while the K-means approach might provide an interesting way to analyze price data, it should be used cautiously and in conjunction with other traditional methods. Financial markets are influenced by a wide range of factors beyond just price behavior, and the effectiveness of any method for identifying support and resistance levels should be thoroughly tested and validated. Additionally, developments in trading strategies and analysis techniques could have occurred since my last update.
█ K MEANS ALGORITHM
The algorithm for K means is as follows:
Initialize cluster centers
assign data to clusters based on minimum distance
calculate cluster center by taking the average or median of the clusters
repeat steps 1-3 until cluster centers stop moving
█ LIMITATIONS OF K MEANS
There are 3 main limitations of this algorithm:
Sensitive to Initializations: K-means is sensitive to the initial placement of centroids. Different initializations can lead to different cluster assignments and final results.
Assumption of Equal Sizes and Variances: K-means assumes that clusters have roughly equal sizes and spherical shapes. This may not hold true for all types of data. It can struggle with identifying clusters with uneven densities, sizes, or shapes.
Impact of Outliers: K-means is sensitive to outliers, as a single outlier can significantly affect the position of cluster centroids. Outliers can lead to the creation of spurious clusters or distortion of the true cluster structure.
█ LIMITATIONS IN APPLICATION OF K MEANS IN TRADING
Trading data often exhibits characteristics that can pose challenges when applying indicators and analysis techniques. Here's how the limitations of outliers, varying scales, and unequal variance can impact the use of indicators in trading:
Outliers are data points that significantly deviate from the rest of the dataset. In trading, outliers can represent extreme price movements caused by rare events, news, or market anomalies. Outliers can have a significant impact on trading indicators and analyses:
Indicator Distortion: Outliers can skew the calculations of indicators, leading to misleading signals. For instance, a single extreme price spike could cause indicators like moving averages or RSI (Relative Strength Index) to give false signals.
Risk Management: Outliers can lead to overly aggressive trading decisions if not properly accounted for. Ignoring outliers might result in unexpected losses or missed opportunities to adjust trading strategies.
Different Scales: Trading data often includes multiple indicators with varying units and scales. For example, prices are typically in dollars, volume in units traded, and oscillators have their own scale. Mixing indicators with different scales can complicate analysis:
Normalization: Indicators on different scales need to be normalized or standardized to ensure they contribute equally to the analysis. Failure to do so can lead to one indicator dominating the analysis due to its larger magnitude.
Comparability: Without normalization, it's challenging to directly compare the significance of indicators. Some indicators might have a larger numerical range and could overshadow others.
Unequal Variance: Unequal variance in trading data refers to the fact that some indicators might exhibit higher volatility than others. This can impact the interpretation of signals and the performance of trading strategies:
Volatility Adjustment: When combining indicators with varying volatility, it's essential to adjust for their relative volatilities. Failure to do so might lead to overemphasizing or underestimating the importance of certain indicators in the trading strategy.
Risk Assessment: Unequal variance can impact risk assessment. Indicators with higher volatility might lead to riskier trading decisions if not properly taken into account.
█ APPLICATION OF THIS INDICATOR
This indicator can be used in 2 ways:
1) Make a directional trade:
If a trader thinks price will go higher or lower and price is within a cluster zone, The trader can take a position and place a stop on the 1 sd band around the cluster. As one can see below, the trader can go long the green arrow and place a stop on the one standard deviation mark for that cluster below it at the red arrow. using this we can calculate a risk to reward ratio.
Calculating risk to reward: targeting a risk reward ratio of 2:1, the trader could clearly make that given that the next resistance area above that in the orange cluster exceeds this risk reward ratio.
2) Take a reversal Trade:
We can use cluster centers (support and resistance levels) to go in the opposite direction that price is currently moving in hopes of price forming a pivot and reversing off this level.
Similar to the directional trade, we can use the standard deviation of the cluster to place a stop just in case we are wrong.
In this example below we can see that shorting on the red arrow and placing a stop at the one standard deviation above this cluster would give us a profitable trade with minimal risk.
Using the cluster density table in the upper right informs the trader just how dense the cluster is. Higher density clusters will give a higher likelihood of a pivot forming at these levels and price being rejected and switching direction with a larger move.
█ FEATURES & SETTINGS
General Settings:
Number of clusters: The user can select from 3 to five clusters. A good rule of thumb is that if you are trading intraday, less is more (Think 3 rather than 5). For daily 4 to 5 clusters is good.
Cluster Method: To get around the outlier limitation of k means clustering, The median was added. This gives the user the ability to choose either k means or k median clustering. K means is the preferred method if the user things there are no large outliers, and if there appears to be large outliers or it is assumed there are then K medians is preferred.
Bars back To train on: This will be the amount of bars to include in the clustering. This number is important so that the user includes bars that are recent but not so far back that they are out of the scope of where price can be. For example the last 2 years we have been in a range on the sp500 so 505 days in this setting would be more relevant than say looking back 5 years ago because price would have to move far to get there.
Show SD Bands: Select this to show the 1 standard deviation bands around the support and resistance level or unselect this to just show the support and resistance level by itself.
Features:
Besides the support and resistance levels and standard deviation bands, this indicator gives a table in the upper right hand corner to show the density of each cluster (support and resistance level) and is color coded to the cluster line on the chart. Higher density clusters mean price has been there previously more than lower density clusters and could mean a higher likelihood of a reversal when price reaches these areas.
█ WORKS CITED
Victor Sim, "Using K-means Clustering to Create Support and Resistance", 2020, towardsdatascience.com
Chris Piech, "K means", stanford.edu
█ ACKNOLWEDGMENTS
@jdehorty- Thanks for the publish template. It made organizing my thoughts and work alot easier.
