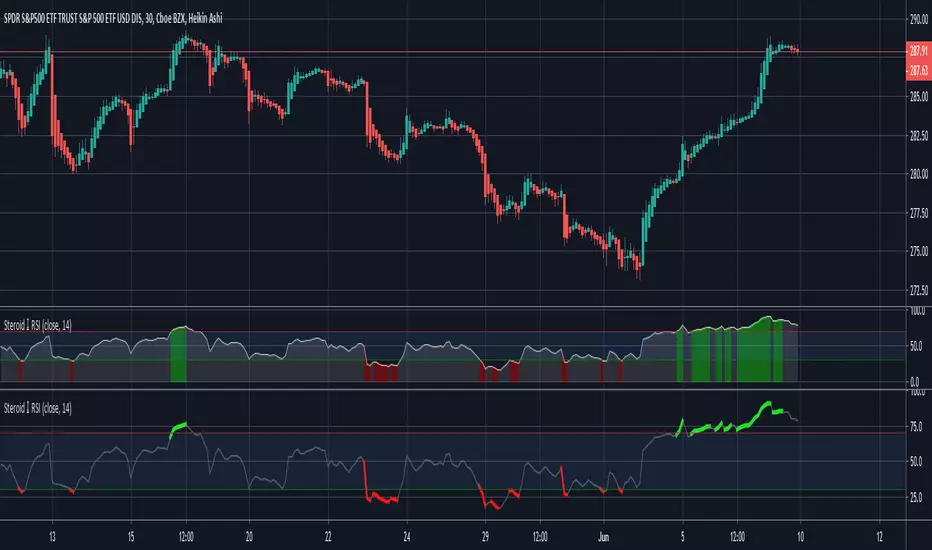
Steroid RSI w/ Overbought & Oversold Alert/@version=2
//By Tantamount
//RSI with overbought and oversold alert features! Highly configurable indicator that includes a Topography map feature, used to detect & easily show threshold crossovers.
//RSI is used to measure the velocity and change of directional price movements. It is very useful to help determine when an asset is reaching an overbought or oversold condition.
//This RSI tool comes loaded with features and is easily configurable back to standard RSI or configure with your own preferences.
Customize to your liking:
Topo map view or standard with highlighted crossover color.
If you like this tool and would like to DONATE/TIP:
Stellar XLM address: GA5XIGA5C7QTPTWXQHY6MCJRMTRZDOSHR6EFIBNDQTCQHG262N4GGKTM
Bitcoin BTC address: 3QwPUnZvAKBXBMU7WMckNgDyfv6PApYduA
Search in scripts for "alert"
420_MA_3 (3 moving average + custom ma + alerts) Three Moving Average System with Alerts
Saw a friend post a 3 ma script recently and I don't think it had this much functionality.
much love
gl hf
xoxo
snoop

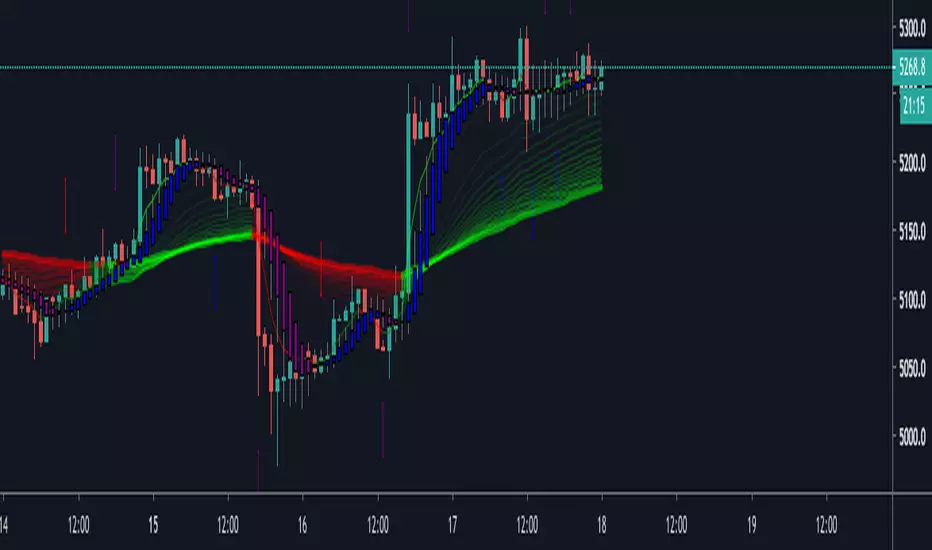
SHA & MMAR Strategy Alert IndicatorIndicator w/ alerts for 'Slow-Heiken Ashi & Madrid Moving Average Strategy'.
High win-percentage with cryptocurrencies on a 1H timechart.
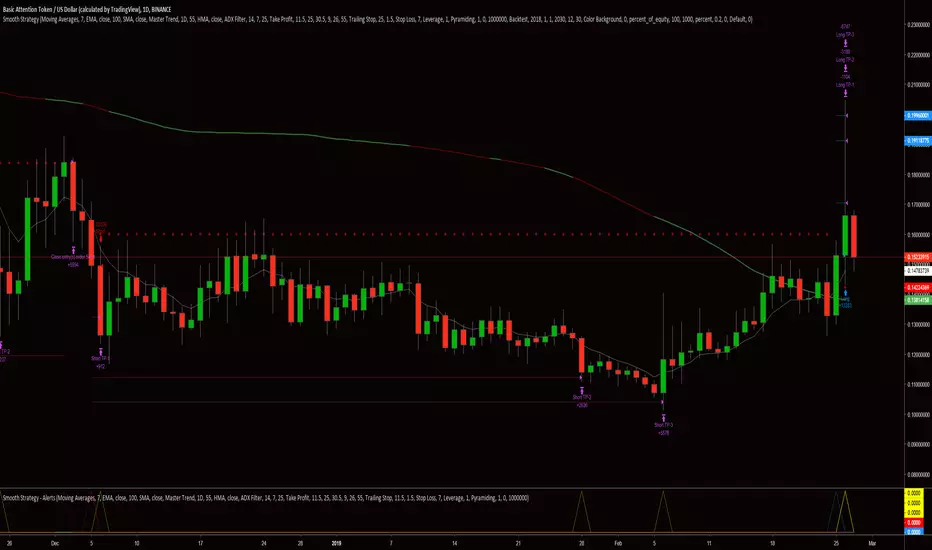
Smooth Strategy - AlertsThis is an alert script that accompanies "Smooth Strategy." This script was written to be used with AutoView, but can likely be used for similar services as well. Be sure that all settings match exactly with the settings used in "Smooth Strategy."
***HOW TO SET ALERTS***
Long Entry - "Once Per Bar Close"
Short Entry - "Once Per Bar Close"
All TP Levels - "Only Once"
Long Close - "Once Per Bar Close"
Short Close - "Once Per Bar Close"
ck - Inner Bars Indicator with Alerts and Trailing Stop v1*** Please check out the matching Strategy to accompany this Indicator to allow you to fully backtest! ***
Inner Bar trading strategy is where the "inside" bar (or candle to the right) within a pair is smaller and within the high to low range of the prior bar, as this pattern tends to be somewhat predictable; especially in "chop" or sideways trading, it is useful to have in your tool box.
Features include:
Complimentary strategy you can add as well as the indicator to backtest and tune your settings before live trading
Trailing Stoploss to wring every cent from a trade
Clear Alert labels have been coded in for use with trading bots, 3commas is recommended.
Enable/Disable Shorts in addition to Longs
Visual chart shapes - Pink Triangle = Long, Purple Triangle = Short, Thin Green Arrow = Profit, Thin Red Arrow = Loss
Realtime Deal Status - Plotlines include Yellow = Entry Price, Green = Trailing Stop Profit, Red - Hard Stoploss
A further feature is that you can disable Shorts (therefore only Longing) for use with exchanges
that only allow you to Long, such as Binance & Coinbase.
Additionally, this Indicator will close a trade before opening the next, so a single exchange
account (BitMEX for example) is all that is required versus having separate accounts to long or
short on the same chart.
This strategy is intended to use $100 of capital, traded at 2.5% per order with 10x lev on Bitmex.
If you like my work, please use my referral links (you will receive discounts!)
3commas trading bots (now with Bitmex support and a lot more!) - 3commas.io
BitMEX - www.bitmex.com
If you have any comments or suggestions, please message me via TradingView.
Based on the core "Inner Bars" concept found at:
backtest-rookies.com
with original inspiration/idea from babypips.com

inwCoin Price Diff AlertJust simple alert script to compare candle with current candle for price change with leverage.

Bones1390's GANN Strategy AlertsThese are the alerts to go along with my GANN Strategy. You can find the strategy here:
If you like my stuff, leave me a comment below.
If you're feeling kind or want to show some appreciation, you can donate Bitcoin to this Address here:
3Jp9Kow1VxvzAiLLwCdeeQ2g11wKyaT4rC
Also if there's anything you want to talk about PM me! I'm free to speak about anything. Want a custom indicator? I can do my best to code it for you!
Thanks!
Bones

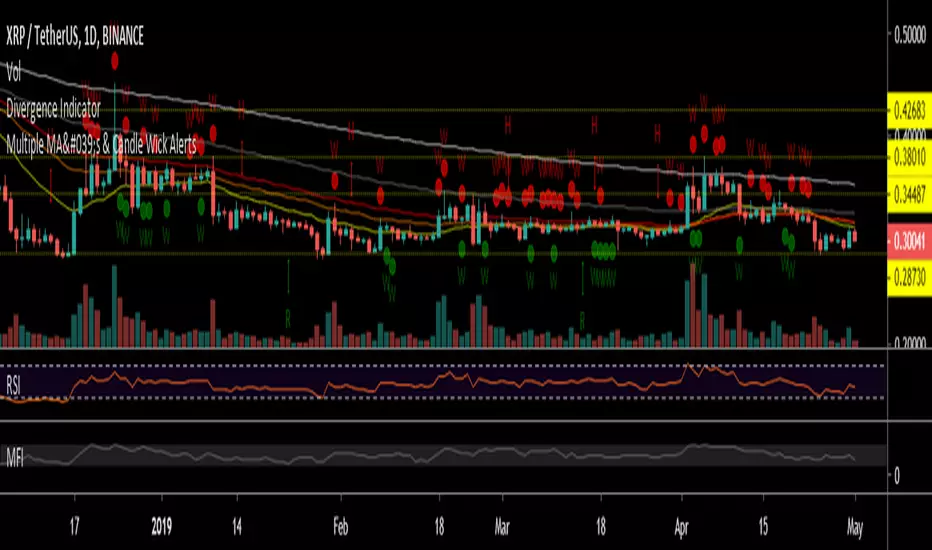
Multiple MA's & Candle Wick AlertsUse this indicator/alerts when a wick touches one of the 5 EMA's (default 20,40,55,100,200 EMA, or you can set other MA types and lengths).
Adjusted by Me for 20,40,55,100,200 EMA, other colors for EMA lines and tiny dots)
Credits to user TradingView user: mgibson91 for base script.
Kozlod - Heikin-Ashi Bar Color Change AlertsYou can use this script to setup alerts on Heikin-Ashi bar color change.
You have to apply this script to usual candles and not Heikin-Ashi!!!
Background color indicates HA bar color. On change you'll see green/red arrows and alert will be fired.
Also you can find in the code calculations of all HA OHLC values.

MACD Cross AlertWhen MACD crosses Sinal line, arrows are displayed above or below the bar on main chart.
You can also set the following MACD alert with this indicator.
1. When MACD crosses the signal line upwards
2. When MACD crosses the signal line downward
3. When MACD crossed zero line upward
4. When MACD crosses zero line down
MACDのクロスが発生した事を表示します。MACDがシグナルラインを交差すると、ローソク足の上下に、矢印が表示されます。
またこのインジケーターでは以下のMACDのアラートを設定することができます。
1. MACDがシグナルラインを上に交差した時
2. MACDがシグナルラインを下に交差した時
3. MACDがゼロラインを上に交差した時
4. MACDがゼロラインを下に交差した時

08-2018 Stochastic 5m [ALERT SETUP] [INDICATOR]This is an accumulation of small buy orders and a complete sell order strategy, that can be used for manual trading or for a trading bot. The strategy is based on stockastic divergences ( an indicator that I made myself and is published on my profile earlier ), and I added my personnal touch of course. Note that the bullish and bearish stochastic divergences are calculated separately and can be configured in the inputs.
To be used with a 5m timeframe, and on a flat or bullish pair.
Everyone can favorite the script, apply it to the chart, but only I can see or modify the code. If you need anything, leave a comment, thanks :D
More info about the script, such as inputs description, how to configure the script, strategy explanation, alert configuration can be found here : blockchainfiesta.com
--------------------------------------------------------------------------------------------------------------
I do commission work: TradingView Pine Script development & Reverse Engineering.
contact@blockchainfiesta.com.
You can also send me a message in TradingView or Discord (discord.gg)
Bitcoin address: 19sVQvCDmVfEACq7BiMnWSMqFPZ8qfSQ2K
ETH address: 0xc8a5d3a63a05db0c2363ea1c08b37a01cce9ebfb

Market Sniper Signal MTF [ALERTS]Script with alert condition to use with Market Sniper Strategy.
Can be used to trade manually or automatically using API/AutoView Extension.
Market Sniper is a multi-timeframe strategy based on trend analysis created to operate on leverage market.
Code is still in beta-testing, please leave a comment if you want a free trial when final release will be available.

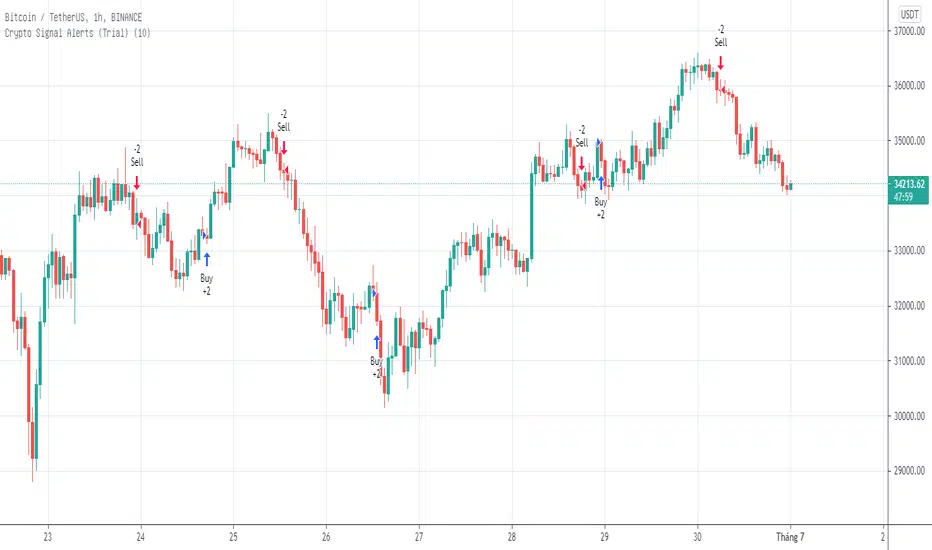
Crypto Signal Alerts ( Trial )- Features:
+ Optimized trading methods for multiple time frames 5M 15M 1H 4H (including Margin and Exchange Trading).
+ Build the rule of Stoploss / Takeprofit according to the risk management method according to the trader's strategy.
+ Real-time push alert system + Email + Popup on your desktop, laptop, tablet and smartphone => have time to enjoy trading live.
+ Our system runs 24/7.
*** Sign up for a 3-day trial here : goo.gl
VWAP AlertsVWAP Alerts for intraday VWAP bounces and VWAP deviation mean reversions. I am currently finalizing the alert section make it more streamlined.
Thanks to @TheYangGuizi for an amazing script


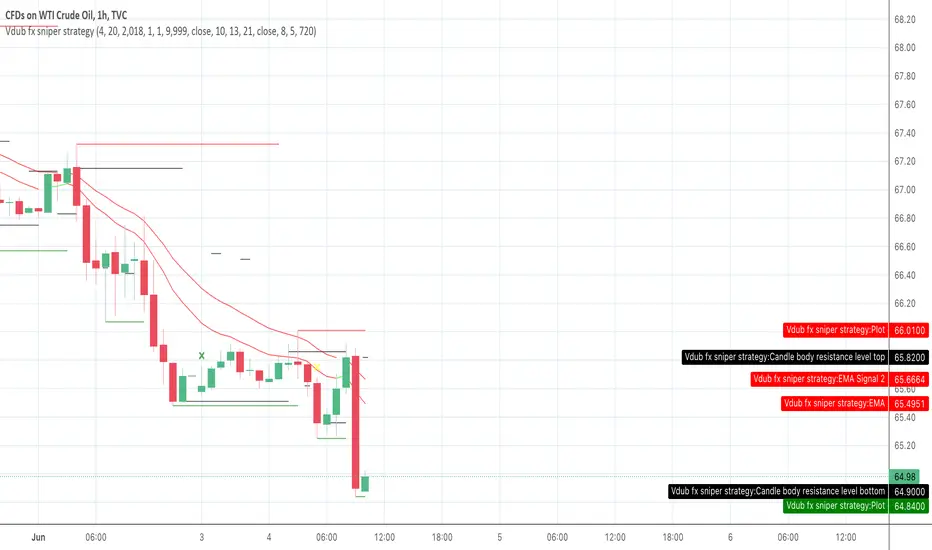
Vdub fx sniper strategy with alertsThis mimics the performance of the strategy created by Vdub FX Sniper, the user should buy when it marks green and sell when it marks yellow, however i can't get to the alert system trigger effectively, any ideas?
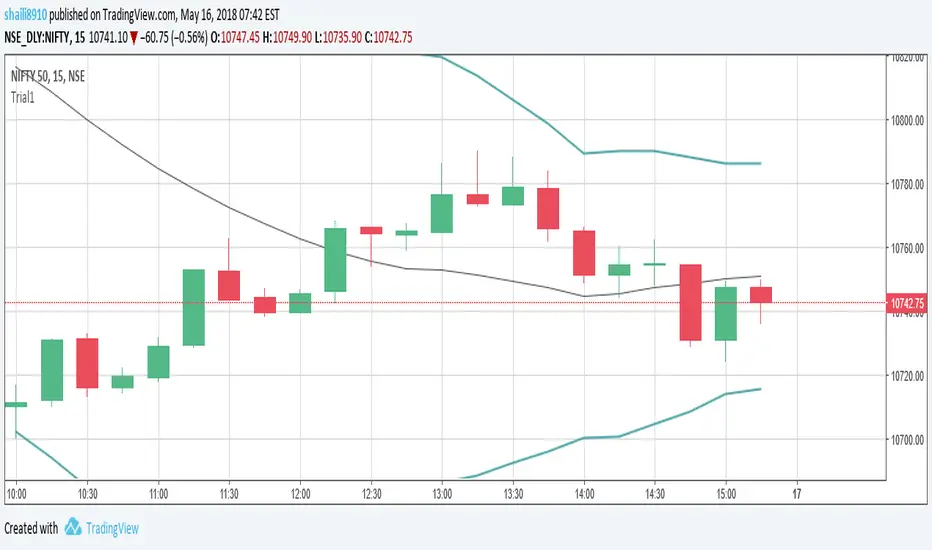
Bollinger Band Open Gap Alert V1This is the bare bones of what I'm trying to achieve through pine script. The purpose of the script is to:
1. On a 15m chart, calculate and plot upper & lower Bollinger bands and simple moving average of 20 periods. (DONE)
2. On a new day, when the first 15m candle of a session forms, I want to check if a) the low of the new candle is outside the upper Bollinger band (also known as an open gap up) or b) if the high of the candle is the outside the lower Bollinger band (also known as open gap down). In other words, I want to know if the Bollinger Bands are not touching the new candle's wicks/shadows. (DONE)
3. Alert me if the above happens. (DONE)
4. Run the indicator through an entire watch list. I'm not sure if that's possible, yet. (HELP)
For the above job, this is what I could come up with. I need guidance for the last step . And any suggestions for corrections or improvements would be greatly appreciated!

Bollinger Bands %b & RSI & Stochastic Smoothed Indicator & AlertThis indicator displays RSI, a normalized Bollinger Band &b (Usual 0 -1 range of BB normalized to the OBOS range of RSI), and a normalized smoothed Stochastic (again, normalized to the OBOS of RSI) simultaneously with a single indicator.
It also displays buy and sell signals based upon the above.
The stochastic can be turned on and off, and the sell signal calculation will be changed accordingly (Stochastic not used to calculate buy signal).
All periods, OBOS levels, deviation, etc, are user adjustable. The buy and sell arrows can be optionally turned off.
The indicator supports alerts for the buy and sell signals.
This is a considerably rewritten, cleaned up, and updated version of my BB %b & RSI Indicator and Alert with many more features, and including a stochastic.
This indicator is mainly for use with Cryptocurrencies in shorter time periods to display possible trade opportunities. Can also be used with Forex.

Trend-following Microprofit w/ Smart DCA + Profit Plot + AlertsThis alert script is oriented towards automated trading with Gunbot.
I call it "Options Galore" because of all the user-configurable settings it offers for up-trending and down-trending markets. (See: " Market Tone " study).
A strategy script for quantitative backtesting, smarter buy/sell indicator such as TSI or Stoch RSI, and stop loss/trailing stop are all in the pipeline. Please share any other suggestions in the comments!
Features:
Set backtesting range, or start forward testing from the current time. Historical Renko charts can lead to repainting, which is avoided by keeping the chart open in your browser and running with real time data.
Average protection: only buy if price drops by a certain % below your average price -- can be automatically toggled by market trender if we want to continue buying during an uptrend. This reduces net profit but increases gross profit.
Gain protection: only sell if price is a certain % above your average price -- can be automatically toggled by market trender. Wait for larger profits in an uptrend, but sell earlier in a down trend.
Minimum percent gain can also be set to a negative value to allow selling at a loss. This is not true stop loss behavior, we still need a sell signal from the indicator. This means we will try to get the best price above your price floor, but in some rare situations we may not sell before the price drops below your price floor.
Position plotter: plots average long position price relative to current price.
Plot loss level: plots average price - loss %. With pyramiding turned off, this can be used to find out where to set your stop loss.
This script is free to use, just comment or PM for access. It is mainly meant to showcase some new features, and is only safe to use in carefully selected markets such as USDT-BTC.
Stay posted for upcoming scripts with smarter signaling and additional features! If you would like to add these features to your own preferred strategy, please PM me.

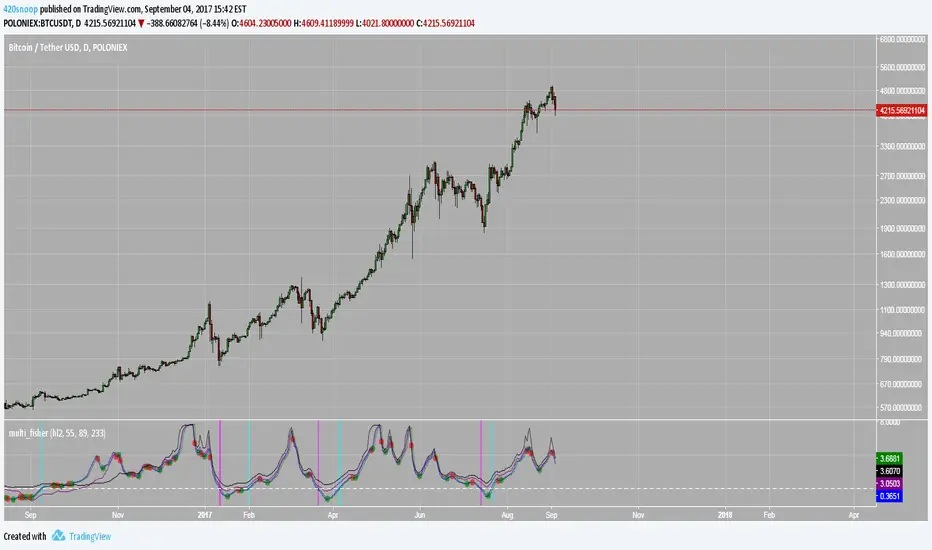
Multi Fisher Transform + AlertBased on 3 Fisher transforms -- this script look for confluence on crosses of 0
this is alert enabled; make sure to use 'once per bar on close'
hope it helps
xoxo
--sn00p
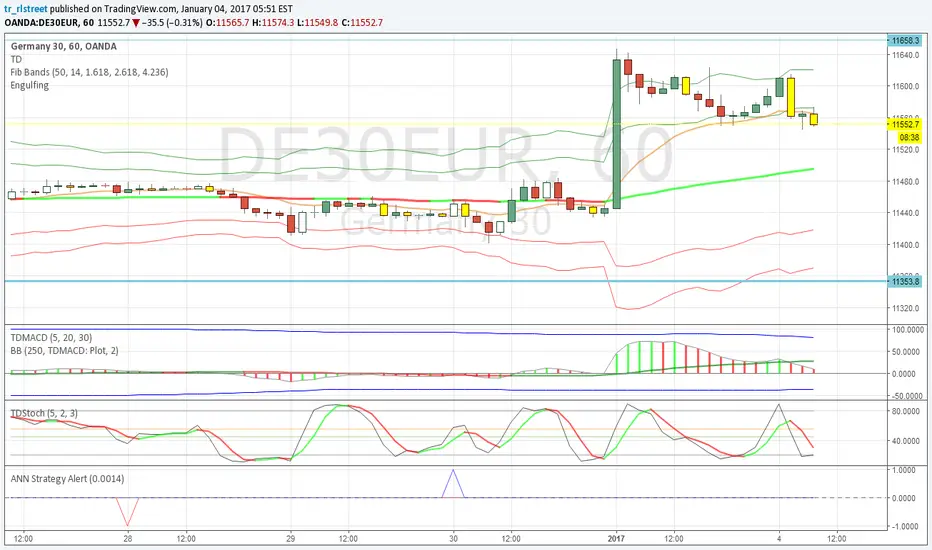
ANN Strategy AlertBased on ANN Strategy by Sirlof2009.
Changed it from strategy to indicator and made appearance less noisy
I use it just for creating alerts (predictionS<0 => Short and predictionL >0 => Long)
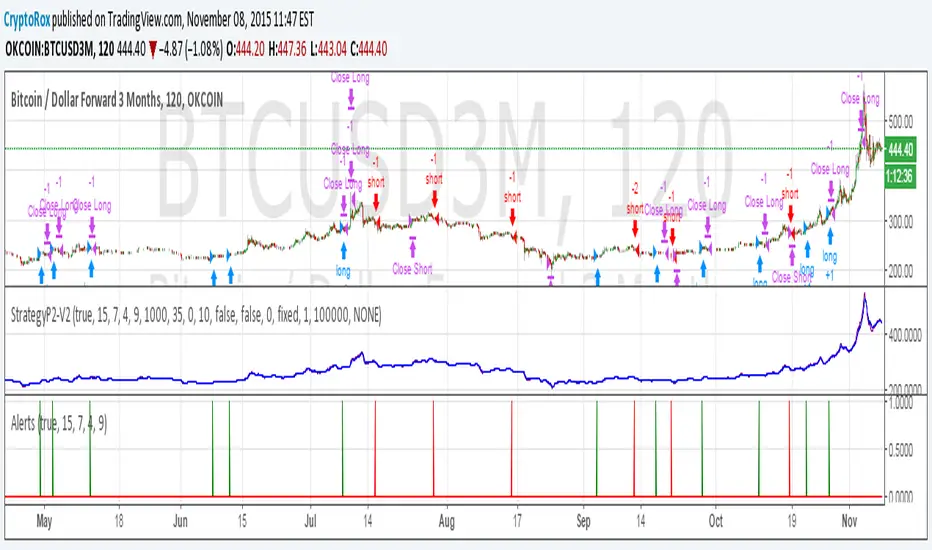
P2-V2 - AlertsThis is the alert script for the P2-V2 Strategy. For some reason pasting it into the P2-V2 description results in some of the lines becoming corrupt. So figured the best way would be to publish it.
original strategy