DekaBot V5.1 AlertsDekabot is a BTCUSDT trading signals indicator. The buy/sell alerts are not re-painted so the results displayed will not change when Tradingview is reloaded.
Dekabot Alerts uses a combination of Bollinger Bands , MAs and RSI to determine if the market is in an uptrend or downtrend and a custom built indicator determines when a market is oversold and overbought which creates the buy and sell signals.
Please PM us to obtain access to use Dekabot Alerts.
Search in scripts for "alert"

[BMAX] Moving Average Cross Alert(ENGLISH)
This indicator helps user to create an alert to monitor when a bar closes crossing a moving average, upwards or downwards.
(PORTUGUÊS)
Este indicador ajuda o usuário a criar alertas para monitorar quando um candle fecha em cruzamento com uma média móvel, acima ou abaixo.

ATR Auto Oscillator [DepthHouse]The ATR Auto Oscillator uses advanced range calculations to determine a dynamic range that the applied market moves within. Like an RSI , the ATR Auto Oscillator measures the speed and change of price movements through a given range. Unlike an RSI , the ATR Auto Oscillator automatically re-configures range values dependent on the user set lookback.
The oscillator ranges between (0.1) and 1.1. Generally, the market is oversold while the bands are below 0.2 and is overbought while above 0.8.
The two bands displayed are used to determine short term trend directions and the oversold/undersold state of the applied market. Crossovers of these bands could give a hint to the direction the market is moving.
The fast band (green) is the direct value of where the market is within its calculated range; 1.1 representing the top of range, and -0.1 representing the bottom. Even when this value is near the bottom of the top of the range, the auto oscillator will readjust to create a new range that the market travels within.
The slow band (red) is a lagging version of the fast band which is used to determine the oversold/overbought signals. When this band travels within the oversold and overbought regions the background color will change to signal a warning. If the fast band crosses the slow band within these zones, an opaque signal will appear. These signals are used to catch possible trend reversals.
Breakout Signals ( BETA ):
Breakout signals are the up and down arrows displayed on the top and bottom of the oscillator. A refined range is generated by the user set 'High Low Length'; it is then displayed by the light gray horizontal lines. If the user set band (fast or slow) returns into the range within a given period (breakout offset) then a signal will generate.
Built in Alerts (must be set up by user):
Bullish & Bearish Crossovers within the oversold and overbought ranges.
Bullish & Bearish Breakout alerts (beta)
Users can also set custom alerts. Example: Fast Band crossing up Value: 0.7
To gain access to this indicator please follow the link below.
Feel free to message me with any questions directly here on TradingView.

BigBendFX Ichimoku Cloud | Cloud BreakoutCloud breakout is an enhancement of TradingView's built-in Ichimoku Cloud Indicator. By default, only the cloud is visible. The other Ichimoku lines can be toggled on if needed. This indicator focuses on the breakout of the Kumo cloud. An additional simple moving average filter can be added as well.
Breakout Condition
2 candlesticks are part of the breakout condition
Candlestick 1: 'open' price is still within the cloud and 'close' price breaks out of the cloud
Candlestick 2: 'open' price confirms that candlestick 1 'close' remains as a breakout
There are 4 possible breakout conditions: 2 bullish direction moves crossing each senkou span and 2 bearish direction moves crossing each senkou span
Note: ranging markets will cause false breakouts, so a moving average is integrated to help filter this out
Moving Average Integration
A simple moving average can easily be toggled on/off to filter out cloud breakout signals
The SMA length and color can be adjusted in the settings
Alerts
There are 2 alert options: bullish or bearish
Alerts will confirm if the Moving Average Integration is activated
To add to your chart simply search for the title "BigBendFX Ichimoku Cloud" in indicators & strategies.
If you would like any added features or functionalities, please comment/share below. Be sure to check out our website (link below)!
Thank you!

TDI Traders Dynamic Index Alerts v1 - BonavestTo add this indicator to your charts:
Click the 'Add to Favorite Scripts' button down below this description.
This indicator places BUY and SELL tags on the chart using the Trader's Dynamic Index Indicator created by Dan Malone. This indicator is RSI based and is best used with ranging markets and will tend to create a trail of false signals (colored tags) when price is at it's extremes for a long period of time. Utlizing some other indicator such as a volume based one will assist in optimizing signals.
I have used this indicator with success for a few years, however I do not plan to support users of this indicator. It is offered as-is.
I use this indicator for:
Counter Trend Trading (colored tags)
Detecting Best Entries to Follow Trend (gray tags)
Trading Extreme Overbought/Oversold Price Areas (bright colored tags)
Detecting RSI Divergences (circles)
SETTINGS
Custom Timeframe - Default current chart timeframe. Custom selection only works when selecting a smaller timeframe than what is on the chart.
Lengthrsi - RSI Period
Lengthband - TDI Band Length
Lengthrsipl - TDI Price Line Length
Lengthtradesl - TDI Signal Line Length
There are 5 Built-In Notifications already created for you and are available by simply right clicking in the indicator area and selecting:
Condition: TDI Alerts v1
Then 1 of the 5 Alerts:
BUY Signal - All Green colored tags
SELL Signal - All Red colored tags
Gray BUY signal - All Gray BUY tags
Gray SELL signal - All Gray SELL tags
All Signals - All colored and gray tags
This adaptation was based off of the original code from the talented LazyBear.

Fibonacci Retracement level with 10 preset cross alert.The Fibonacci retracement is also called the golden mean or golden section.
It has been used to analyze the proportions of natural objects as well as man-made systems such as financial markets.
The mathematics of the golden ratio and of the Fibonacci sequence is intimately interconnected. The Fibonacci sequence is:
1, 1, 2, 3, 5, 8, 13, 21, 34, 55, 89, 144, 233, 377, 610, 987, ....
The golden ratio is the limit of the ratios of successive terms of the Fibonacci sequence (or any Fibonacci-like sequence).
This Fibonacci retracement level indicator automatically plots 7 support and resistance levels on chart based on selected number of bars.
How it works?
It shows the Fibonacci retracement support and resistance levels for a given range and display the corresponding ratio on the right side of the levels. The price range and levels are adjustable by user, you can easily identify the major and minor support/resistance levels from the chart with your desired inputs.
Features and inputs:
Show Level Label, enable to display the level on chart.
Range, it's the number of bars used to detect the highest and lowest price. The default value is 300 it means the indicator will plot the Fibonacci retracement based on the price range of last 300 bars.
If you want to use different ratios other than the default ones, you can change them from input Level1 to Level5.
You can change the color of each level line from the following available colors: silver , gray, white, maroon, red, purple, fuchsia, green, lime, olive, yellow, navy, blue, teal, aqua, orange.
The highest and lowest level are auto detected and can't be changed.
Line style: you can choose from: Solid, Dotted and Dashed.
1 is Solid like this: ______________________
2 is Dashed - - - - - - - - - - - - - - - - - - -
3 is dotted ............................................
It works on all timeframes and Renko, Heikin Ashi, Bars, Candle and Line chart types.
There are also 10 pre-set alert conditions for you to choose.
For example, if you chose "Cross over Level 1", alert will be triggered when close price cross above level 1.
"Please Use the link below to obtain access to this indicator".

Sqeeze Momentum, DMI and Parabolic SAR study with alertsThe study combines Sqeeze Momentum, Directional Movement Index (DMI) and Parabolic SAR indicators indicators providing you with a powerful indicator with long and short scalping strategies in it
When conditions of long or short position from all mentioned indicators are met script opens position. Once trend changes it closes position and fixes profit
Advantages:
1. Deal start alert condition includes the folowing filters and requirements:
- Momentum value is adjusted using a relative proportion of volume at each timeframe scale to exclude a chance of opening position at a low impulse stage
- Squeeze momentum trigger condition is automatically checked before a position is opened
- +DI , -DI and ADX values are taken into account to confirm the trend direction
- Position size is taken into account to ensure there will not be opened any excess deals or alerts
2. Exit deal alert condition was modified using Parabolic SAR indicator. Hence, it is ensured positions will not be closed in a middle of a trend
3. Study allows you to apply custom alerts to any position you would like thus you can connect your own trading panels with TradingView Webhooks
If you want to obtain access to the strategy please send us a personal message

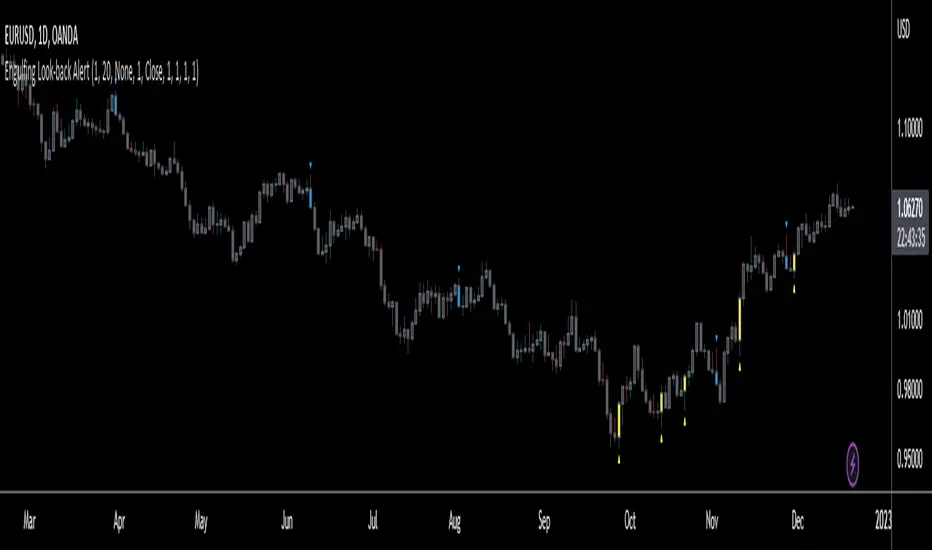
Engulfing Look-back AlertThis script is an extension of the classical engulf pattern with added rules and user defined features.
Engulfing Candle Definition:
- Bullish Engulfing: Trade BELOW the prior candle's LOW and CLOSE ABOVE the prior candle's HIGH. Previous candle can be an up (bullish) or a down (bearish) candle
- Bearish Engulfing: Trade ABOVE the prior candle’s HIGH and CLOSE BELOW the prior candle’s LOW. Previous candle can be an up (bullish) or a down (bearish) candle
Features:
- Set the look-back period for engulfing candle high and low -> default = 1; e.g. Did the bullish eng candle trade below the lows of the last 3 candles and trade above the highs of the last 4 candles? Set the input values accordingly
- Choose time frame(s) engulfing candle is to be displayed on -> default = M/W/D/4H/1H/15M
- Ability to enable Alerts (includes time frame alert was triggered on): IMPORTANT - when setting alerts ensure to choose "ONCE PER BAR"; otherwise alerts will NOT trigger as intended
prntscr.com
*FIBAUS BUY and SELL Trender V2 with AlertsFIBAUS BUY and SELL Trender v2 with ALERTS: Hit me up if you want access.
Always be on the right side of the trade and know where to place the stop loss.
Its a very consistent system allowing for a low risk, high gain trading stratergy. Simply wait for the signal to show as BUY or SELL (LONG or SHORT) and place the order.
SET YOUR ALERTS and WAIT!
Tight stops losses are placed above (Sell/shorts) and below (Buy/Long) orders.
Horizonatal plot lines are to be used as Targets and reversal zones. Green lines are support zones and red lines act as resistance zones.
The Lagging line is the 200 EMA which give me a view of the overall trend of the market and indicates if I should only take Buy or Sell orders. When the 200 is RED, I only sell/short. When it is GREEN, I only Buy/Long.
NB: In trading support and resistance zones interchange. This means that supports can become resistance and resistance can become support zones.
For BTC/XBT, I use 2 hour candles.
Forex, I use 1 hour and 3 hour candles.
For Options I use the 1 hour candles.
Stop Loss stays the same for all types (which is above or below the candle signaling buy or sell.
Hit me up if you want access.
Happy Trading !!
FIBAUS

Technical Analysis - Binary Option AlertA. Oscillators & B. Moving Averages base on TradingView's Technical Analysis by ThiagoSchmitz
C.Pivot base on Ultimate Pivot Points Alerts by elbartt
D. Summary & Alert by anhnguyen14
Binary Option Alert base on my indicator: Technical Analysis - Panel Info
Put alert = Srong Sell + close>open
Call alert = Strong buy + close

Hancock - Pump Catcher [BitMEX] [Alerts]This is a study to the version of the strategy found here .
It generates 3 alerts:
CLOSE - Triggers to close all open positions
LONG - Triggers to open a long position
SHORT - Triggers to open a short position
Commands for alerts (without stop-loss) to get you started:
CLOSE - a=bitmex e=bitmextestnet c=position t=market
LONG - a=bitmex e=bitmextestnet b=long s=xbtusd l=5 q=99% t=market
SHORT - a=bitmex e=bitmextestnet b=short s=xbtusd l=5 q=99% t=market
I would advise including a stop-loss with your commands. These commands are for autoview and don't include a stop loss, use autoview command documentation to add stop-loss.
Happy trading
Hancock

CYBER ENSEMBLE {PREVIEW}This is the PREVIEW version of CYBER ENSEMBLE
The subscription based PREMIUM version is found here:
Please PM me for access information.
Signals for the last 5 days are disabled.
Signal Alerts are disabled.
===============
CYBER ENSEMBLE is a sophisticated signalling script base on the interplay of an ensemble of optimized indicators and market state filters.
(>1000 lines of code)
Users are advised to manually back-test and optimize the settings for a particular chart and time frame, before proceeding with its use.
The algorithms will be periodically updated to further optimize and improve their performances, and new algorithms may be tested and added in the future.
Note: In no way is this intended as a financial/investment/trading advice. You are responsible for your own investment/trade decisions.

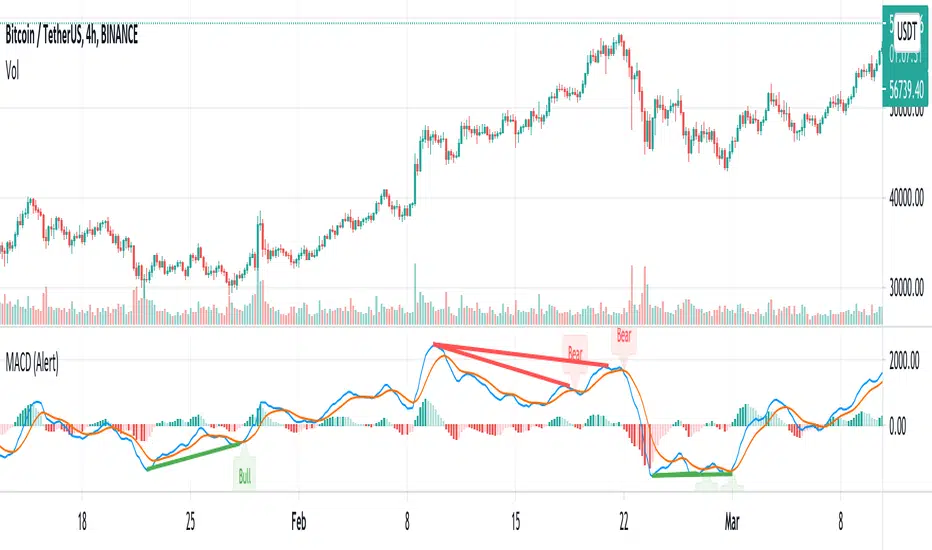
MACD w/ Divergences (Alert)To best use the MACD Divergence indicators, adjust the following settings accordingly.
• MACD Bullish Divergence Under: <0 (lower for larger volatility and more bearish markets)
• MACD Bearish Divergence Above: >0 (higher for larger volatility and more bullish markets)
Key Notes:
1. Set "Once Per Bar" instead of "Once Per Bar Close" alert.
The strategy already uses prior bar close (instead of current bar close) for calculation. This ensures that the signals will stay as they are after fired off, even when the current bar price is still changing.
2. It's OKAY to see the "alert may trigger differently than expected" warning.
Reason why you are seeing this warning is because we used a function called valuewhen() in our strategy. This function does not look at the entire history of data and has several limitations. For instance, on a 30min resolution, at the end of 2018, the function will be able to find past occurrences of BTC exceeding 16k. However, the function won't be able to find such occurrences at the end of 2019. Since our strategy is only concerned with very recent events, these limitations will not impact our results or cause repainting. You can find out more about this in the TradingView Wiki .
Trend Pulse Pro V2Trend Pulse Pro V2 (Non Repaint)
TradingView Account Needed: Free
You don't need to be an expert to use Trend Pulse Pro.
Just follow the signals and that's all and use simple Fibonacci levels to find stop loss and take profit!
You can increase the win rate even more by following some simple technical analysis, for example, when trend breaks (price break signal level) you can use that as support become resistance level (sell) or resistance becomes support (buy):
No complex things. No waste of time.
And although you won't win 100% of the trades (no signals can guarantee that), your trading will surely improve a lot!
Even someone with almost no trading experience can read the simple trading rules given in the included user guide, watch the how-to videos and follow Trend Pulse Pro’s signals to consistently make smarter trades.
With Trend Pulse Pro you will get accurate buy and sell signals every time there is a new trading opportunity so that you never miss any big price movements and makes your trading both easier and more profitable.
How to use the signals and alerts:
Trend Pulse Pro automatically analyze trend and price action to give you a signal when there's a good trade.
These trend signals and alerts are derived from live data but the stability of our code allows it to not repaint.
Trend Pulse Pro allow you to easily determine the trend and will give you buy and sell entry levels.
Works on all markets on all time frames so it's suitable for scalpers, day and swing traders.
If you want more details, the link is in the signature.
Disclaimer:
Past performance is not indicative of future performance. No representation is being made that any results discussed within the service and its related media content will be achieved. All opinions, news, research, analyses, prices or other information is provided as general market commentary and not as investment advice. TradingWalk, their members, shareholders, employees, agents, representatives and resellers do not warrant the completeness, accuracy or timeliness of the information supplied, and they shall not be liable for any loss or damages, consequential or otherwise, which may arise from the use or reliance of the TradingWalk service and its content. © 2019 TradingWalk.
TradingWalk indicators are built for TradingView. TradingWalk is on no way a part of TradingView.

*FIBAUS Ultimate Trender with AlertsVery easy to follow indicator. Its all about the trend. It works in any timeframe with any entity. Crypto, forex, commodities, and stocks. It can be used to scalp but I personally dont day trade anymore and use it for longterm trades. I normally use 6H to 1D candles.
The green ribbon and green arrows indicate a long/buy opportunity and the red ribbon with red arrows at the top of the page indicate a short/sell opportunity.
All you do is set the alerts based on your preferred timeframe and wait for the alert.
Blue spotted lines act as necklines, stop loss levels/ take profit levels.
You can see many areas where the red and green ribbons bounce or are rejected at the blue dotted line. This gives plenty of entry, re-entry, and exit opportunities.
Message me if you want a shot at it.
Happy Trading,
FIBAUS

TMA Indicator v2.2This indicator is designed to show support and resistance at local extremes. Configurable SMA crossover events can be used to impart a bullish or bearish bias. This helps to reduce noise on the chart and increase profit factor. In other words, the indicator will only look for bullish breakouts if the fast moving average is above the slow moving average and vice-versa.
SMA Crossover events can be used to filter bullish or bearish resistance levels.
SMA Crossover events can be used to filter bullish or bearish breakout alerts.
Supports alerts for entries and exits based on breakouts of local extrema.
Alerts can be generated at every breakout or with SMA crossover filtering active.
Backtests would suggest that filtering with SMA crossovers often yields slightly lower profit but with a considerable improvement to profit factor.
Green/Red indicates long/short entry
Yellow/Orange indicates long/short exit
See here for an example backtest and visualization of active SMA signal filtering:
For paper trading only. Do not use on real markets. Never make investment decisions based on this indicator alone.

PerPro V7+Alert per PAIRPerPro V7 in study mode with alerts on some pairs of FOREX.
Update:
- Alerts per pair
- Indicator mode(STUDY)
Alerts per PAIR
- Condition: PerPro V7+Alert // LONG // LONG
- Options: Once per bar close(recommend in lower timeframe)

MACD MTF Indicator with Alerting v2.1 [priceactionguru]The MACD MTF is a trend-following momentum indicator that works across multiple timeframes.
It can be used as low as 1 minute or as high as 1 month.
The user can select the multiple time frames they wish to alert on as well as whether to alert on the histogram or MACD Line.
If you are a trend-following trader, this indicator will assist you in always entering with the trend across multiple timeframes, thus ensuring you minimize the maximum adverse excursion in price movement against your entry.

Ichimoku 2 sets of settings, markers and alertsThis is my take on the masterful, beautiful and powerful Ichimoku.
It comes with:
- 2 sets of settings you can flip between,
- 5 types of markers:
--- Tenkan/Kijun crosses,
--- Price (close)/Tenkan crosses, with the option of only showing those occurring with the trend, so on pullbacks,
--- Price (close) exits out of the Kumo,
--- Chikou exits out of the Kumo,
--- Overbought/Oversold conditions (shown on the chart).
- Choice of showing only long or short markers,
- Coloring of bars using OB/OS conditions,
- Alerts on all markers and on combinations.
The markers are intended as indications—not bulletproof buy/sell signals.
The overbought/oversold conditions are detected when the high/low is a multiple of ATR away from Kijun. The ATR length and multiple used are configurable.
I normally use the Josh Olszewicz (CarpeNoctom) big settings, so those are the default.
I prefer subtle coloring on charts and my choice of colors reflects that.
You will see references to KumoA and KumoB in the names of inputs and style elements. For me, KumoA is the top of the Kumo when it is bullish, so the bottom when bearish.
As usual when creating alerts, be sure you already have defined proper inputs and that you are on the intended interval, as they will be used when triggering alerts.

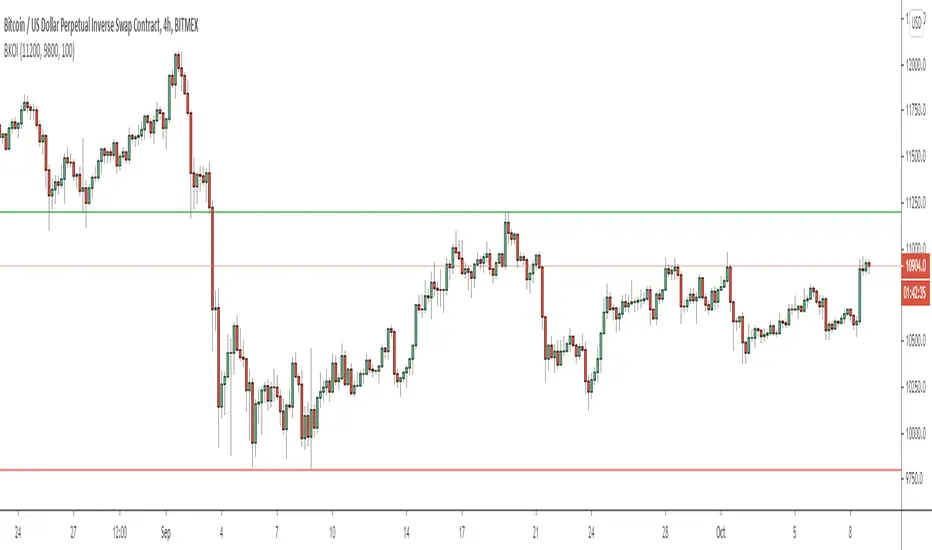
Breakout IndicatorThis script allows you to set breakout alerts.
An alert will be triggered only when price breaks and closes beyond the specified prices. You will get an alert on the first candle that closes beyond the levels you set.
92652HLB AlertThis alert will tell you the moment when it exceeds the high or low for a certain period of time. The default consists of three periods, meaning long term, medium term, short term. Alerts are also displayed on the chart with arrows, the longest arrow is long.
Alerts are set with the alert function of TradingView and individually set high value break and low price break for one period. The direction of the break indicates the direction of the market, and it seems that the break of the middle term is stronger than the short term.
In addition, the directionality when multiple breaks occur simultaneously or consecutively is recognized as stronger than a single break.

WaveTrend with Crosses and Alerts - Jab ZootaLazy bear created this script. I added alertconditions to send alerts on crossovers.

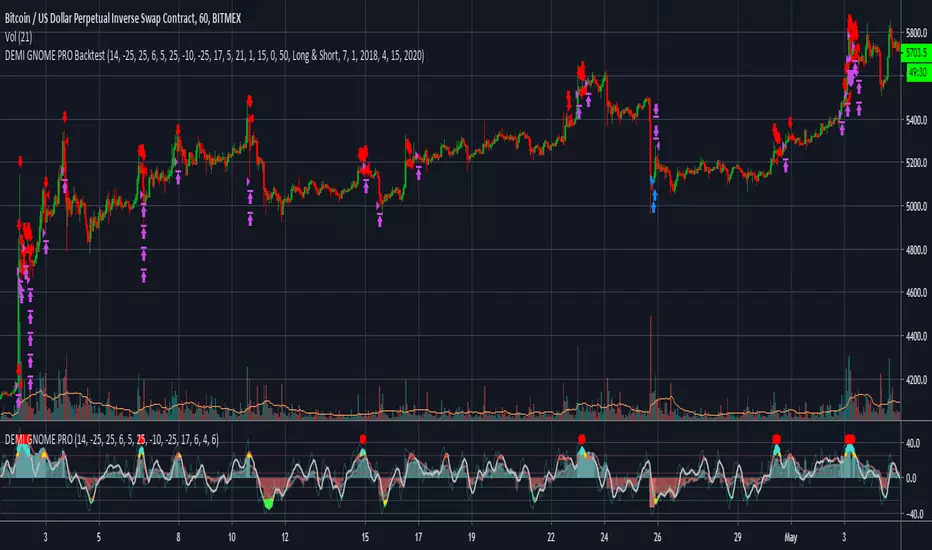
DEMI GNOME PROHello Fellow Traders!
-------------------------------------------
This is the newest addition to Gnome Alerts PRO
This is one of the newer scripts that we are using for scalping on the lower time frames on Bitmex & Binance.
This is a transformed version of GODMODE that adapts to market swings.
INCLUDES:
------------------------
*Autoview Ready*
BUY ALERTS
- multiple long positions
SELL ALERTS
- sell with oversold alerts
- sell based of %gain
Short Alerts For Bitmex
Backtesting is also available!
More info on how gain access in my profile!