Search in scripts for "bands"

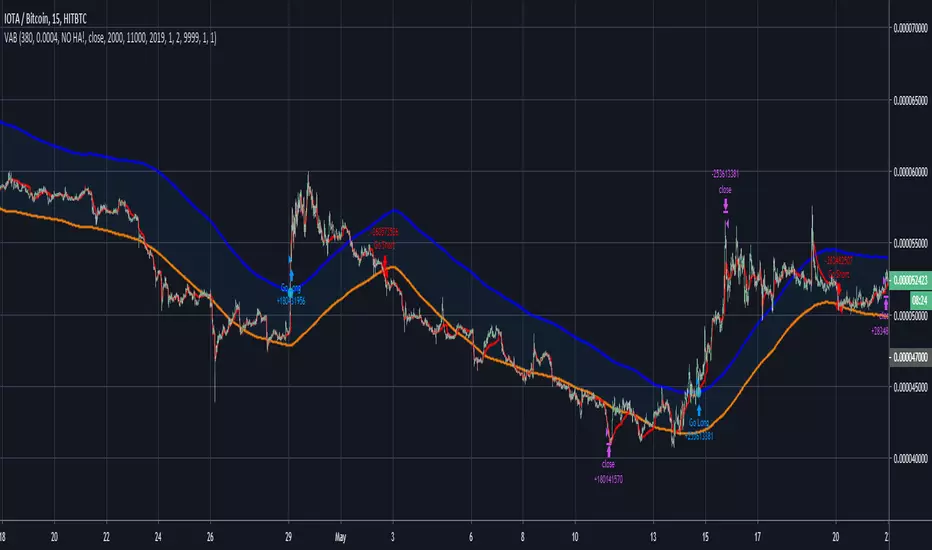
[XC] Adaptive strategy with volume bandsFirst much thanks to alexgrover for his rich source of unbelievable indicators
The list below shows as an example some might profitable strategy settings.
But like every new strategy only a long term test can tell you if it works.
//Curency - - src Time stategy Length C. Factor Smoothed SL TP Profit Factor (with no Commission)
//---------------------------------------------------------------------------------------------------------------------------------
//BTCUSD NOHA close 15min 1 240 10 yes 3000 25000 4.2 (June 2019)
//XBTUSD NOHA close 15min 1 310 0.00006 no 1000 11000 2.3 (June 2019)
//IOTABTC NOHA close 15min 1 380 0.0004 no 2000 11000 10.6 (June 2019)
Noro's BB + RSI Strategy v1.0Strategy uses 2 indicators:
1) RSI
2) Bollinger Bands
Opening of a position requires at the same time 2 signals (RSI + BB)
If the low of a candle is less than lower bound of BB - to open long position
If the candle growing - to close a long position
Short positions aren't used

Momentum Strategy, rev.2This is a revised version of the Momentum strategy listed in the built-ins.
For more information check out this resource:
www.forexstrategiesresources.com

Keltner Channel Backtest The Keltner Channel, a classic indicator
of technical analysis developed by Chester Keltner in 1960.
The indicator is a bit like Bollinger Bands and Envelopes.
You can change long to short in the Input Settings
WARNING:
- For purpose educate only
- This script to change bars colors.

BB limitMarket maker strategy using Bollinger bands as entry, moving average as close and simple stop-loss with percentage of entry position. It was extremely profitable in june on xbtusd.

BB+AO STRATto be used with AO indicator, based on forex strat --
www.forexstrategiesresources.com
works on 1/3/5/15/30 candles, buy signals are best when the black 3 fast ema crosses up through the red mid band

BB+AO STRATto be used with AO, based on forex strat --
www.forexstrategiesresources.com
works on 1/3/5/15/30 candles

Noro's Wizard Strategy v1.1For:
- Crypto/Fiat
- H1 timeframe
Indicators:
- Bollinger Bands (length = 40)
- RSI (length = 7)
- Body-filter
- Color-filter
Strategy
The lime line is the lower line of the BB indicator which is under construction at the candle low prices.
If low of a candle is lower than the lime line and at the same time RSI < 25 = to open a long-position
If the candle green and a body of a candle is more average body of a candle / 2 = to close long-position
Donate: 3BMEXvKkuJLobJrcpMm12bKTZoCnojZTjh

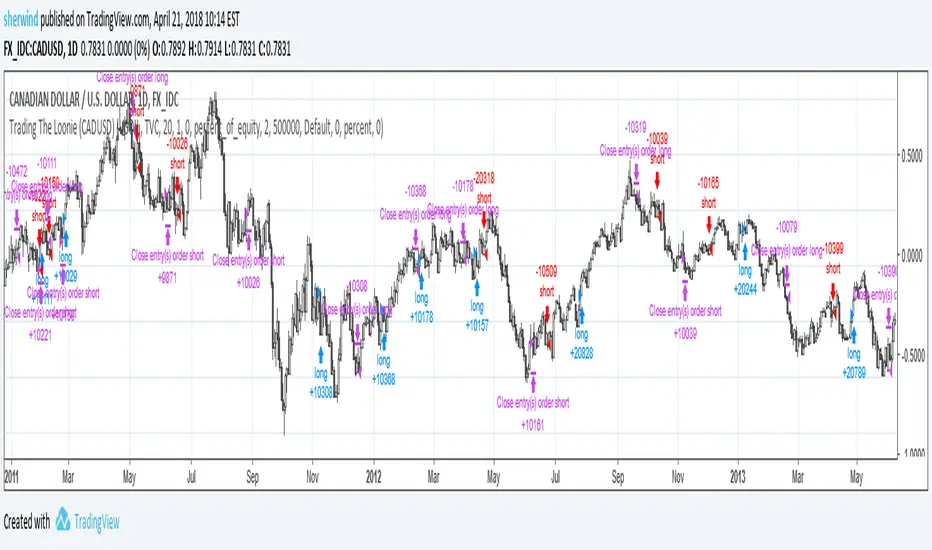
Trading The Loonie (CADUSD)A port of the trading strategy described at technical.traders.com
"In “Trading The Loonie,” which appeared in the December 2015 issue of STOCKS & COMMODITIES, author Markos Katsanos
explains the heavy correlation between the Canadian dollar and crude oil. He then goes on to describe how one could
trade this correlation. Using similar logic as that employed in Bollinger Bands, Katsanos has built a study to
provide buy and sell signals for trading the Canadian dollar future."
See Also:
- Backtesting and forwardtesting (of TradingView Strategies)
- 9 Mistakes Quants Make that Cause Backtests to Lie (blog.quantopian.com)
- When Backtests Meet Reality (financial-hacker.com)
- Why MT4 backtesting does not work (www.stevehopwoodforex.com)

Noro's Bollinger Strategy v1.3Bollinger Bands
Pyramiding!!!
For:
- any crypto
- timeframe: 1min, 3min, 5min, 15min, 30min, 1h

Noro's Bollinger Strategy v1.2Bollinger Bands
Pyramiding!!!
For:
- any crypto
- timeframe: 1min, 3min, 5min, 15min, 30min, 1h

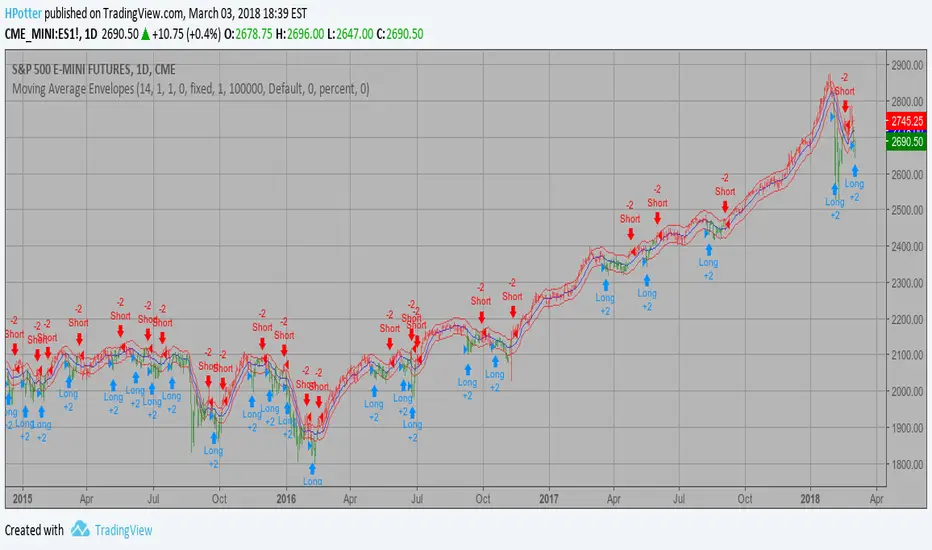
Moving Average Envelopes Backtest Moving Average Envelopes are percentage-based envelopes set above and
below a moving average. The moving average, which forms the base for
this indicator, can be a simple or exponential moving average. Each
envelope is then set the same percentage above or below the moving average.
This creates parallel bands that follow price action. With a moving average
as the base, Moving Average Envelopes can be used as a trend following indicator.
However, this indicator is not limited to just trend following. The envelopes
can also be used to identify overbought and oversold levels when the trend is
relatively flat.
You can change long to short in the Input Settings
WARNING:
- For purpose educate only
- This script to change bars colors.
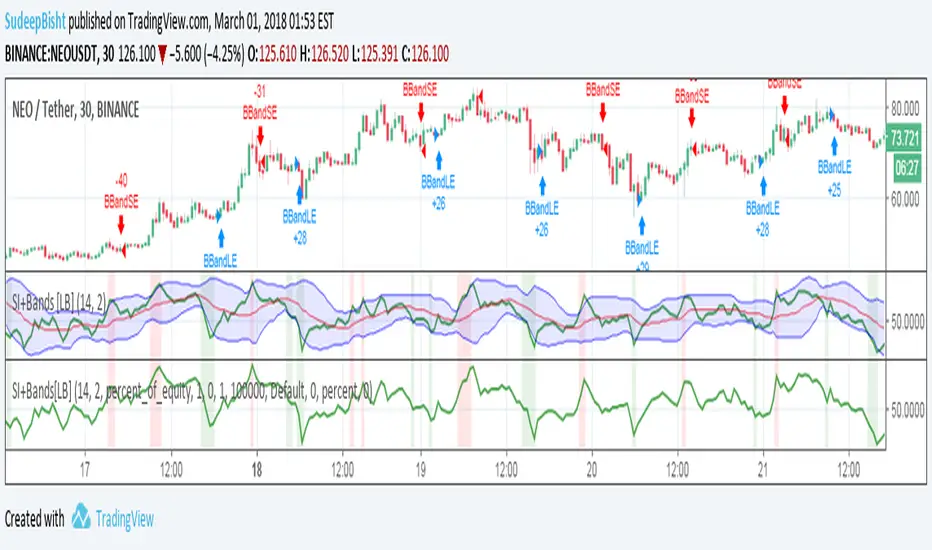
SB_RSI/MFI with Volatility Version 1.0Take on LazyBear's SB_RSI/MFI with Volatility Indicator.
The original indicator is coupled with the Bollinger Band strategy.
Original Idea:
Wanted to test the indicator with bbstrategy.
Message if you think of any modifications/ enhancements/ any opportunities. :)
Donations/Tips... :) -
BTC: 1BjswGcRR6c23pka7qh5t5k56j46cuyyy2
ETH: 0x64fed71c9d6c931639c7ba4671aeb6b05e6b3781
LTC: LKT2ykQ8QSzzfTDB6Tnsf12xwYPjgq95h4
Noro's Bollinger Strategy v1.1Bollinger Bands
Pyramiding!!!
For:
- any crypto
- timeframe: 1min, 3min, 5min, 15min, 30min, 1h

Noro's Bollinger Strategy v1.0Bollinger Bands only
Piramiding!!!
For:
- any crypto
- timeframe: 1min, 3min, 5min, 15min, 30min, 1h, 2h


