MACD Sticky Dots Bull & Bear
**Sticky Dots – Multi-Confirmation Momentum & Trend Indicator**
What is it?
Dots designed to show momentum of trend, weak or strong illustrated through size and color. Certain thresholds give GREEN DOTS OR RED DOTS, when strong the dots are LARGER. Colors of candles are plotted along with Buy and Sell signals and rare reversal signals (these are all plotted based on inputs in the indicator). Along with these Dots is a moving average derived from Bollinger Bands, this acts as both support and resistance to price. Also Pivot Highs and Pivot Lows get plotted based on all these inputs and price action combined.
BELOW IS MORE DETAILS
**Key Visual Elements & Color/Symbol Meaning**
**1. Candlestick Colors** (toggle: "Show Candle Colors")
- **Bright Green** (#00FF00 shades): Price closes ≥ upper dispersion band (close ≥ disp_up). Strong bullish momentum.
- **Bright Red** (#FF0000 shades): Price closes ≤ lower dispersion band (close ≤ disp_down). Strong bearish momentum.
- **Yellow** (#FFEA00): Price inside the dispersion bands (neutral zone). Trend is consolidating or weak.
**2. Basis Moving Average Line** (20-period EMA, toggle: "Show Price Basis MA")
The thick line on price follows the same coloring logic as candles derived from thresholds that deem them bullish(green), consolidating(yellow) or bearish(red):
- **Dark Green** (rgb(0,162,30)): Strong bullish
- **Lime Green** (rgb(153,253,2)): Moderate bullish
- **Yellow** (#FFEA00): Neutral or weak.
- **Red** (rgb(243,13,13)): Bearish
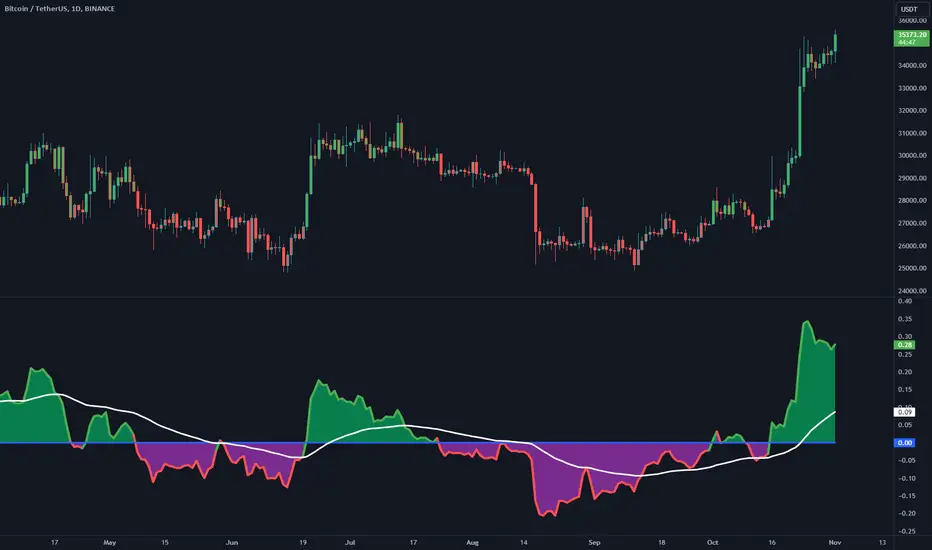
**3. MACD Dots/Circles** (below bars, toggle: "Show Dots")
Normalized & sigmoid-compressed MACD histogram plotted as sticky dots:
- **small Green Dots** MACD positive:
- Solid bright green (#00FF00): Increasing momentum.
- Slightly transparent green (#16FF0A): Decreasing but still bullish.
- **Large Circle** (instead of small dot): Stochastic Momentum is in strong bull zone→ overbought emphasis.
- **Red Dots/Circles** (condensed_histNorm < 50):
- Solid bright red (#FF0000): Decreasing momentum (stronger bearish).
- Slightly transparent red (#FF0707): Increasing but still bearish.
- **Large Circle**: Stochastic Momentum is in strong bear zone → oversold emphasis.
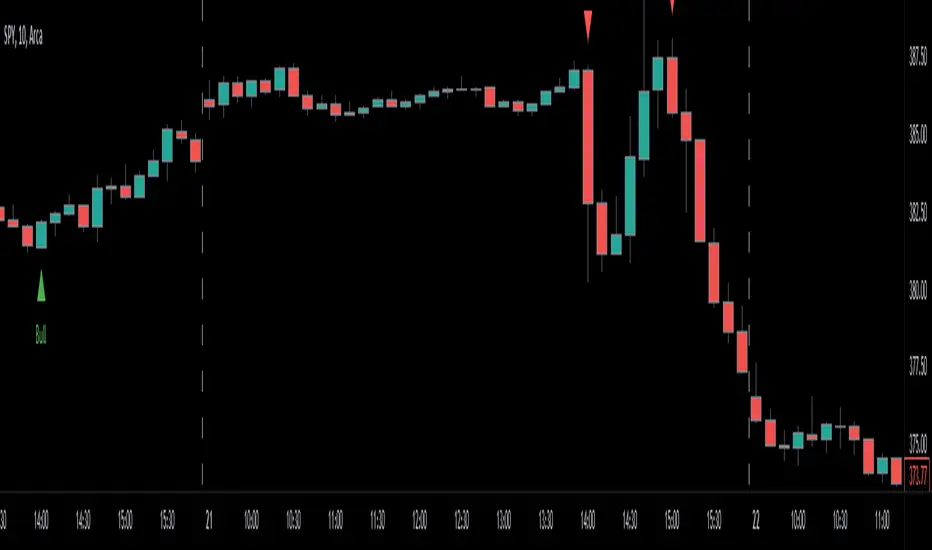
**4. Buy/Sell Signals**
- **"B"** (green, below bar): Buy signal – confluence of all inputs in indicator in bullish state prints B
- **"S"** (red, above bar): Sell signal – confluence of all inputs in indicator in bearish state prints S
- **"R"** (yellow, below bar): Reversal – appears only after a completed downswing when price closes back above basis with new green dots (signals potential bottom).
**5. Pivot High / Pivot Low Lines** (horizontal) DESIGNED TO FIND PIVOT TOPS/BOTTOMS
- **Red horizontal line** (from swing high): Marks confirmed Pivot High during an active long (buy) position. Triggered when red circles appear after a bright red condition.
- **Green horizontal line** (from swing low): Marks confirmed Pivot Low during an active short (sell) position. Triggered on fresh green circles.
**6. Optional Plots**
- **Outer Bollinger Bands**: Standard Bollinger bands by the Great John Bollinger.
- **Dispersion Bands** (white, with translucent fill matching Trend color)
**How to Read & Trade the Indicator**
1. **Overall Trend Direction**
- Look at the Basis MA color first:
- Green → Uptrend bias.
- Red → Downtrend bias.
- Yellow → Range/Consolidation.
2. **Momentum Strength**
- Green dots/circles (especially large ones) = bullish momentum building.
- Red dots/circles (especially large) = bearish momentum building.
- Brighter dots + price outside dispersion = stronger conviction.
3. **Candle Coloring for Quick Bias**
- Green candles = price in strong bullish zone.
- Red candles = strong bearish zone.
- Yellow = indecision/consolidation – wait for breakout.
4. **Entry Signals**
- Wait for a **"B"** in a green/yellow candle context with green dots appearing.
- Best entries when price is above basis and Green dots are Large
- **"R"** label =potential big Reversal
5. **Exit / Reversal Management**
- Active long → watch for red circles → confirmed PH line = potential exit zone.
- Active short → watch for green circles → confirmed PL line = potential cover zone.
- **"R"** label = early warning of possible reversal after a downswing.
Pine Script® indicator