Quantum Cryptocurrency Strength Indicator (CCSI)Exciting new markets require exciting new indicators and with the plethora of cryptocurrencies now available and increasingly being offered through mainstream brokers, at Quantum Trading we thought it was time for us to step in and develop something unique to help traders and investors trading the new kids on the block.
Cryptocurrencies like their more established cousins in forex, are in a constant state of flux moving from overbought to oversold and back again, but at a much faster pace, and generally associated with volatility. The challenge of course is picking those phases of price action where these conditions have been met and so offering the trader two opportunities. Either to take a position ahead of any reversal and so get in early before the trend develops, or alternatively to wait until the trend is underway and then jump in. You can think of this as a train in the station. Do you board early before it leaves, or jump aboard once it is underway? Both approaches have advantages and disadvantages, but the choice is yours.
So, our development team set to work to deliver the perfect indicator to deliver this information for you visually and quickly, and we are proud to announce the Cryptocurrency Strength Indicator or the CCSI for short. And if you thought this looks similar to its hugely popular currency strength indicator for forex then you would be right.
This indicator is of course a little different, though the principles of how to use it can be considered the same. So how does it work? Well, first of all, here we are dealing with a cryptocurrency pair, rather than isolating out the currency itself, as every cryptocurrency is quoted against the USD in some way. In these markets we are seeing the movement of the cryptocurrency against the US dollar and in developing the indicator we have chosen to display this against Tether. In other words, USDT.
The indicator displays seven of the most popular cryptocurrencies against the USDT, but what we have also included in the design is the option to deselect these and select others of your choice, so you have complete control of those cryptocurrencies you wish to trade. In addition, we understand that alerts are a hugely popular function of the TradingView platform, so we have added these in these also. And of course, as you would expect we have included the option to isolate out those of interest. So how do we use the indicator?
First, as you might expect, the cryptocurrency market tends to move ‘en mass’ – in other words generally either moving higher or lower together. You can think of this as an equivalent to the currency matrix in forex, where currencies of one denomination, such as the yen will all move in the same direction if the yen is being bought or sold universally. It is the same here. On occasion, on the faster timeframes, one does see divergence, but as a general rule, they will all tend to move together which is great as it gives you the confidence you are trading in the direction of the entire market. What is important however is the direction of the USDT. This will ALWAYS be in the opposite direction which is why we isolate it out from the others, to reveal precisely how this is moving. Remember, what drives a strong trend is when one currency is rising and another falling in forex and it is exactly the same here. When the USDT is rising strongly and the cryptocurrencies are falling, then a strong trend is underway. Equally, if the USDT is falling strongly then you will see a strong trend in your chosen cryptocurrency.
Next, we look for overbought and oversold opportunities in precisely the same way as for the currency strength indicator. Cryptocurrencies are in a constant state of flux moving from oversold to overbought and back again in all timeframes so there are always plenty of opportunities to employ this tactic and get in early at the start of a new trend. The angle of inclination of the line reveals the strength of the move, but equally, if the cryptocurrencies are moving sideways along with the USDT then we have to wait and be patient. But the beauty of this market is that it genuinely trades twenty-four hours a day, and seven days a week. Trend trading is another great tactic and as soon as the move is underway you can jump on the moving train and join a current trend and with cryptocurrencies, you don’t normally have to wait long as the price action is constant.
However, don’t just think of the Cryptocurrency Strength Indicator as a tool for simply getting you in. It will also help you to stay in and get out at the right time. After all if it’s good enough to get you in then it’s good enough to keep you in also. But remember, when the lines are moving sideways along with the USDT, then it’s a question of being patient and waiting. In other words, it helps to keep you out too.
The indicator works in all timeframes on the TradingView platform from seconds and upwards, so all trading approaches and tactics are catered for with this indicator. It can be used with any instrument whether through a conventional broker or for trading binary options which are extremely popular, and of course cryptocurrency futures too.
Search in scripts for "crypto"

Extreme Money [Crypto Trading FR]Extreme Money aims to smooth out market fluctuations and predict trend changes.
The algorithm shows the turning points in the market and uses multiple filters to present the best potential turning points. Although this is its core functionality, Extreme Money also incorporates a series of popular other indicators (see below) allowing full identification of trends on the chart.
The tool aims to calculate market strength and then show potential turning points in the market signalled with small circles. Once the trend confirmation has changed, the algorithm signals a circle, giving the trader the potentially desired entry with an audible or pop-up alert if needed. The more circles there are when setting up the entry, the greater the chances of a trend reversal.
This algorithm can be used on all time intervals, as well 5, 15 or 30 minutes but it is particularly recommended on the 1H, 2h and 4H intervals for maximum efficiency. The indicator works as well for swing-trading as for intra-day trading: whatever the time interval selected, it filters potential entries with great precision.
The algorithm can also be used with any cryptocurrency or currency pairs from traditional markets, the parameters of the algorithm can be customized and adapted without difficulty.
Extreme Money also includes 8 indicators assembled in a single script, which can be activated or deactivated manually:
1) Algo (main indicator)
2) EMA
3) Hull
4) Trend
5) Pivots
6) Trend line
7) VWAP Line
8) RSI Swing
Benefits :
- Notifies the trader of potential entries
- Color coded entries for buying and selling
- Creates cluster signals at potential turn points
- Aims to avoid market noise
- Used on all types of timefames
- Analyze the current market trend
- Assists in Predicting Market Turn Points
- Cryptocurrency, FX, stock indices and gold trades
- Maximize profits
- Analyzed market strength and weakness

Ichimoku Cloud(Crypto mode)Adapted to Cryptocurrency market, with a larger range . simple and familiar , visualy accord with classic interface.
Polarium ISC, inc.
SAPSAN TRADE: Macro / CryptoSAPSAN TRADE: Macro / Crypto displays key macroeconomic indicators that affect the cryptocurrency market: the US Dollar Index (DXY), US inflation (CPI), and Federal Reserve interest rates (FEDFUNDS). The indicator plots the current values and EMAs for each indicator, visualizes changes with histograms and background colors, and shows a table with the latest values on the most recent candle.
Ideal for traders who want to consider macroeconomic factors in crypto analysis and track the real-time dynamics of key economic indicators.
RU
SAPSAN TRADE: Macro / Crypto отображает ключевые макроэкономические показатели, влияющие на криптовалютный рынок: индекс доллара США (DXY), инфляцию (CPI) и процентные ставки ФРС (FEDFUNDS). Индикатор строит значения и EMA для каждого показателя, а также визуализирует изменения через гистограммы и фоновое окрашивание. На последней свече выводится таблица с актуальными значениями всех выбранных макроиндикаторов.
Идеально подходит для трейдеров, которые учитывают макроэкономические факторы при анализе крипторынка и хотят видеть динамику ключевых индексов в реальном времени.

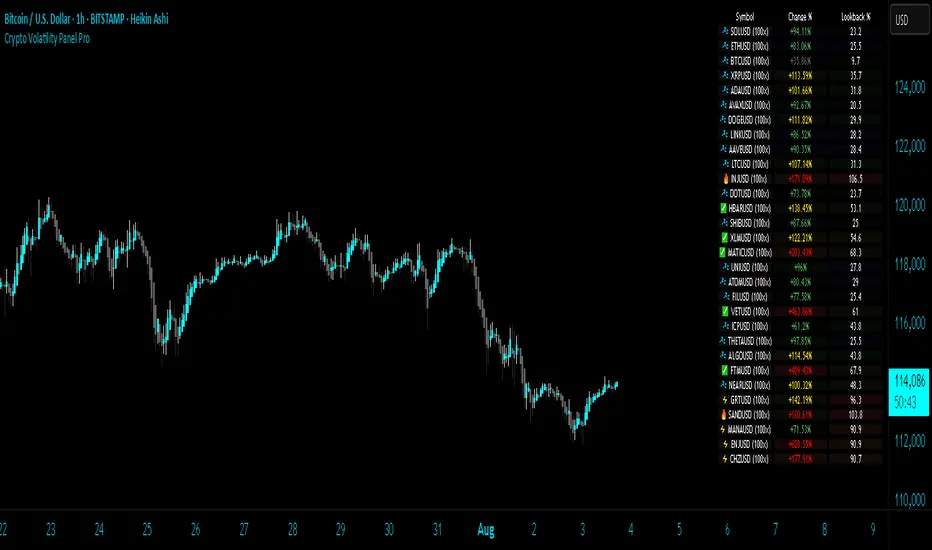
Crypto Volatility Panel ProCrypto Volatility Panel Pro
This advanced indicator creates a comprehensive volatility monitoring dashboard that displays real-time volatility metrics for up to 30 cryptocurrency pairs simultaneously. The tool combines sophisticated volatility assessment techniques with leverage-adjusted analysis and heat map visualization to provide enhanced market insights in an organized table format.
Proprietary Methodology
This indicator utilizes a proprietary dual-metric volatility assessment system developed specifically for cryptocurrency market analysis. The methodology combines advanced technical analysis components including price volatility measurements, range position analysis, and leverage scaling algorithms optimized through extensive market testing.
The unique approach enables more accurate volatility assessments across diverse cryptocurrency price ranges and market conditions compared to standard volatility indicators. Specific calculation methods and optimization parameters remain proprietary to maintain competitive advantages.
Core Functionality and Innovation
Unlike standard volatility indicators that focus on single instruments, this tool provides simultaneous multi-asset monitoring with proprietary volatility calculations specifically optimized for cryptocurrency markets. The innovation lies in combining multiple volatility assessment techniques with enhanced leverage scaling algorithms, heat map ranking system, and comprehensive multi-asset dashboard presentation.
The indicator processes data from up to 30 different cryptocurrency pairs, each with independent leverage settings ranging from 0.1x to 10,000x. Users can apply universal leverage across all pairs for consistent analysis scenarios, or customize individual leverage ratios for specific trading strategies.
Visual Organization and Heat Map System
The table displays three primary columns with an advanced heat map ranking system:
Symbol Column: Shows cryptocurrency pair names with dynamic visual indicators (🔥, ⚡, ✅, 💤) representing volatility intensity levels. Each symbol includes its current leverage setting in parentheses for reference. Invalid or unavailable symbols display error indicators (❌) with appropriate error messaging.
Change Percentage Column: Displays leverage-adjusted volatility measurements with both color-coded text and heat map background ranking. Text colors indicate volatility levels (Red for extreme, Yellow for high, Green for moderate, Gray for low), while background heat map colors rank performance relative to all monitored pairs.
Lookback Percentage Column: Shows leverage-adjusted position analysis within recent price ranges with heat map background ranking, indicating market positioning relative to recent highs and lows across all monitored instruments.
Advanced Heat Map Ranking
The proprietary heat map system ranks all enabled pairs in real-time based on their volatility metrics, providing instant visual identification of the most and least volatile instruments:
Hottest (Top 10%): Deep red background indicating highest volatility
Warm (10-20%): Orange-red background for elevated volatility
Medium (20-40%): Yellow background for moderate-high volatility
Cool (40-60%): Green background for moderate volatility
Cold (60-80%): Blue background for low volatility
Sleepy (Bottom 20%): Dark background for minimal volatility
Heat map opacity is fully customizable, and the system can be disabled for users preferring traditional static backgrounds.
Configuration Options
Expanded Pair Selection: Monitor up to 30 cryptocurrency pairs across major exchanges including Bitstamp and Binance. Default selections include established cryptocurrencies (BTC, ETH, SOL) and emerging assets (INJ, NEAR, FTM), with full customization available.
Table Positioning: Nine position options including top/middle/bottom combinations with left/center/right alignment, allowing optimal placement on any chart layout without interfering with price action or other indicators.
Visual Customization: Comprehensive control over table dimensions, frame width, font size, background colors, frame colors, header styling, text colors, and heat map color schemes to match user preferences and chart themes.
Leverage Management: Individual leverage settings for each of the 30 pairs, with optional universal leverage mode that applies consistent multipliers across all enabled pairs. Supports extreme leverage ranges up to 10,000x for advanced risk modelling.
Error Handling: Robust symbol validation with clear error indicators for invalid, unavailable, or misconfigured trading pairs, ensuring reliable operation across different market conditions.
Practical Trading Applications
Multi-Asset Volatility Screening: Identify the most and least volatile cryptocurrency markets in real-time using the heat map ranking system, enabling quick allocation of attention to instruments with the highest potential for profitable moves.
Leverage Risk Assessment: Visualize how different leverage ratios amplify volatility metrics across multiple markets simultaneously, supporting informed position sizing decisions before entering leveraged trades.
Market Timing and Rotation: Use the combination of volatility measurements and heat map rankings to identify optimal entry/exit timing across cryptocurrency markets, facilitating effective portfolio rotation strategies.
Portfolio Diversification: Compare volatility levels and rankings across 30 cryptocurrencies to construct portfolios with desired risk characteristics, balancing high-volatility growth opportunities with stable store-of-value positions.
Risk Management Dashboard: Monitor real-time volatility changes and relative rankings to adjust position sizes, implement protective measures, or reallocate capital when market conditions change significantly.
Technical Implementation
Built using Pine Script v5 with optimized security request handling to minimize performance impact while accessing 30 external data sources simultaneously. The indicator uses efficient array-based data collection, real-time ranking algorithms, and conditional table updates to maintain smooth chart operation.
The heat map system employs dynamic ranking calculations that process all enabled pairs in real-time, sorting values and applying percentile-based color mapping for instant visual feedback. Error handling includes invalid symbol detection and graceful fallback display for unavailable data feeds.
Usage Instructions
Configure Pair Selection: Enable desired cryptocurrency pairs from the 30 available options, organized across three input groups for easy navigation. Set individual leverage values or activate universal leverage mode for consistent multipliers.
Customize Heat Map: Adjust heat map colors and opacity to match your visual preferences and chart theme. The system can be disabled for users preferring static backgrounds.
Position and Style Table: Select optimal table position from nine available options and customize appearance including colors, sizing, and text elements to integrate seamlessly with your trading setup.
Interpret Rankings: Monitor both absolute values and heat map rankings to identify relative performance.
Hottest colors indicate pairs experiencing the highest volatility relative to the monitored universe.
Apply Leverage Context: Use leverage-adjusted values to understand how volatility would affect leveraged positions, remembering these are mathematical projections designed for risk assessment rather than trading signals.
Advanced Features
Dynamic Symbol Processing: The indicator automatically handles symbol validation, displaying clear error messages for invalid or unavailable trading pairs while maintaining operation for valid symbols.
Real-Time Ranking: Heat map colors update dynamically as market conditions change, providing instant visual feedback on shifting volatility patterns across the cryptocurrency universe.
Scalable Monitoring: Users can monitor anywhere from a few key pairs to the full 30-pair universe, with the ranking system automatically adjusting to the number of enabled instruments.
Cross-Exchange Support: Incorporates data from multiple cryptocurrency exchanges to provide comprehensive market coverage and reduce single-source dependency risks.
Limitations and Important Considerations
Proprietary Algorithm: The specific calculation methods are proprietary and not disclosed. Users should evaluate the indicator's output through their own analysis and testing before incorporating it into trading decisions.
Complex Volatility Model: While the proprietary methodology is sophisticated, it represents one approach to volatility assessment and may not capture all forms of market volatility such as gap movements, flash crashes, or news-driven events.
Performance Considerations: Processing data from up to 30 external securities may impact chart loading speed or cause timeouts during periods of high TradingView server load. Users experiencing performance issues should consider reducing the number of enabled pairs.
Leverage Calculations: Leverage adjustments are mathematical projections that assume linear scaling, which may not reflect actual leveraged trading mechanics including margin requirements, funding costs, liquidation risks, and exchange-specific policies.
Market Data Dependencies: Cryptocurrency prices and volatility can vary significantly between exchanges. The indicator's data sources may not represent the specific exchange or trading pair you use, and some feeds may experience gaps or delays during maintenance periods.
Ranking Relativity: Heat map rankings are relative to the enabled pair universe. Rankings will change based on which pairs are monitored and their current market conditions, making absolute interpretations less meaningful than relative comparisons.
Educational Value
This indicator helps traders develop understanding of relative volatility patterns across cryptocurrency markets and the mathematical impact of leverage on risk metrics. The heat map system provides intuitive visualization of market dynamics, helping users identify which assets are experiencing unusual activity relative to their peers.
The tool serves as an educational platform for understanding advanced volatility measurement techniques, relative ranking systems, and multi-asset risk assessment concepts that are crucial for professional cryptocurrency trading and portfolio management.
Performance and Compatibility
The indicator is optimized for cryptocurrency markets but can be adapted to other volatile asset classes by modifying the symbol inputs. Security request limits may occasionally affect data availability, particularly when multiple indicators requesting external data are used simultaneously on the same chart.
The heat map rendering system is designed for efficiency, updating color mappings only when ranking changes occur rather than on every price tick, ensuring smooth chart performance even when monitoring the full 30-pair universe.
Risk Disclaimer: This indicator is designed for educational and analytical purposes only. Volatility calculations are estimates based on historical price data and proprietary mathematical models that are not disclosed. Results do not constitute trading advice or predictions of future price movements. Users should conduct independent analysis to evaluate the indicator's effectiveness before making trading decisions.
Leveraged trading involves substantial risk of loss and may not be suitable for all investors. Always conduct thorough research and consider consulting with qualified financial professionals before making leveraged trading decisions. Cryptocurrency markets are highly volatile and can result in significant losses. Past volatility patterns do not guarantee future market behavior.
This indicator is compatible with all TradingView chart types and timeframes. It is specifically designed for cryptocurrency markets using proprietary algorithms optimized for digital asset volatility characteristics.
Top Crypto Above 28-Day AverageDescription
The “Top Crypto Above 28-Day Average” (CRYPTOTW) script scans a selectable universe of up to 120 top-capitalization cryptocurrencies (divided into customizable 40-symbol batches), then plots the count of those trading above their own 28-period simple moving average. It helps you gauge broad market strength and identify which tokens are showing momentum relative to their recent trend.
Key Features
• Batch Selection: Choose among “Top40,” “Mid40,” or “Low40” market-cap groups, or set a custom batch size (up to 40 symbols) to keep within the API limit.
• Dynamic Plot: Displays a live line chart of how many cryptos are above their 28-day MA on each bar.
• Reference Lines: Automatic horizontal lines at 25%, 50%, and 75% of your batch to provide quick visual thresholds.
• Background Coloration: The chart background shifts green/yellow/red based on whether more than 70%, 50–70%, or under 50% of the batch is above the MA.
• Optional Table: On the final bar, show a sortable table of up to 28 tickers currently above their 28-day MA, including current price, percent above MA, and “Above” status color-coding.
• Alerts:
• Strong Batch Performance: Fires when >70% of the batch is above the MA.
• Weak Batch Performance: Fires when <10 cryptos (i.e. <25%) are above the MA.
Inputs
• Show Results Table (show_table): Toggle the detailed table on/off.
• Table Position (table_position): Select one of the four corners for your table overlay.
• Max Cryptos to Display (max_display): Limit the number of rows in the results table.
• Current Batch (current_batch): Pick “Top40,” “Mid40,” or “Low40.”
• Batch Size (batch_size): Define the number of symbols (1–40) you want to include from the chosen batch.
How to Use
1. Add the CRYPTOTW indicator to any chart.
2. Select your batch and size to focus on the segment of the crypto market you follow.
3. Watch the plotted line to see the proportion of tokens with bullish momentum.
4. (Optional) Enable the results table to see exactly which tokens are outperforming their 28-day average.
5. Set alerts to be notified when the batch either overheats (strong performance) or cools off significantly.
Why It Matters
By tracking the share of assets riding their 28-day trend, you gain a macro-level view of market breadth—crucial for spotting emerging rallies or early signs of broad weakness. Whether you’re swing-trading individual altcoins or assessing overall market mood, this tool distills complex data into an intuitive, actionable signal.

Crypto Notes Scalping Indicator by Mohsin
**Crypto Notes Indicator**
This custom trading indicator, named "Crypto Notes," is designed to assist traders in analyzing cryptocurrency price movements. It combines two key components: the SSL (Stochastic Support and Resistance) channel and a Moving Average.
**Indicator Components:**
1. **SSL Channel:**
- The SSL channel is a technical analysis tool that helps identify potential support and resistance levels in the cryptocurrency price chart.
- The indicator calculates two values: `sslDown` and `sslUp`, which represent potential support and resistance levels, respectively.
- The SSL channel is based on a user-defined period and length, allowing traders to customize the sensitivity of the support and resistance levels.
2. **Buy and Sell Signals:**
- Buy and sell signals are generated when the `sslUp` crosses above `sslDown` (a buy signal) or when `sslUp` crosses below `sslDown` (a sell signal).
- These signals help traders identify potential entry and exit points for their cryptocurrency trades.
3. **Moving Average (MA1):**
- The indicator also includes a customizable exponential moving average (EMA) with a length defined by the user.
- This moving average (MA1) can be used to smooth out price data and identify trends in the cryptocurrency's price movement.
**How to Use:**
1. **SSL Channel:** The SSL channel visually represents potential support and resistance levels on the price chart. Traders can observe price behavior concerning these levels to make trading decisions.
2. **Buy Signals:** Buy signals are labeled as "BUY" on the chart when `sslUp` crosses above `sslDown`. This is an indication of a potential bullish trend or an opportune time to enter a long position.
3. **Sell Signals:** Sell signals are labeled as "SELL" on the chart when `sslUp` crosses below `sslDown`. This suggests a potential bearish trend or an opportune time to exit a long position or consider shorting.
4. **Moving Average (MA1):** The customizable moving average (MA1) can help traders identify trends in the cryptocurrency's price movement. When MA1 is above the price, it may suggest an uptrend, and when it's below, it may suggest a downtrend.
**Customization:**
- Traders can adjust the indicator's parameters, such as the SSL channel period, length, and the length of the EMA (MA1), to suit their specific trading strategies and preferences.
**Disclaimer:** This indicator is a tool for technical analysis and does not provide financial advice. Trading cryptocurrencies involves risks, and users should conduct thorough research and risk management before making any trading decisions.
**Note:** It's essential to thoroughly test this indicator and incorporate it into a comprehensive trading strategy before using it for actual trading.
---
Please ensure you understand the indicator's functionality and consider using it alongside other tools and analysis methods as part of your trading strategy.

Trendmaster - Crypto Flow IndexWhat it is:
The Trendmaster Crypto Flow Index is a unique tool designed to give you an overview of the performance of different Crypto market sectors and sub-sectors. It helps you to identify where you should be focusing your investments for maximum portfolio efficiency and profitability.
What it does:
The Crypto Flow Index presents a visual overview of the flows of retail and institutional capital into the four main market sectors: Large Caps, Alts Coins, Shit Coins, and Stable Coins as well as several other sub-sectors. Each sector is assigned a "Flow Score", which indicates its current performance, demand, and strength in percentage terms. The "Flow Score" also provides insights into the current stage of the market cycle and the typical over and underperformances of assets that correlate to it. Additionally, the index factors in the sector have a "Correlation" to the broader market, allowing you to see the best sectors for trading and investing, either for positional hedging or differential plays.
How to Use it:
To use the Trendmaster Crypto Flow Index, you can simply observe the evolving colored line within the indicator and the table overview. You can identify which sectors are outperforming or underperforming the general market and make informed decisions about where to direct your focus and funds. By monitoring the transitions of Flow between sectors, you can gain invaluable insights into the market cycle and the typical over and underperformances of assets that correlate to it. This information will help you to maximize portfolio efficiency by targeting different market sectors based on their performance to the overall cryptocurrency market. The index covers different sectors, including Large caps, Alts, Shit, Stables, AI, Defi, Dex, Exchange, Gaming, Meme, Metaverse, Nft, Privacy, Smart, and Sports.
Examples of Cryptocurrencies represented in the different market sectors:
Large caps: The biggest market cap cryptocurrencies such as BTC and ETH.
Alts: High-cap and high-volume digital assets that are smaller than large caps, such as LTC and XRP.
Shit coins: Smaller cap projects that are highly speculative and experience significant price volatility, such as BAT and HOT.
Stables: Fiat-pegged assets that provide a stable value, such as USDT and USDC.
AI: Projects that are based on artificial intelligence, such as FET and AGIX.
DeFi: Leverages high volume smart contract platforms to provide financial products in crypto, mainly ERC20 tokens such as LINK and AAVE.
DEX: Decentralized exchanges with their own utility tokens, such as UNI and SUSHI.
Exchange: Centralized exchanges with their own utility tokens, such as BNB and CRO.
Gaming: Web3/crypto gaming platforms with their own utility tokens, such as AXS and GMT.
Meme: Similar to shit coins, but with no real functionality and based purely on social media and memes, such as DOGE and SHIB.
Metaverse: Projects that aim to provide Metaverse assets such as virtual land and assets, such as MANA and SAND.
NFT: Non-fungible tokens with their own token or NFT-based platforms that have their own utility tokens, such as APE and LOOKS.
Privacy: Anonymous and privacy-focused chains, such as XMR and ZEC.
Smart: Projects that provide smart contract alternatives to ETH, such as ADA and AVAX.
Sports: Fan tokens based on real-world sports teams or platforms that support and distribute them, such as CHZ and FLOW.

Trendmaster - Crypto On-Chain Metric BundleWhat it is:
The ‘Trendmaster Crypto On-Chain Metric Bundle’ is truly a one-of-a-kind bundle. It provides a complete insight into the on-chain dynamics of the entire Crypto asset class, with a multitude of different included indicators providing unique information and data points to give users an edge regardless of ticker, timeframe, or trading style.
What it Does:
Allows you to switch between several different metrics in one place and see specific combined metrics and look at the metrics to take contrarian positions
How to Use it:
Use these metrics to see the on-chain actions in cryptocurrency and play the contrarian. For example, when people are flooding into stablecoins as the price goes down you can see that as a potential buy indicator.
All metrics can be viewed with a Dashboard allowing the user to see all of the information in 1 place.
List of On-Chain Metrics:
To begin with, we have the ‘Trendmaster On-Chain Rating’ – which is our all-in-one, complete on-chain overview metric that can give you an instant insight into the fundamental and underlying strength of any given Crypto asset. It collates the key factors provided by all other indicators within the bundle, weighing in and condensing all of that information into a simple -5 to 5 scale; with a -5 indicating a completely bearish outlook on the asset, and a +5 representing truly great upcoming upside potential. As this indicator is taking into account large amounts of data and statistics to provide an on-chain overview, this value is best taken into consideration on higher timeframes such as the 4hour or daily to provide fundamentally strong buy or sell swing trade opportunities. Extreme rating signals on this indicator are rare but always worth taking into serious consideration.
Secondly, we have the ‘Collated Open Interest Oscillator’ – which gives us a peek into the current outlook of the derivatives market across a wide array of Crypto futures on a number of different exchanges. This indicator provides data on a 0-100 scale, with 100 indicating a substantial and sustained increase in open derivative positions in relation to the underlying market volume. A score of 100 can tell us that a huge amount of traders are trying to position themselves with high leverage in anticipation of a big move, and can often be compared to periods of extreme greed from market participants. On the contrary, a value of 0 shows us that the derivative market is decreasing in volume and therefore open interest is decreasing, which can be likened to periods of extreme fear. This data is only provided at daily intervals, but as incredibly high or low values on this indicator can have an almost instant impact, this indicator is best utilized for medium-term trading and investment decisions.
The ‘Social Sentiment Oscillator' analyses bullish and bearish narratives in relation to a number of large Cryptocurrencies and the market in general, across multiple social media platforms. Rather than a traditional 0-100 ‘Fear & Greed’ index that many may be familiar with, this indicator tracks the changing in sentiment across platforms on a -100 to 100 scale. A score of -100 may not necessarily indicate immediate extreme fear in the market, but instead a huge shift from an incredibly bullish narrative to an incredibly bearish one. Similar to a score of 100, this does not necessarily indicate that the current outlook on social media platforms is currently positive, but rather that a substantial amount of people are altering their views and have become more bullish on a short-term basis. This data is only provided at daily intervals, so make sure to keep an eye on price and sentiment divergences for the best swing trade opportunities to play contrarian to the majority.
Following this is the ‘Miner Confidence Metric’, which provides a long-term overview of the current Crypto miner's outlook. This simple -10 to 10 scale gives us an easy-to-follow bearish to the bullish sentiment of miners. This indicator takes into account the current hash rate, looking at both how it historically compares as well as its rate of decrease/increase; as well as on-chain miner movements to verify their stance on either holding onto their Crypto earnings or preferring to move their coins to exchanges to sell and cover their running costs. Generally speaking, miners can face difficulties operating during times of large market drawdowns, and may be forced into offloading and selling physical and virtual resources to remain afloat – this is indicated by a -10 value at the extreme end, and has historically provided outsized returns for long-term investors accumulating at their demise. Contrary to this, a score of 10 can indicate that miners are not only bullish on the future of crypto, but are likely also expanding operations in anticipation of higher prices in the future. This data is only provided at daily intervals, but on longer-term timeframes provide some of the best long-term accumulation opportunities available to market participants.
Next is the ‘Collated On-Chain Volume’ indicator, which simply monitors a variety of Cryptocurrencies and their underlying on-chain transactional usage. When collating these volumetric data it can provide invaluable insight into the current actions taken by market buyers and sellers and often larger players who can have a big influence on price. Typically when we see large spikes in on-chain usage it indicates substantial levels of accumulation or distribution, which can be made more obvious by observing where we currently are in a market cycle. Large spikes after large and extended periods of drawdown can represent coins transferring from retail to larger players who are often referred to as ‘smart money’; and with large on-chain volume following a substantial bull cycle, this may show us larger players distributing coins to retail. Data can only be fetched at daily intervals, but watch for big spikes to try and position yourself alongside the big players.
We also have the ‘Holder in Profit %’ which as it sounds, is just giving us a percentile value of Crypto traders, investors, and holders who are currently in profit on their positions. Historically speaking, when a majority are at a loss – and buying ‘when there is blood in the streets has been a profitable venture. Considering cutting some of your positions when market exuberance is in full effect and a vast majority of participants are reaping in easy profits. As data is only obtained at daily intervals, using this as a longer-term gauge for where we may be in a cycle is where it is most insightful.
The ‘Long/Short Ratio Crossover’ analyses the current disparity between traders who have positioned themselves in a long position on derivatives markets in comparison to those betting on prices going down. This indicator provides another impressive insight into the fallacy of the herd mentality, and how aiming to be on the opposite side of the masses can often be a profitable venture. A value of 100 can show us that an overwhelming majority of traders are predicting a price increase and are trying to position themselves accordingly, whereas a value of -100 indicates almost all derivative traders are trying to bet on a sizeable market downturn. This metric can be useful for both long-term positions and shorter-term scalping methods of trading and investing, updating on a per-candle basis.
Along with this, the ‘Retail Stablecoin Demand’ looks into the current demand for a number of Crypto stablecoins, aiming to mimic an underlying value close to that of traditional fiat currencies like the US Dollar. This is calculated by analyzing the short to mid-term rush to these ‘safer’ assets by retail traders. Traditionally people will exit their positions in favor of stable assets when they are either currently or are expecting to experience losses. Conversely, when users foresee upcoming profits they are likely to transition into a more ‘risk-on’ thesis and exit their stablecoins for more speculative assets. A value of 100 represents a huge demand for stablecoins, whereas a value of -100 shows that there is currently a lack of interest. Another indication providing a chance to profitably play the contrarian, with figures constantly updating to provide the functionality to all regardless of your trading methodology or investment philosophy.
Lastly the ‘Whale Bubbles’, display overlaying circles of varying size and opacity to represent on-chain activity by larger market players who are transferring a portion of their substantial holding, usually to exchanges to sell. These bubbles are placed over price action to clearly see the point at which the transaction occurred. We can also lower the minimum requirement of what is defined as a ‘whale movement’ by increasing the sensitivity within the indicator settings and subsequently increasing signal frequency. When whales begin to sell in numbers, it may be worth considering doing the same yourself!
We hope you can find utility in all of these indicators, and that in unison they can take your trading and investment to the next level. A majority of these indicators within the bundle can be tweaked and optimized within the bundle to further fine-tune and cater to your preferred trading and investing thesis. Check out our other resources and let us know what you’d like to see next!

Trendmaster - Crypto Social Sentiment OscillatorWhat it is:
The Crypto Social Sentiment Oscillator looks at several social metrics for both Bitcoin and Ethereum more deeply than a simple Fear and Greed Indicator,
to produce a general market sentiment for cryptocurrency.
What it does:
Social Sentiment tries to gain insight into the current retail opinion and mindset on the Crypto sector.
Analyzing multiple social networks and the positive/negative posts and engagement throughout,
we can establish a broad overview of the underlying emotion in reaction and anticipation of price movement.
How to use it:
A value of 100 can indicate extreme market greed, with 0 indicating extreme fear.
Generally, the more Greedy a market is, the more it is punished to the downside.
The more Fearful a market is, the more it is surprised by the upside.

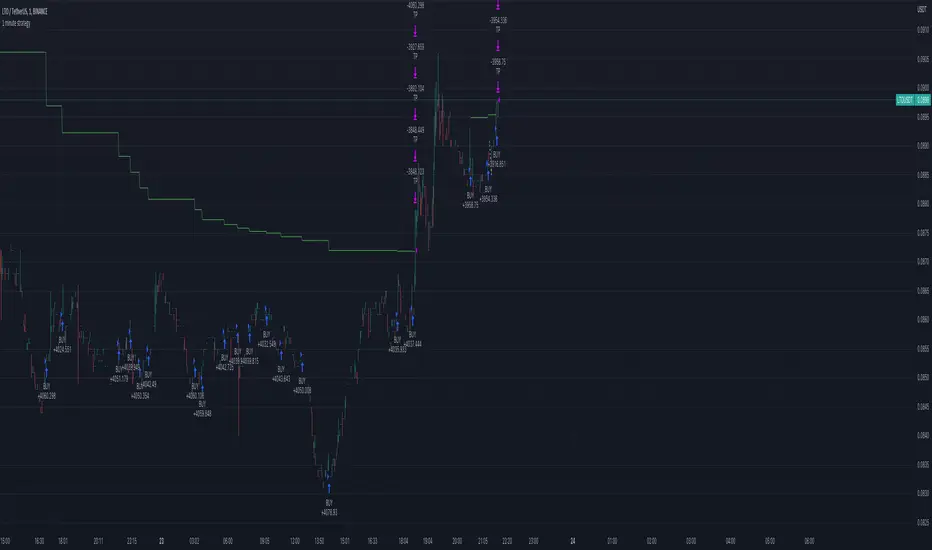
1 minute crypto strategy (MTF ZigZag)Please read the following explanation and notes before using this strategy.
This strategy is based on pyramiding. It uses two trend indicators(zigzag) in two different timeframes. One can be used to identify trend in higher timeframe and the other can be used to identify trend in smaller time frame. You can change them according to your preference. The default timeframes are set the same so the strategy only opens the trades according to one timeframe (20min). You can change the timeframe of the trend indicators to any timeframe in the settings but first you should add that timeframe to your chart timeframe so you can see that timeframe in the settings.
The first timeframe is for lower timeframe trend identification and the second timeframe is for higher timeframe identification in the settings.
IMPORTANT NOTES:
1. This strategy works best with low cap high volatile Cryptos. It is riskier on big cap cryptos in long term since it takes longer for them to recover from a big drop.
2. This strategy works in any timeframe. The lower the TF the higher profit.
3. This strategy is LONG only (spot).
4. It is very important to run a deep backtest (for example 1 year) and change the settings accordingly on the cryptos you want to trade to see how it performs in longterm.
5. The default pyramiding value is 30 and 3.33% of the portfolio (100/30=3.33%) is used for each trade. It means the strategy opens maximum 30 trades before the TP is hit. If you change the pyramiding you should also change order size as well in order for the strategy to show the exact calculation (your portfolio amount percentage/pyramiding value=ordersize percentage). If you increase pyramiding value the strategy performs safer in long term.
6. The default TP is 1% and the default SL is 80%. You can change the settings according to the backtest on the coins you want to trade. But it is better not to increase the TP.
7. The indicators don't repaint.
8. Please make sure to backtest and fully understand the way this strategy works before using it.
Coin Prediction Filter - Free Cryptohopper WidgetWelcome to our Tradingview coin prediction filter.
We designed this script to give Cryptohopper users a possibility to decide which coins they want to trade. Because a basic rule says that you should never go against the trend. You can take the code and adjust it to your prefered trading pairs.
Smartgrow-Trading is a community project with the aim of developing the best and most successful trading strategies and sharing them with the community.
The basic idea of this script is to use a higher timeframe trend indicator and apply it on the top 40 coins. We recommend to use it within the 2h candles, but of cause you can use it in other timeframes as well. As result you receive a list of coins for the use within cryptohopper. Because, never trade against the trend.
If there are questions, write them into the comments or contact us directly over the direct message or social media. Happy Trading!

Hopper Trigger - Free Cryptohopper WidgetWelcome to our Tradingview cryptohopper trigger widget.
We designed this script to give Cryptohopper users the possibility to set up an alarm when btc is trending down. Cause of the BTCs behavior as the supertrend coin for the market it is better to turn your hopper off or be extremly careful when BTC is trending down. We implemented to types of alarms, because atm its not possible to automate using them to deactivate your hopper. On Alarm setup could be used to send signals every minute to trigger a push notification on your App or to trigger your Alexa. The other type of alarm only sends one single signal for normal purposes.
We recommend using this indicator in the 30 minute or 1 hour timeframe and to deactivate your hopper and deleting all positions when a alarm is signaling. The risk of a larger drop is very high in this marketphase. Never take an drop again using this approach. Little drawdown in bearish or ranging times but high reward in bullish times.
Smartgrow-Trading is a community project with the aim of developing the best and most successful trading strategies and sharing them with the community.
The basic idea of this script is to calculate how far an coin is away from its ATH , to gave warning signals for deactivating coins after they reached there ATH . So it could also be used for other coins and pairs.
If there are questions, write them into the comments or contact us directly over the direct message or social media. Happy Trading!

Zeta CryptoAre you excited about Crypto Trading?
Crypto Trading is gaining immense popularity due to the excitement and returns it gives.
However, traditional indicators based upon lagging factors which generate Buy/Sell signals very late can not be used with crypto-trading.
The need of the hour is to create an indicator from ground up which reacts instantly when the price action starts and gives you much earlier entry or exit as compared to traditional lagging indicators.
Zeta Crypto is one such indicator which is based upon price cum volume action. It is said that "volume precedes price" or 'volume must validate the price move" and it is true in most of the situations.
Zeta Crypto tracks price and volume for you and keeps comparing it with historical data and as soon as it detects spikes, it gets into action and generates Buy/Sell signals right on your chart.
How to take Entry and When to Exit?
As soon as you see a Buy/Sell Signal on a candle, mark its closing price and if next or any subsequent candle opens and starts going in the same direction and clears the closing price of signal candle (where Buy/Sell signal is printed), Enter the trade and trail it till either (1) Opposite signal does not come or (2) Your Trailing Stop Loss is hit or (3) Till price again comes back to your Entry Level and starts hurting your position.
What Time Frame to use?
Do not use less than 5 min. Time Frame for this indicator. The best results are seen at 5 min., 10 min. 15 min. & 30 min. time frames. Higher time frames will give you delayed entry and lower than 5 min. will be too volatile.
What is the purpose of Support/Resistance Lines appearing on your chart?
These lines might offer you early entry or exit when the price approaches a Resistance or Support line.

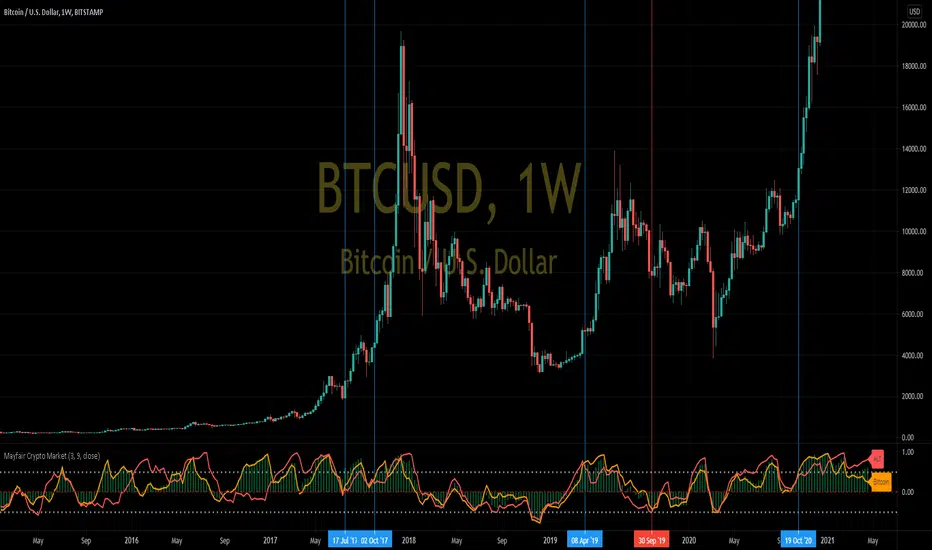
Mayfair Crypto Market 1.0In this indicator, we compare the market capitalisation of Bitcoin(in gold colour) with the market cap of all the other cryptocurrencies (in red), and the market cap of the whole cryptocoin market (the green histogram).
As you may be able to see, when Bitcoin (gold colour) crosses over the Others (red colour) in the indicator, it signifies a swing in popularity towards Bitcoin, and it appears to have predicted some of the recent large rallies (blue Vertical lines) and pull-backs (red vertical lines)
Like all indicators, it is not perfect, and you should never rely on one indicator in any situation.
Heikin Ashi + Price Action Crypto LONG StrategyThis is a simple and efficient crypto strategy, designed for big timeframes like 12/24h.
On history it beats buy and hold strategy in many ocasions, and because of a low DD, pyramid can be used to elevate our winnings while still keeping a low DD < 40% avg.
For the purpose of this example, I used 100% of the capital on each trades, together with a comission of 0.1%
Warning : THERE IS NO STOP LOSS ON THIS STRATEGY ,USE IT AT YOUR OWN RISK
This strategy is made with inside Heikin Ashi candles , together with some price actions logics like for long Close > High and green candle and High > High .
We exit when we have a red candle and the current close is lower than the previous Low
If you have any questions, message me in private !

The MATRIX: Ultimate Crypto Position Strategy (Alert Version)Welcome back everyone,
It's been a while since our last post. In recent months we have worked on all kinds of projects, but more on that later. In the meantime, we also received a lot of positive feedback about our original 'The MATRIX: Ultimate Crypto Position Strategy' script.
One of the many requests was whether we could release an alert version.
However, since Pinescript does not provide the alert functionality in a strategy type script, it had to be converted to a study type script. Besides that, we have also added a stop-loss functionality. This release has the same internal algorithm as the original 'The MATRIX: Ultimate Crypto Position Strategy' script. But instead of showing back test results, this script provides the functionality to add alerts that can notify the user via email / pop-up / sms / app once a signal is given! You must manually add these alerts via TradingView. If you need help setting up these alerts, feel free to ask in the comment box or send us a dm.
***The script is invite-only, message us to get script access***
-------------------------------------------------------------------------------------------------
The MATRIX: Ultimate Crypto Position Strategy should be used as follows:
• The trading strategy was designed and optimized for trading cryptocurrencies only ; furthermore it works best on established high market cap cryptocurrencies that have a clear trend such as:
BTCUSD
ETHUSD
LTCUSD
XRMUSD
EOSUSD
ADAUSD
DASHUSD
ETCUSD
• The trading strategy is based on swing/position methodology. The script must therefore be used on daily timeframe candles only (1D).
• Use USD trading pairs only (e.g. use ETHUSD instead of the ETHBTC) since the individual trend is captured more effectively and therefore gives better results.
-------------------------------------------------------------------------------------------------
The MATRIX:Ultimate Crypto Position Strategy is based on the following indicators:
• Ichimoku Cloud ; acts as the leading indicator.
• Volume ; without strong volume , a market move is not valid.
• MACD and Vortex ; both being used as confirmation indicators.
• Choppiness index ; avoids trading in choppy markets.
• Bullish/ Bearish Regular Divergences in combination with RSI to spot tops and bottoms.
• Simple and Exponential Moving Averages ; prêvents trading against the trend.
The trading strategy is easy to use, trend based and without repainting, meaning once a signal has been made it is permanent and that no future data is used in the decision making. It detects the trend and filters out market noise based on more than 10 technical indicators. ONLY when all indicators align with each other the algorithm prints a BUY or SELL signal. The trading strategy provides high probability trading signals and minimizes risk! This script aims to capture the profit from longer term trending moves and by doing so filters out non-substantial trends and avoids the associated risks with these trades.
-------------------------------------------------------------------------------------------------
The MATRIX: Ultimate Crypto Position Strategy has the following features:
• ALERTS can be enabled which can notify the user through email/popup/app once a signal is given.
• Automatically generated Buy / Sell alerts in the form of a label.
• NO Repaint once candle is closed.
• SAFEGUARD ; custom built-in security prevẹnts trading when the price is out of equilibrium.
• Customizable Display for the Ichimoku cloud indicator display.
-------------------------------------------------------------------------------------------------
Reminder: Use this trading strategy at your own risk and trade responsibly. We are not responsible for any financial loss using this strategy.
***The script is invite-only, message us to get script access***

Cracking Cryptocurrency - Exponential Moving AveragesCracking Cryptocurrency - Exponential Moving Averages
This is the preferred EMA Indicator of Cracking Cryptocurrency Traders. We have based our statistical levels of support and resistance , trend, and momentum utilizing Fibonacci Numbers for our EMA inputs.
This script utilizes the Key Numbers of 8, 13, 21, 55, 100, and 200 as we have found those to work the best for Bitcoin and other Cryptocurrencies.
Features and Functions
Multi-Time Frame Function
Multiple Source Rendering
Multiple Smoothing Options
Adjust Look back Length
Plot Custom Signals
Multiple Time Frame Feature
Do you want to watch the EMA's of a higher or lower time frame while analyzing the price action of a different time frame? With this indicator, it's quite easy! Just select the desired Time Frame to display your EMA's and they will automatically change without affecting the price action you're currently looking at, or having to change your Time Frame Resolution. This has been upgraded and simplified with a drop-down menu for selecting your desired Time Frame.
Plot Crossovers
Want to keep it simple? Select Plot Crossovers and this script will display optimum times to buy and sell based on Trending Momentum utilizing your selected EMA crosses. Highly effective, back-test it and see!

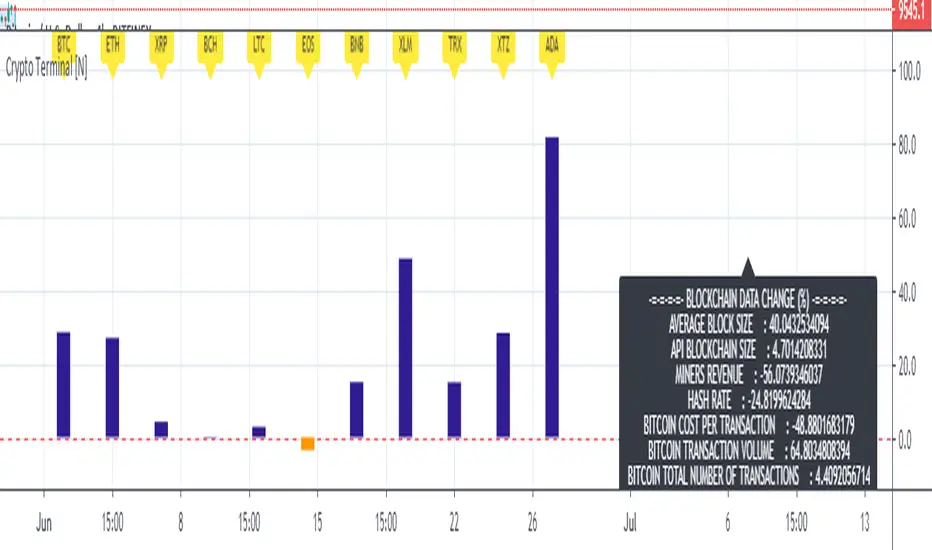
Basic Cryptocurrency TerminalHello,
This script is a simple Cryptocurrency Terminal.
It serves the same purpose as Heatmaps.
You can also set the period to look back manually in the menu.
Major Cryptocurrencies are taken into account.
And various Blockchain data are shown in the information panel.
In this way, an idea can be obtained about Cryptocurrency Market.
It is visually more convenient and clear to use in an indicator window under the chart, not on the chart, as follows:
Regards.
The MATRIX: Ultimate Crypto Position StrategyHi all,
We are cryptocurrency miners and 'hodlers’ since 2013, with unwavering confidence in the technology behind it. We’d always thought that it would be a life-changing êvent. And we were right. We went from “broke” to making shit loads of money and all the way back to bitter nothing. If you are lucky, you probably haven’t experienced what if feels to be high on cash and then fall very deep low, but let me reassure you, it is a nasty feeling.
Then we wondered, what the hell did we do wrong? Or better say, what didn’t we do right! The answer was dead simple: We had no experience in trading, we were overwhelmed by emotions and we didn't use any trading strategy. Hence, we were doomed to fail from the beginning.
In order to build an all-in-one profitable trading strategy, we had to start from zero. The one thing we learned is that your goal for financial gain cannot be achieved without discipline and consistency. Our prime focus was to absorb as much info as possible regarding trading and coding by doing an extensive self-study, which consequentially took us to the next level.
One of the secrets to being successful from a trading perspective is to have an indefatigable and undying thirst for information and knowledge. As Bruce Lee once said: “Learning is never cumulative; it is a movement of knowing which has no beginning nor end”. So, we adapted what was useful, rejected what was useless, and added our own preferences based on our mindset. We were totally committed to be the best. Our goal was never to lose money again! Of course, this is an illusion, as no single strategy is correct all of the time.
Therefore, the final trading strategy was based on the following key elements:
• The avoidance of risk is more important than absolute profit. Do not anticipate and do not move without market confirmation. Being a little late in your trade is your indication if you are right or wrong.
• Offering simplicity and practicality, for those that do not have the time to trade 24/7.
• Believe in analysis and not in forecasting. Trading is a skill for those who are smart and gambling for those who are not.
In conclusion, we are absolutely thrilled to finally release this trading strategy after one year of extensive back testing and optimization. The script was supposed to be for personal use only, but because Tradingview has helped us a lot in this process, we want to share it with all of you and give something back to this amazing community. If you learned something new today and found value, please give us a like to show your support! We’d really appreciate it.
***The script is invite-only, message us to get script access***
-------------------------------------------------------------------------------------------------
The MATRIX: Ultimate Crypto Position Strategy should be used as follows:
• The trading strategy was designed and optimized for trading cryptocurrencies only ; furthermore it works best on established high market cap cryptocurrencies that have a clear trend such as:
BTCUSD
ETHUSD
LTCUSD
XRMUSD
EOSUSD
ADAUSD
DASHUSD
ETCUSD
• The trading strategy is based on swing/position methodology. The script must therefore be used on daily timeframe candles only (1D) .
• Use USD trading pairs only (e.g. use ETHUSD instead of the ETHBTC) since the individual trend is captured more effectively and therefore gives better results.
-------------------------------------------------------------------------------------------------
The MATRIX:Ultimate Crypto Position Strategy is based on the following indicators:
• Ichimoku Cloud ; acts as the leading indicator.
• Volume ; without strong volume , a market move is not valid.
• MACD and Vortex ; both being used as confirmation indicators.
• Choppiness index ; avoids trading in choppy markets.
• Bullish/ Bearish Regular Divergences in combination with RSI to spot tops and bottoms.
• Simple and Exponential Moving Averages ; prêvents trading against the trend.
The trading strategy is easy to use, trend based and without repainting, meaning once a signal has been made it is permanent and that no future data is used in the decision making. It detects the trend and filters out market noise based on more than 10 technical indicators. ONLY when all indicators align with each other the algorithm prints a BUY or SELL signal. The trading strategy provides high probability trading signals and minimizes risk! This script aims to capture the profit from longer term trending moves and by doing so filters out non-substantial trends and avoids the associated risks with these trades.
-------------------------------------------------------------------------------------------------
The MATRIX: Ultimate Crypto Position Strategy has the following features:
• Automatically generated Buy / Sell alerts in the form of a label.
• NO Repaint once candle is closed.
• SAFEGUARD ; custom built-in security prevẹnts trading when the price is out of equilibrium.
• Customizable Display for the Ichimoku cloud indicator display.
-------------------------------------------------------------------------------------------------
Below are the backtest results. Keep in mind that this strategy is quite conservative resulting in few long positions. These results are therefore no guarantee for the future.
Back test results: (only Long trades, signal to signal, order size: 100% of equity, commision fee 0.1%, period: start of chart)
Exchange-----Asset---------Timeframe---Percent Profitable----Profit Factor-----Total Trades----Max Drawdown---Average bars in trade-----Net Profit
Coinbase-----BTC/USD---------1D----------------100----------------N/A------------------10---------------0.00---------------------54-------------------6183.6
Coinbase-----ETH/USD---------1D----------------100----------------N/A------------------7----------------0.00---------------------46-------------------11673.0
Coinbase-----LTC/USD---------1D-----------------100---------------N/A-------------------7----------------0.00---------------------46------------------4727.0
Bínance------EOS/USD---------1D-----------------100---------------N/A-------------------3----------------0.00---------------------34------------------42.8
Bínance------ADA/USD---------1D-----------------100---------------N/A-------------------2----------------0.00---------------------40------------------118.4
Coinbase-----XTZ/USD---------1D-----------------100---------------N/A-------------------1----------------0.00---------------------36------------------34.4
Bínance------BNB/USD---------1D-----------------66.7--------------10.8-------------------6---------------24.22--------------------38------------------1488.8
Bínance------ETC/USD---------1D-----------------100---------------N/A-------------------2----------------0.00---------------------33------------------94.9
Bínance------XMR/USD---------1D-----------------100---------------N/A-------------------3----------------0.00---------------------43------------------74.2
Bínance------ICX/USD----------1D-----------------100---------------N/A-------------------2----------------0.00---------------------29------------------215.3
-------------------------------------------------------------------------------------------------
Reminder: Use this trading strategy at your own risk and trade responsibly. We are not responsible for any financial loss using this strategy.
***The script is invite-only, message us to get script access***

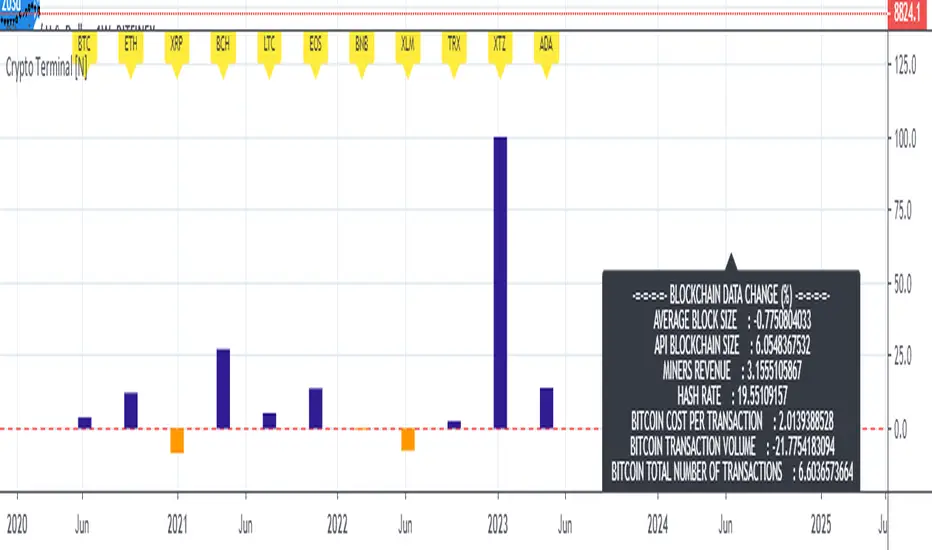
Live Mini Terminal 7 : Major Cryptocurrencies Change DataThis script displays relative data changes occurring in the adjustable period and/or adaptive automatic period in U.S Dollar based Major Cryptocurrencies.
This script was inspired by the data terminals used by commercial traders.
Period selection can be set in the menu.
This script uses the adaptive period algorithm used by Autonomous LSTM and Relativity scripts.
Or you can set the period manually from the menu.
For more information about adaptive period:
This script works only for 1 day (1D) and 1 week (1W) time frames.
Since usage of Blockchain Data, the most efficient time frame is 1 week (1W) .
Features
Value changes on a percentage basis (%)
The Info Panel contains percentage-based blockchain data changes.
CRYPTOCURRENCIES
BTC : Bitcoin
ETH : Ethereum
XRP : Ripple
BCH : Bitcoin Cash
LTC : Litecoin
EOS : EOS
BNB : Binance Coin
XLM : Stellar
TRX : Tron
XTZ : Tezos
ADA : Cardano
INFO PANEL
Average Blockchain Size change data
API Blockchain Size change data
Miners Revenue change data
Hash Rate change data
Bitcoin Cost Per Transaction change data
Bitcoin Transaction Volume change data
Bitcoin Total Number of Transactions change data
USAGE
The script can be used as an indicator by putting it under the chart as shown above.
It is necessary to enlarge to see clearly.
Since it is not often looked at,
such use is the best method for healthy interpretation.
Best regards.
PerPro Crypto ScalperPerPro Crypto Scalper es un algoritmo que funciona con 4 robot internos que trabajan sincronisadamente para enviar una senal de trading.
Según el crypto que se desee tradear es la configuración que le debemos colocar en trailing stop y take profit.
PerPro Crypto Scalper (CS) is an algorithm system with
with 4 internal robots that work synchronously to send you a trading signal.
Depending on the type of crypto you want to trade, it is the setting that must be configured. that I sent it by private message

Coinmarketcap - Live CryptoMarketCap TOP 20Hello everyone,
I hope you are fine.
Today an other important indicator : the TOP 20 crypto market cap !
It's better if you use it on BTC/USD to have more historical data.
Next cryptocurrencies have been used for this indicator :
BTC
ETH
XRP
EOS
BCH
LTC
USDT
TRX
XLM
BSV
ADA
BNB
XMR
IOTA
DASH
NEO
ETC
XEM
USDC
ZEC
Thank you and have a good day :)
