KIMATIX Silver Bullet 2.0KIMATIX Silver Bullet 2.0 is a precision-based intraday trading tool built around the most reliable market behaviors during the ICT Silver Bullet windows.
The indicator automatically identifies high-probability price delivery zones by combining time-based session logic, displacement, fair value gaps, and liquidity dynamics — without clutter or subjective interpretation.
What the indicator does
Automatically marks the three core Silver Bullet windows (New York time)
Tracks session highs and lows to define contextual liquidity
Detects displacement moves using adaptive volatility logic
Highlights valid Silver Bullet Fair Value Gaps (FVGs) only when structural conditions are met
Filters weak setups by minimum size, age, and directional confirmation
Projects FVG zones forward to monitor clean retracements
Plots liquidity levels (highs & lows) with optional mitigation handling
All calculations are done fully automatically — no manual drawing, no guessing.
Designed for
Scalper and Intraday traders (especially 1–5 minute charts)
Futures, indices, forex, and crypto
Traders who want clear execution zones, not lagging signals
Anyone using liquidity-based or ICT-style frameworks
Key advantages
No signals, no repainting logic — context first
Strict filtering to reduce noise and over-marking
Clean visual layout focused on price delivery
Works seamlessly alongside higher-timeframe bias and volume tools
This indicator does not tell you when to trade —
it shows you where the market is most likely to react.
Important note
KIMATIX Silver Bullet 2.0 is a context and execution tool, not a standalone strategy.
Best results are achieved when combined with proper risk management and directional bias.
More Infos and Premium Indicators: kimatixtrading.com
Search in scripts for "gaps"

Volume Profile VisionVolume Profile Vision - Complete Description
Overview
Volume Profile Vision (VPV) is an advanced volume profile indicator that visualizes where trading activity has occurred at different price levels over a specified time period. Unlike traditional volume indicators that show volume over time, this indicator displays volume distribution across price levels, helping traders identify key support/resistance zones, fair value areas, and potential reversal points.
What Makes This Indicator Original
Volume Profile Vision introduces several unique features not found in standard volume profile tools:
Dual-Direction Histogram Display:
Unlike conventional volume profiles that only show bars extending in one direction, VPV displays volume bars extending both left (into historical candles) and right (as a traditional histogram). This bi-directional approach allows traders to see exactly where historical price action intersected with high-volume nodes.
Real-Time Candle Highlighting: The indicator dynamically highlights volume bars that intersect with the current candle's price range, making it immediately obvious which volume levels are currently in play.
Four Professional Color Schemes: Each color scheme uses distinct gradient algorithms and visual encoding systems:
Traffic Light: Uses red (POC), green (VA boundaries), yellow (HVN), with grayscale gradients outside the value area
Aurora Glass: Modern cyan-to-magenta gradient with hot magenta POC highlighting
Obsidian Precision: Professional dark theme with white POC and electric cyan accents
Black Ice: Monochromatic cyan family with graduated intensity
Adaptive Transparency System: Automatically adjusts bar transparency based on position relative to value area, with special handling for each color scheme to maintain visual clarity.
Core Concepts & Calculations
Volume Distribution Analysis
The indicator divides the visible price range into user-defined price levels (default: 80 levels) and calculates the total volume traded at each level by:
Scanning back through the specified lookback period (customizable or visible range)
For each historical bar, determining which price levels the bar's high/low range intersects
Accumulating volume for each intersected price level
Optionally filtering by bullish/bearish volume only
Point of Control (POC)
The POC is the price level with the highest traded volume during the analyzed period. This represents the "fairest" price where most traders agreed on value. The indicator marks this with distinct coloring (red in Traffic Light, magenta in Aurora Glass, white in Obsidian Precision, cyan in Black Ice).
Trading Significance: POC acts as a strong magnet for price - markets tend to return to fair value. When price is away from POC, traders watch for:
Mean reversion opportunities when price is far from POC
Rejection signals when price tests POC from above/below
Breakout confirmation when price breaks through and holds beyond POC
Value Area (VA)
The Value Area encompasses the price range where a specified percentage (default: 68%) of all volume traded. This represents the range of "accepted value" by market participants.
Calculation Method:
Start at the POC (highest volume level)
Expand upward and downward, adding adjacent price levels
Always add the level with higher volume next
Continue until accumulated volume reaches the VA percentage threshold
Value Area High (VAH): Upper boundary of accepted value - acts as resistance
Value Area Low (VAL): Lower boundary of accepted value - acts as support
Trading Significance:
Price spending time inside VA indicates market equilibrium
Breakouts above VAH suggest bullish momentum shift
Breakdowns below VAL suggest bearish momentum shift
Returns to VA boundaries often provide high-probability entry zones
High Volume Nodes (HVN)
Price levels with volume exceeding a threshold percentage (default: 80%) of POC volume. These represent areas of strong agreement and consolidation.
Trading Significance:
HVNs act as strong support/resistance zones
Price tends to consolidate at HVNs before making directional moves
Breaking through an HVN often signals strong momentum
Low Volume Nodes (LVN)
Price levels within the Value Area with volume ≤30% of POC volume. These are zones price moved through quickly with minimal consolidation.
Trading Significance:
LVNs represent areas of rejection - price finds little acceptance
Price tends to move rapidly through LVN zones
Useful for setting stop-losses (below LVN for longs, above for shorts)
Can identify potential gaps or "air pockets" in the market structure
Grayscale POC Detection
A secondary POC detection system identifies the highest volume level outside the Value Area (with a 2-level buffer to avoid confusion). This helps identify significant volume accumulation zones that exist beyond the main value area.
How to Use This Indicator
Setup
Choose Lookback Period:
Enable "Use Visible Range" to analyze only what's on your chart
Or set "Fixed Range Lookback Depth" (default: 200 bars) for consistent analysis
Adjust Profile Resolution:
"Number of Price Levels" (default: 80) - higher = more granular analysis, lower = broader zones
Select Color Scheme:
Traffic Light: Best for clear POC/VA/HVN identification
Aurora Glass: Modern aesthetic for dark charts
Obsidian Precision: Professional trader preference
Black Ice: Minimalist single-color family
Visual Customization
Left Extension: How far back the left-side histogram extends into historical candles (default: 490 bars)
Right Extension: Width of the traditional histogram bars on the right (default: 50 bars)
Right Margin: Space between current price bar and histogram (default: 0 for flush alignment)
Left Profile Gap: Space between left-side histogram and candles (default: 0)
Trading Strategies
Strategy 1: Value Area Mean Reversion
Wait for price to move outside the Value Area (above VAH or below VAL)
Look for rejection signals (wicks, bearish/bullish candles)
Enter trades toward the POC
Take profits as price returns to POC or opposite VA boundary
Strategy 2: Breakout Confirmation
Identify when price is consolidating within the Value Area
Wait for a strong close above VAH (bullish) or below VAL (bearish)
Enter on the breakout or on first pullback to the VA boundary
Target previous HVNs or swing highs/lows outside the VA
Strategy 3: POC Support/Resistance
Watch for price approaching the POC level
If approaching from below, look for bullish reversal patterns at POC (support)
If approaching from above, look for bearish reversal patterns at POC (resistance)
Trade in the direction of the bounce with stops beyond the POC
Strategy 4: LVN Fast Movement Zones
Identify LVN zones within the Value Area (marked with "LVN" label)
When price enters an LVN, expect rapid movement through the zone
Avoid entering trades within LVNs
Use LVNs as confirmation of directional momentum
Alert System
The indicator includes 7 customizable alert conditions:
POC Touch: Alerts when price comes within 0.5 ATR of POC
VAH/VAL Touch: Alerts at Value Area boundaries
VA Breakout: Alerts on breakouts above VAH or below VAL
HVN Touch: Alerts when price contacts High Volume Nodes
LVN Entry: Alerts when entering Low Volume zones
POC Shift: Alerts when POC moves to a new price level
Reading the Profile
Price Labels (shown on the right side):
POC: Point of Control - highest volume price level
VAH: Value Area High - upper boundary of accepted value
VAL: Value Area Low - lower boundary of accepted value
LVN: Low Volume Node - expect fast movement through this zone
Color Intensity Interpretation:
Brighter colors = higher volume concentration
Dimmer colors = lower volume
Abrupt color changes = transition between volume zones
Gaps in the histogram = price levels with no trading activity
Technical Details
Volume Accumulation Logic:
For each bar in lookback period:
For each price level:
If bar's high/low range intersects price level:
Add bar's volume to that price level's total
Gradient Algorithm:
Traffic Light: Dual-range piecewise gradient (0-50% and 50-100% volume intensity)
Aurora Glass: Linear cyan-to-magenta interpolation
Obsidian Precision: Dark blue gradient with cyan highlights
Black Ice: Three-stage cyan intensity progression
Real-Time Updates:
The profile recalculates on every bar, including real-time tick data, ensuring the volume distribution always reflects current market structure.
Best Practices
Timeframe Selection: Use higher timeframes (4H, Daily) for swing trading, lower timeframes (5min, 15min) for day trading
Combine with Price Action: Volume profile shows WHERE, price action shows WHEN
Multiple Timeframe Analysis: Check daily VP for major levels, then drill down to intraday for entries
Volume Type Selection: Use "Bullish" volume in uptrends, "Bearish" in downtrends, or "Both" for complete picture
Adjust VA Percentage: 68% (default) captures one standard deviation; try 70% for tighter or 60% for broader value areas
Performance Notes
Maximum bars back: 5000 (handles deep historical analysis)
Maximum boxes: 500 (handles complex profiles)
Optimized calculation: Only recalculates on last bar for efficiency
Real-time capable: Updates as new ticks arrive

FVG Theory - MTFThe indicator displays FVGs and Swings from different timeframes and marks the resistance!
Components:
Swings:
A swing is a 3-candle formation based on the Williams Fractal Indicator.
The interaction with the last swing is always displayed as a red line. This allows you to recognize the last interaction directly and draw conclusions about the further course of the price (sweep / break).
In addition, the closest fractal is always shown as a green line, which acts as a potential target.
2. FVGs:
FVGs are also known as Inbalance, it is a 3 candle formation where a gap is created in the market. The market often runs into this and reacts.
Theory:
When the weekly timeframe creates an bullish FVG, the market often reacts to it and reaches the high.
However, resistance must also be taken into account: this is the FVG that has not yet been reached and is in a higher timeframe than the entry.
For example: we have a weekly FVG as context and are trading in H4.
If an open daily FVG is against us in this way, it is marked as resistance.
The market must first react to this in H4 and break this resistance high for a good trade setup!
That is why the indicator shows the FVGs from the different timeframes, displaying the last reaction as well as the closest FVG that is still open.
The same applies if you take everything one timeframe lower: e.g. daily, H4 and H1.
You can easily set the different timeframes in the indicator.
Here we have a daily context, an H4 resistance (FVG against us) and the H1 structure!
Higher FVG are stronger!
If, for example, we follow the H4 FVG and a daily FVG forms below us, it is more likely that the market will take the larger FVG. This is always shown with the indicator!
Structure:
Overlaps are drawn when the new FVG overlaps with the structure (body or wick).
The FVG has differnt codes!
FVG codes:
↑ = bullish FVG
↓ = bearish FVG
↑↑ = breakaway gaps --> close of the third candle is above the second candle
↓↓ = breakaway gaps --> close of the third candle is below the second candle
❗ = 3rd candle of the FVG has already reacted deeply into the potential FVG!
🔪 = Sharp Turn --> FVG is taken out from the new FVG in the other direction!
🔥 = Order flow (reaction from previous FVG)
🚀 = 2CR --> reaction high/low from previous FVG is run down with FVG!
Indicator settings:
You can set the FVGs, overlaps, and swings in up to 4 different timeframes. You can switch these on and off, as well as change all colours!
The highest timeframe has the additional function of displaying the context (last fractal high and low from the current FVG).

Sessioni Orarie IT + Weekend + Alerts# 📋 DESCRIZIONE ITALIANO
---
# 🇮🇹 Sessioni Orarie Italiane + Weekend + Alert
## 📊 Descrizione
Questo indicatore è stato progettato specificamente per i trader italiani che necessitano di visualizzare orari chiave durante la sessione di trading, identificare i periodi di weekend e **ricevere notifiche automatiche** ai cambi di sessione.
Lo script traccia automaticamente **linee verticali infinite** ai seguenti orari italiani:
- **15:30** - Apertura mercato USA (New York)
- **18:30** - Fine sessione europea / Mid-session USA
Inoltre, evidenzia visualmente tutto il **periodo di weekend** (da Venerdì 20:00 a Domenica 23:00) con uno sfondo colorato personalizzabile.
**🔔 NOVITÀ: Sistema di Alert completo** per non perdere mai l'apertura/chiusura delle sessioni chiave!
---
## ✨ Caratteristiche Principali
### 🕐 Linee Orarie Automatiche
- **15:30 IT** - Linea verticale all'apertura di Wall Street
- **18:30 IT** - Linea verticale di fine sessione europea
- Linee **infinite** che si estendono sopra e sotto il grafico
- Stile completamente **personalizzabile** (colore, larghezza, tipo di linea)
- **Auto-aggiornamento** con gestione automatica ora legale/solare (CET/CEST)
### 🌙 Evidenziazione Weekend
- Sfondo colorato nel periodo: **Venerdì 20:00 → Domenica 23:00**
- Aiuta a identificare rapidamente quando i mercati Forex/Crypto sono meno liquidi
- Colore e trasparenza **completamente personalizzabili**
### 🔔 Sistema Alert Avanzato
- **Alert automatici** per ogni cambio di sessione
- **5 tipi di alert configurabili**:
- 🇺🇸 Apertura New York (15:30 IT)
- 🇪🇺 Fine Sessione Europea (18:30 IT)
- 🌙 Inizio Weekend (Venerdì 20:00 IT)
- ☀️ Fine Weekend (Domenica 23:00 IT)
- ⚠️ Qualsiasi evento (alert combinato)
- **Multi-canale**: Notifiche push, email, popup, webhook
- **Messaggi personalizzati** con emoji e informazioni dettagliate
- **Switch individuale** per ogni tipo di alert
### ⚙️ Caratteristiche Tecniche
- ✅ Funziona su **tutti i timeframe** (da 1 minuto a mensile)
- ✅ Compatibile con **tutti gli strumenti** (Forex, Crypto, Azioni, Indici, Commodities)
- ✅ Fuso orario **Europe/Rome** integrato
- ✅ Gestione automatica DST (Daylight Saving Time)
- ✅ Codice ottimizzato in **Pine Script v6**
- ✅ Label opzionali per identificare gli orari
- ✅ **Alert frequency**: once_per_bar (evita spam di notifiche)
---
## 🎨 Impostazioni Personalizzabili
### Stile Visivo
1. **Colore Linee Orarie** - Scegli il colore che preferisci
2. **Larghezza Linee** - Da 1 a 5 pixel
3. **Stile Linee** - Solid (continua), Dashed (tratteggiata), Dotted (puntinata)
4. **Colore Weekend** - Sfondo personalizzabile con trasparenza
### Alert Settings
1. **Abilita Alert** - Switch master per attivare/disattivare tutti gli alert
2. **Alert ore 15:30** - Notifica apertura New York
3. **Alert ore 18:30** - Notifica fine sessione europea
4. **Alert Inizio Weekend** - Notifica chiusura mercati (Ven 20:00)
5. **Alert Fine Weekend** - Notifica riapertura mercati (Dom 23:00)
---
## 📖 Come Utilizzarlo
### Installazione Base
1. Aggiungi l'indicatore al tuo grafico
2. Le linee appariranno automaticamente alle 15:30 e 18:30 (ora italiana)
3. Il weekend sarà evidenziato con uno sfondo colorato
4. Personalizza colori e stili dalle impostazioni (icona ingranaggio)
### Attivazione Alert
#### Metodo 1: Alert Automatici (Consigliato - Più Semplice)
1. Vai in **Impostazioni** dell'indicatore (icona ingranaggio)
2. Sezione **Alert Settings**
3. Spunta gli alert che vuoi ricevere
4. Gli alert si attivano automaticamente!
#### Metodo 2: Alert Personalizzati (Avanzato)
1. Clicca sul pulsante **⏰ Alert** in alto a destra
2. Seleziona **Condizione** → Nome dell'indicatore
3. Scegli il tipo di alert:
- Apertura NY (15:30)
- Fine EU (18:30)
- Inizio Weekend
- Fine Weekend
- Qualsiasi Sessione
4. Configura le **opzioni di notifica**:
- 📱 Notifica App
- 📧 Email
- 🔊 Popup sonoro
- 🔗 Webhook URL
5. Clicca **Crea**
---
## 🔔 Messaggi Alert
Gli alert includono emoji e informazioni chiare:
**🇺🇸 15:30 IT - APERTURA NEW YORK**
```
Inizio sessione americana
Strumento:
```
**🇪🇺 18:30 IT - FINE SESSIONE EUROPEA**
```
Mid-session USA
Strumento:
```
**🌙 VENERDÌ 20:00 - INIZIO WEEKEND**
```
Mercati in chiusura
Riduzione liquidità prevista
```
**☀️ DOMENICA 23:00 - FINE WEEKEND**
```
Riapertura mercati imminente
Preparati per la nuova settimana
```
---
## 🎯 Ideale Per
- 📈 **Day Traders** che operano sulle sessioni USA/EU
- 🌍 **Forex Traders** che vogliono evidenziare il weekend
- 💹 **Scalpers** che necessitano di riferimenti orari precisi
- ⏰ **Swing Traders** che vogliono evitare gap del weekend
- 🇮🇹 **Trader Italiani** che usano il fuso orario locale
- 📱 **Mobile Traders** che vogliono notifiche push
---
## 💡 Perché Usare Questo Indicatore?
- **Risparmia tempo**: Non devi più calcolare manualmente gli orari con fusi diversi
- **Non perdere sessioni**: Alert automatici ti avvisano sempre
- **Chiarezza visiva**: Identifica immediatamente le sessioni chiave
- **Versatile**: Funziona su qualsiasi mercato e timeframe
- **Preciso**: Aggiornamento automatico con ora legale/solare
- **Multi-dispositivo**: Ricevi notifiche su mobile, desktop, email
---
## 📝 Note Importanti
- Le linee orarie vengono disegnate solo quando la candela corrisponde esattamente all'orario target
- L'evidenziazione weekend copre il periodo da Ven 20:00 a Dom 23:00 (ora italiana)
- Gli alert usano `alert.freq_once_per_bar` per evitare spam di notifiche
- Lo script è ottimizzato per non appesantire il grafico
- Gli alert funzionano anche quando il grafico non è aperto (se configurati correttamente)
---
## 🚀 Casi d'Uso
### Scenario 1: Day Trader Forex
- Attiva alert 15:30 per entrare sulle notizie USA
- Attiva alert 18:30 per chiudere posizioni EU
- Visualizza linee per identificare breakout agli orari chiave
### Scenario 2: Swing Trader
- Attiva alert weekend per chiudere posizioni prima del venerdì sera
- Evidenziazione weekend per evitare gap di apertura
- Alert domenica sera per preparare setup settimanali
### Scenario 3: Scalper Intraday
- Linee orarie come riferimento per volatilità
- Alert 15:30 per sfruttare l'aumento di volume NY
- Personalizza colori per non disturbare l'analisi tecnica
---
## 🔄 Aggiornamenti Futuri
Roadmap pianificata:
- Aggiunta sessione asiatica (Tokyo)
- Sessione londinese personalizzabile
- Statistiche volatilità per sessione
- Alert personalizzabili con messaggi custom
- Integrazione con Discord/Telegram
**Lascia un commento con le tue richieste!**
---
## ⭐ Ti è Piaciuto?
Se trovi utile questo indicatore:
- Lascia una ⭐ **stella**
- 💬 **Commenta** con feedback o richieste
- 🔄 **Condividilo** con altri trader
- 👤 **Seguimi** per altri script utili!
---
## 🏷️ Tags
`sessioni` `orari` `italia` `weekend` `alert` `notifiche` `fuso-orario` `CET` `CEST` `new-york` `forex` `day-trading` `scalping` `swing-trading` `utilità` `automazione`
---
**Versione**: 2.0 (Alert Update)
**Lingua**: Italiano / English
**Licenza**: Mozilla Public License 2.0
**Autore**:
---
**Buon Trading! 📊🇮🇹**
---
---
# 📋 ENGLISH DESCRIPTION
---
# 🌍 Italian Time Sessions + Weekend + Alerts
## 📊 Description
This indicator is specifically designed for traders who need to visualize key Italian time zones during trading sessions, identify weekend periods, and **receive automatic notifications** at session changes.
The script automatically draws **infinite vertical lines** at the following Italian times:
- **15:30 IT** - US Market Open (New York)
- **18:30 IT** - European Session Close / Mid US Session
Additionally, it visually highlights the entire **weekend period** (from Friday 20:00 to Sunday 23:00) with a customizable colored background.
**🔔 NEW: Complete Alert System** to never miss key session openings/closings!
---
## ✨ Main Features
### 🕐 Automatic Time Lines
- **15:30 IT** - Vertical line at Wall Street opening
- **18:30 IT** - Vertical line at European session close
- **Infinite lines** extending above and below the chart
- Fully **customizable** style (color, width, line type)
- **Auto-update** with automatic DST management (CET/CEST)
### 🌙 Weekend Highlighting
- Colored background during: **Friday 20:00 → Sunday 23:00**
- Helps quickly identify when Forex/Crypto markets are less liquid
- Color and transparency **fully customizable**
### 🔔 Advanced Alert System
- **Automatic alerts** for every session change
- **5 configurable alert types**:
- 🇺🇸 New York Open (15:30 IT)
- 🇪🇺 European Session Close (18:30 IT)
- 🌙 Weekend Start (Friday 20:00 IT)
- ☀️ Weekend End (Sunday 23:00 IT)
- ⚠️ Any Event (combined alert)
- **Multi-channel**: Push notifications, email, popup, webhook
- **Custom messages** with emojis and detailed information
- **Individual switch** for each alert type
### ⚙️ Technical Features
- ✅ Works on **all timeframes** (from 1 minute to monthly)
- ✅ Compatible with **all instruments** (Forex, Crypto, Stocks, Indices, Commodities)
- ✅ Integrated **Europe/Rome** timezone
- ✅ Automatic DST (Daylight Saving Time) management
- ✅ Optimized code in **Pine Script v6**
- ✅ Optional labels to identify times
- ✅ **Alert frequency**: once_per_bar (avoids notification spam)
---
## 🎨 Customizable Settings
### Visual Style
1. **Time Lines Color** - Choose your preferred color
2. **Lines Width** - From 1 to 5 pixels
3. **Lines Style** - Solid, Dashed, Dotted
4. **Weekend Color** - Customizable background with transparency
### Alert Settings
1. **Enable Alerts** - Master switch to activate/deactivate all alerts
2. **Alert 15:30** - New York opening notification
3. **Alert 18:30** - European session close notification
4. **Weekend Start Alert** - Market close notification (Fri 20:00)
5. **Weekend End Alert** - Market reopen notification (Sun 23:00)
---
## 📖 How to Use
### Basic Installation
1. Add the indicator to your chart
2. Lines will automatically appear at 15:30 and 18:30 (Italian time)
3. Weekend will be highlighted with a colored background
4. Customize colors and styles from settings (gear icon)
### Alert Activation
#### Method 1: Automatic Alerts (Recommended - Easiest)
1. Go to indicator **Settings** (gear icon)
2. **Alert Settings** section
3. Check the alerts you want to receive
4. Alerts activate automatically!
#### Method 2: Custom Alerts (Advanced)
1. Click **⏰ Alert** button (top right)
2. Select **Condition** → Indicator name
3. Choose alert type:
- NY Open (15:30)
- EU Close (18:30)
- Weekend Start
- Weekend End
- Any Session
4. Configure **notification options**:
- 📱 App Notification
- 📧 Email
- 🔊 Sound Popup
- 🔗 Webhook URL
5. Click **Create**
---
## 🔔 Alert Messages
Alerts include emojis and clear information:
**🇺🇸 15:30 IT - NEW YORK OPEN**
```
US session start
Instrument:
```
**🇪🇺 18:30 IT - EUROPEAN SESSION CLOSE**
```
Mid US session
Instrument:
```
**🌙 FRIDAY 20:00 - WEEKEND START**
```
Markets closing
Reduced liquidity expected
```
**☀️ SUNDAY 23:00 - WEEKEND END**
```
Markets reopening soon
Get ready for the new week
```
---
## 🎯 Ideal For
- 📈 **Day Traders** operating on US/EU sessions
- 🌍 **Forex Traders** who want to highlight weekends
- 💹 **Scalpers** who need precise time references
- ⏰ **Swing Traders** who want to avoid weekend gaps
- 🇮🇹 **European Traders** using Italian timezone
- 📱 **Mobile Traders** who want push notifications
---
## 💡 Why Use This Indicator?
- **Save time**: No more manual timezone calculations
- **Never miss sessions**: Automatic alerts always notify you
- **Visual clarity**: Immediately identify key sessions
- **Versatile**: Works on any market and timeframe
- **Accurate**: Automatic update with DST
- **Multi-device**: Receive notifications on mobile, desktop, email
---
## 📝 Important Notes
- Time lines are drawn only when the candle matches exactly the target time
- Weekend highlighting covers the period from Fri 20:00 to Sun 23:00 (Italian time)
- Alerts use `alert.freq_once_per_bar` to avoid notification spam
- Script is optimized to not overload the chart
- Alerts work even when the chart is not open (if configured correctly)
---
## 🚀 Use Cases
### Scenario 1: Forex Day Trader
- Activate 15:30 alert to enter on US news
- Activate 18:30 alert to close EU positions
- Visualize lines to identify breakouts at key times
### Scenario 2: Swing Trader
- Activate weekend alerts to close positions before Friday evening
- Weekend highlighting to avoid opening gaps
- Sunday evening alert to prepare weekly setups
### Scenario 3: Intraday Scalper
- Time lines as reference for volatility
- 15:30 alert to exploit NY volume increase
- Customize colors to not disturb technical analysis
---
## 🔄 Future Updates
Planned roadmap:
- Asian session addition (Tokyo)
- Customizable London session
- Volatility statistics per session
- Customizable alerts with custom messages
- Discord/Telegram integration
**Leave a comment with your requests!**
---
## ⭐ Did You Like It?
If you find this indicator useful:
- Leave a ⭐ **star**
- 💬 **Comment** with feedback or requests
- 🔄 **Share** with other traders
- 👤 **Follow me** for more useful scripts!
---
## 🏷️ Tags
`sessions` `times` `italy` `weekend` `alerts` `notifications` `timezone` `CET` `CEST` `new-york` `forex` `day-trading` `scalping` `swing-trading` `utility` `automation`
---
**Version**: 2.0 (Alert Update)
**Language**: Italian / English
**License**: Mozilla Public License 2.0
**Author**:
---
**Happy Trading! 📊🌍**

FVG Supply and DemandThis indicator combines powerful tools into one:
• Supply & Demand Zones built from swing highs/lows with ATR-based zone width, POI markers, and Break-of-Structure (BOS) detection.
• Volumized Fair Value Gaps (FVGs) showing bullish/bearish gaps, total volume inside the gap, volume distribution, optional zone-combining, and auto-cleanup.
• Swing TSL Line and manage bar color.
It helps visualize key imbalance areas, institutional zones, and price reaction points.
Credits to the Author.
⚠️ Disclaimer
This indicator is provided for educational and analytical purposes only.
It does not provide trading advice.
Past results do not guarantee future outcomes.
Use responsibly and in conjunction with your market analysis.

P_NQ Futures Daily Bias & Structure ProOverview The Master Sniper is a professional-grade execution system designed for high-volatility assets like NQ (Nasdaq 100) and ES (S&P 500). Unlike standard indicators that generate blind signals, this script uses a Multi-Timeframe Logic Engine to first establish a daily bias and then hunt for specific intraday triggers.
It features a Hybrid Strategy that can automatically switch between Trend Following (Smart Money Concepts) and Mean Reversion (Gap Fades), giving you a complete toolkit for any market condition.
Key Features
1. Macro Bias Engine (The Filter) Before generating any signal, the script analyzes the Daily Chart in the background:
Structure: Checks for Higher Highs/Lows vs. Lower Highs/Lows.
Momentum: Uses RSI and the 200 EMA to ensure you aren't buying the top or selling the bottom.
Result: It generates a directional bias (Bullish/Bearish) that filters out low-probability trades.
2. Hybrid Entry Logic
Trend Mode (SMC): Identifies Fair Value Gaps (FVG) within "Discount" or "Premium" zones. It only triggers if the price pulls back into a value area aligned with the Daily Bias.
Reversal Mode (Elasticity): Detects when price is over-extended (2.0 Standard Deviations from VWAP) or when a "Liquidity Sweep" occurs, signaling a snap-back trade.
Gap Rejection (Morning Fade): A dedicated engine that monitors the Opening Gap. If the market gaps significantly but fails to hold, it triggers a "Fade" trade to target the gap fill.
3. Professional Trade Management Visualizes your trade plan instantly on the chart:
Split Targets: Draws targets for Contract 1 (Scalp) and Contract 2 (Runner).
Auto-Break Even: The moment TP1 is hit, the Stop Loss line visually moves to your Entry Price, signaling a "Risk-Free" trade.
Infinite Target Lines: Extends target lines to the right until the trade concludes, keeping your chart clean.
4. Risk Filters
Range Filter: Prevents buying in the Top 1/3 or selling in the Bottom 1/3 of the daily range.
Proximity Filter: Blocks trades that are squeezing too tight against the 100-candle High/Low.
How to Use
Timeframe: Optimized for the 5-Minute (5m) chart on Futures (NQ/ES) or Tech Stocks.
Dashboard: Check the bottom-right panel. Ensure "Status" says "SCANNING" and Filters show "Active."
Execution: Wait for the alert (e.g., "🟢 ENTER LONG"). Place your orders at the Blue Line with SL at the Red Line.

TCT OBIF Detector█ OVERVIEW
The OBIF (Order Block Imbalance Fill) indicator automatically detects and visualizes high-probability trading zones by combining two powerful Smart Money Concepts: Order Blocks and Fair Value Gaps (FVGs).
An OBIF occurs when an Order Block forms immediately before a Fair Value Gap, creating a zone of institutional interest that price often revisits before continuing its move.
█ CONCEPTS
Order Block (OB)
An Order Block is the last opposing candle before a strong directional move. It represents an area where institutional traders likely placed orders.
- Bullish OB: Last bearish candle before an up-move
- Bearish OB: Last bullish candle before a down-move
Fair Value Gap (FVG)
An FVG is a price imbalance created when a candle's body completely gaps past the previous candle's range, leaving an unfilled area.
- Bullish FVG: Gap up where candle .low > candle .high
- Bearish FVG: Gap down where candle .high < candle .low
OBIF Zone
When an Order Block directly precedes an FVG, it creates an OBIF - a confluence zone with higher probability of acting as support/resistance.
█ HOW TO USE
1. Identify the Trend
Use OBIFs in the direction of the higher timeframe trend for best results.
2. Wait for Price to Return
OBIFs act as magnets - price often returns to fill the imbalance and test the order block.
3. Look for Confirmation
When price enters an OBIF zone, look for:
- Rejection wicks
- Engulfing patterns
- Break of structure on lower timeframes
4. Mitigation
Once price fully trades through the OBIF (touches the opposite edge), the zone is considered mitigated and loses its significance.
█ FEATURES
- Automatic Detection — Identifies OBIFs in real-time as they form
- Visual Zones — Clean, non-intrusive boxes that don't obscure price action
- Mitigation Tracking — Zones automatically update when price mitigates them
- Multi-Timeframe Friendly — Works on any timeframe from 1m to Monthly
- Customizable — Adjust colors, opacity, and display preferences
█ SETTINGS
- Lookback Window — How many candles back to search for the Order Block (default: 3)
- Show Bullish/Bearish — Toggle visibility of each type
- Show Mitigated — Display zones that have been mitigated (shown in gray)
- Fill Opacity — Adjust zone transparency (higher = more see-through)
- Border Width — Thickness of zone borders
█ BEST PRACTICES
✓ Use on higher timeframes (1H+) for more reliable zones
✓ Combine with market structure analysis
✓ Look for OBIFs at key support/resistance levels
✓ Use lower timeframe confirmation for entries
✗ Don't trade every OBIF blindly
✗ Avoid OBIFs against the dominant trend
█ CREDITS
The Composite Trader (TCT) methodologies.

Fabio-Style Order Flow SystemFabio-Style Order Flow System — LVN • Delta • Big Trades • FVG • Order Blocks • Liquidity • Volume Profile
This indicator brings together all major components of Fabio Valentino’s order-flow strategy in one unified tool. It visualizes where smart money is active, where inefficiencies form, and where price is likely to react next.
🔍 FEATURES
1. Order Flow & Delta
Smoothed delta to show true market imbalance
Background color shifts to bullish/bearish delta dominance
Alerts for delta spikes & order-flow flips
2. Big Trade Detection
Highlights Big Buy and Big Sell prints (relative to average volume)
Helps identify institutional aggression on both sides
3. Low Volume Nodes (LVNs)
Automatically detects low-volume zones
Flags retests of LVNs for high-probability reactions
Uses dynamic volume thresholds for accuracy
4. Volume Profile (Lightweight)
Bucket-based intrabar profile across user-defined lookback
Highlights volume distribution without heavy TradingView CPU load
Auto-scales bucket density & transparency
5. Fair Value Gaps (FVGs)
Detects both bullish & bearish three-bar imbalances
Marks gaps visually using colored boxes
Updates dynamically with a user-set lookback
6. Order Blocks (OBs)
Identifies valid displacement bars and their origin OB
Plots clean, minimalist rectangles around key OB zones
Uses ATR-based impulse filtering
7. Liquidity Grabs
Detects wick-based liquidity sweeps
Highlights both equal high/low and stop-run type wicks
Useful for spotting reversals & trap setups
8. Strategy Dashboard
Shows real-time order flow state
Displays delta strength, big trades, LVNs, and last directional impulse
Auto-positions in all corners
🎯 PERFECT FOR
Traders who use:
Order Flow
Smart Money Concepts (SMC)
ICT / FVG / Liquidity models
Market Structure + Volume
Fabio Valentino-style analysis
⚙️ PERFORMANCE
All elements optimized
Uses automatic box-clearing to avoid array overload
Works on all timeframes & markets (crypto, FX, indices, stocks)

ES 30 Second Opening RangeOverview
Tracks opening ranges across three global futures sessions (RTH, Globex, Europe) using 30-second precision sampling. Provides high/low/mid levels, 15-point projection intervals, and breakout detection for range-based trading.
What Makes This Unique
30-Second Precision: Uses request.security_lower_tf() to sample the first 30 seconds of each session, capturing exact opening range high/low rather than relying on larger timeframe bars.
Multi-Session Tracking: Simultaneously monitors RTH (8:30 AM CT), Globex (5:00 PM CT), and Europe (2:00 AM CT) opening ranges with independent calculations for 24-hour futures coverage.
15-Point Projections: RTH-specific feature plots 5 extension levels above/below opening range at 15-point intervals (+15, +30, +45, +60, +75). Calibrated for ES futures point movement.
Adjustable Scalp Levels: Customizable +/- point lines from RTH range (default 4 points) for precise entry/exit management.
How It Works
Opening Range Calculation:
Session detection: hour(time, "America/Chicago") + minute(time) * 0.01
30s data request: request.security_lower_tf(syminfo.tickerid, "30S", high/low)
Range capture: ta.valuewhen(session_time == start_time AND second == 0, array.get(data, 0), 0)
Midpoint: (high + low) / 2
At each session start, the indicator captures the first 30-second bar's high and low, then plots these as persistent levels throughout the session.
15-Point Intervals (RTH only):
Level_up = RTH_high + (15 × n) where n = 1,2,3,4,5
Level_down = RTH_low - (15 × n)
Breakout Detection:
Break_up = ta.crossover(close, session_high)
Break_down = ta.crossunder(close, session_low)
Statistics:
Range width = session_high - session_low (displayed in table)
How to Use
Session-Based Levels: Each session's opening range represents institutional price discovery. Use as dynamic support/resistance throughout the day.
Breakout Trading: Visual signals mark opening range breakouts. Narrow ranges (<10 points ES) often precede larger moves.
15-Point Targets: After RTH breakout, use 15-point intervals as profit targets. Example: after +15 hit, next target is +30.
Gap Analysis: Compare overnight sessions to RTH. Gaps often fill toward RTH opening range.
Scalping: Adjustable point offset provides tight profit targets from range boundaries.
Key Settings
Session Toggles: Enable/disable RTH, Globex, Europe individually
15-Point Lines: RTH-only, off by default. Shows 5 levels above/below OR at 15-point intervals
Point Offset (4.0): Adjustable for tighter (2-3) or wider (6-8) scalp levels
Range Boxes: Optional visual highlighting with adjustable transparency
Statistics Table: Shows session high, low, range width
Why Protected Source
The 30-second data aggregation using request.security_lower_tf() with time-based session detection, 15-point interval projection system calibrated for ES futures, and multi-session concurrent tracking represent proprietary implementation methods.
Important Disclaimers
Not Financial Advice. Educational tool only.
Instrument Specific. 15-point intervals optimized for ES futures. Other instruments may need different sizes.
Session Accuracy. Captures first 30 seconds only. Data gaps or late opens may affect accuracy.
Historical Limitations. Opening range effectiveness varies by market regime and volatility.
Always use proper risk management. This provides reference levels, not trade signals.

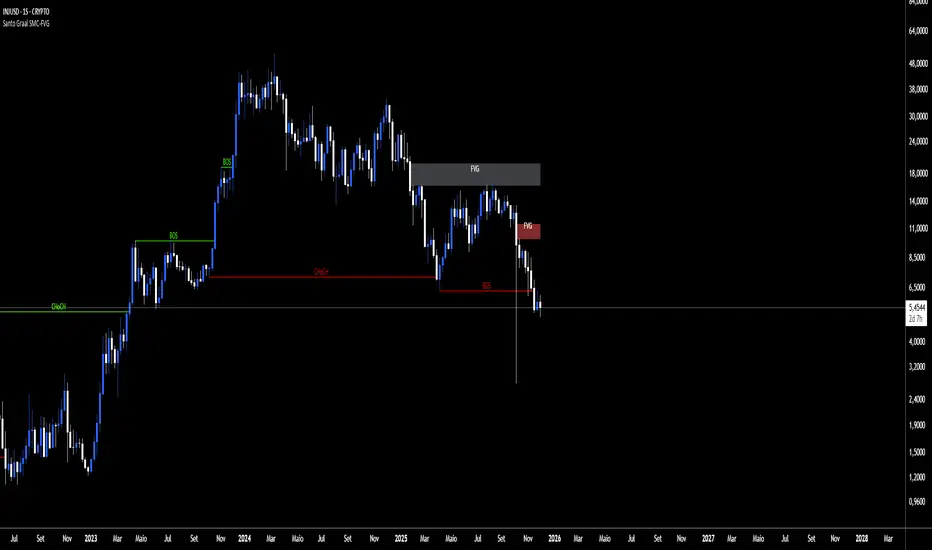
Santo Graal SMC-FVGReading Structures (BOS & CHoCH)
BOS (Break of Structure): shows the trend is still rolling.
BOS up → bullish trend.
BOS down → bearish trend.
CHoCH (Change of Character): heads‑up for a possible flip.
CHoCH up → start of an uptrend.
CHoCH down → start of a downtrend.
Playing with FVG (Fair Value Gaps)
The tool auto‑marks the fair value gaps for you.
Entry: when price comes back to fill/mitigate the gap.
Confirmation: if the gap holds, it backs up the trend direction.
Pro tip: when the bands stick tight (purple), buckle up — a big move is about to pop.
NQ H1 Stats+NQ H1 Stats - Detailed Prob & Excursion Indicator
Overview
NQ H1 Stats - Detailed Prob & Excursion is a specialized statistical overlay indicator for TradingView, tailored for the Nasdaq futures (NQ) on a 1-hour timeframe. It provides real-time insights into the probability of price returning to the hourly open after sweeping the previous hour's high (PHH) or low (PHL), based on historical data segmented by hour and 20-minute intervals. The indicator visualizes these sweeps with lines, labels, circles, background fills, and "excursion zones" (also called "Magic Boxes") that highlight median/mean extensions post-sweep, along with percentile lines (75th, 90th, 95th) for gauging potential "pain" or extreme moves. This tool is designed for intraday traders focusing on liquidity sweeps, or mean-reversion setups, helping to quantify edge based on empirical probabilities and volatility excursions.
The data is hardcoded from extensive historical analysis of NQ behavior (e.g., probabilities range from ~7% to ~91%, with sample sizes up to 2000+ per segment), making it a backtested reference rather than dynamic learning. It emphasizes visual clarity during active hours, with options to filter for Regular Trading Hours (RTH: 09:00–15:59 ET) or high-probability (>70%) events only. Note: This is an educational tool for analyzing market structure; it does not predict future performance or provide trading signals/advice. Past data does not guarantee future results, and users should backtest on current conditions (as of December 2025 data availability) and use at their own risk, in compliance with TradingView's house rules.
Key Features
• Sweep Detection & Probability Labels: Identifies when price breaks PHH (upside) or PHL (downside), displaying a centered label with probability of returning to the hourly open, sample size (N), time of sweep, and a checkmark (✅) if the open is retested post-sweep.
• Visual Lines & Markers: Draws hourly open (h.o.), PHH, and PHL lines with customizable styles/colors; adds small circles on sweep bars for quick spotting.
• Breakout→Open Background Fill: Shaded zone from sweep bar until price returns to open, visualizing extension duration and retracement.
• Excursion (Pain) Zone - "Magic Box": Post-sweep box showing median/mean extension percentages, colored dynamically by probability (green high, orange mid, red low); includes dashed lines for 75th/90th/95th percentiles to mark statistical extremes.
• Time-Segmented Data: Probabilities and excursions vary by hour (0-23) and 20-min segments (0-19 min: _0, 20-39: _1, 40-59: _2), capturing intraday nuances (e.g., higher probs in early/late hours).
• Filters for Focus: RTH-only mode hides non-session elements; high-prob-only shows >70% events to reduce noise.
• Alerts: Triggers on PHH/PHL sweeps with messages for chart checks.
How It Works
• Data Foundation: Uses pre-computed maps for probabilities (prob_high_taken/prob_low_taken), sample sizes, and excursions (mean, median, p75/p90/p95 as percentages of open). Data is initialized on the first bar via f_init_high_data() and f_init_low_data(), covering 24 hours with 3 segments each (e.g., key "9_1" for 09:20-09:39). Probabilities represent historical likelihood of price returning to open after sweep; excursions quantify average/rare extensions (e.g., 0.156% mean = 0.156% of open price).
• Period Detection: On new 1H bars (new_period_bar), resets visuals, draws lines for open/PHH/PHL extending 1 hour forward, and labels if enabled. Uses request.security on standard ticker for real OHLC, bypassing chart transformations (e.g., Heikin Ashi).
• Sweep Logic: On each bar, checks if real high > PHH or real low < PHL. If so, fetches segment-specific data (hour + floor(minute/20)), displays probability label centered mid-hour. Skips if filtered (RTH-only or <70% prob).
• Excursion Visualization: If enabled, draws "Magic Box" from 1-min to 58-min into the hour, bounded by mean/median levels (top/bottom adjusted for high/low sweep). Adds percentile lines with labels (e.g., "75%") at right end. Box color reflects prob strength for quick bias assessment.
• Retest Check: Monitors for open retest post-sweep (high/low cross open, or gap scenarios from prev bar). Adds ✅ to label if hit on subsequent bars (skips sweep bar to avoid false positives). Stops background fill on retest or at 58-min mark.
• Background Fill: Activates on sweep, shades until retest, using user color.
• Cleanup & Performance: Manages labels in arrays, clears on new periods; no excess drawing beyond max counts (500 lines/labels/boxes).
This setup "meshes" statistical backtesting with real-time visualization: Hardcoded data provides empirical probabilities/excursions (reducing subjectivity in breakouts), while dynamic elements (lines, fills, boxes) overlay structure on the chart. It helps traders assess if a sweep is "high-edge" (e.g., >70% prob of revert) or likely to run (low prob, high excursion), blending historical context with current price action for informed decisions.
Settings and Customization
Inputs are grouped for ease:
1. Settings:
o Show RTH Only (9:00-15:59): Restricts to main session (default: false; tooltip: for RTH-focused stats).
o Show High Prob Only (>70%): Filters low-prob sweeps visually (default: false; tooltip: highlights confidence).
2. Visuals:
o Show Line Labels: Toggle "h.o."/ "phh"/ "phl" (default: true).
o Period Open Line Color: Gray 50% (default).
o Previous High/Low Line Colors: Gray 100% (default).
o Open Line Style/Width: Dotted/1 (default; options: Solid/Dotted/Dashed).
3. Breakout→Open Background:
o Show Breakout→Open Background: Toggle fill (default: true).
o Fill Color: Teal 85% (default).
4. Breakout Circles:
o Show Breakout Circles: Toggle (default: true).
o PHH/PHL Break Circle Colors: White 20% (default).
5. Info Label Style:
o Text Size: Small (default; options: Auto/Tiny/Normal/Large/Huge).
o Label Text Color: White (default).
o Low/Mid/High Probability Colors: Red 20%/Orange 20%/Green 20% (default).
6. Excursion (Pain) Zone:
o Show Excursion Zone: Toggle Magic Box (default: true).
o Excursion Box Color: Gray 75% (default; dynamic overrides).
o 75th/90th/95th Percentile Lines: Orange 30%/Red 30%/Dark Red 100% (default).
No additional tables/plots; all elements are lines/labels/boxes for overlay focus.
Usage Tips
• Breakout Trading: Watch for sweeps with high prob (>70%, green label) as potential fades back to open; low prob (red) may signal runs—use excursion box for targets (e.g., exit at 90th percentile for extremes).
• Time Awareness: Probabilities peak in open hours (e.g., 09:00 ~90%+ for initial sweeps) and drop in off-hours; segments capture momentum shifts (e.g., _2 often lower prob).
• RTH Focus: Enable for cleaner stats during high-liquidity sessions; disable for 24/7 view.
• Visual Filtering: Use high-prob-only in volatile conditions to avoid noise; combine with volume or other indicators for confirmation.
• Alerts Integration: Set TradingView alerts on sweeps; check label for prob/N before acting.
• Chart Setup: Best on 1H or lower NQ charts; adjust text size for readability on mobiles.
• Backtesting: Manually review historical sweeps against data maps to validate; update hardcoded values if new data emerges (as of 2025).
Limitations
• Fixed Data: Hardcoded stats may not reflect recent market changes (e.g., post-2025 volatility shifts); not adaptive.
• Reactive Only: Detects sweeps after they occur; no predictive signals.
• Timeframe Specific: Locked to 1H logic; may not translate to other assets/TFs without recoding data.
• Visual Clutter: On busy charts, labels/boxes may overlap—toggle off selectively.
• No Live Stats: Sample sizes are historical; real-time N/prob not updated.
• Gaps & Extremes: Handles gaps in retest logic, but rare events (e.g., news) may exceed 95th percentile.
Disclaimer
This indicator is for informational and educational purposes only. Trading involves significant risk of loss and is not suitable for all investors. The hardcoded data represents past NQ performance and does not guarantee future outcomes. No claims of profitability are made—results depend on market conditions, user strategy, and risk management. Consult a financial advisor before trading, and backtest extensively. Abiding by TradingView rules, this tool provides no investment recommendations.

TTP IFVG Signals With EMA /ICT Gold scalpingThis script uses original logic and alerting rules. in Japan
finding ICT IFVG and EMA conditions.
#IFVG, Forex, ICT, EMA, Scalping, Indicator
This indicator automatically finds IFVG (Imbalance / Fair Value Gap) zones and gives you a buy or sell signal when price comes back and breaks out through that gap.
It also draws a colored box over the gap so you can see the zone visually, and it raises alerts when a new signal appears.
High-level logic:
On every bar, the script looks back up to “IFVG_GapBars” bars.
For each offset i it checks a 3-candle pattern:
– If the low of the newer candle is above the high of the older candle: bullish FVG (price jumped up, leaving a gap).
– If the high of the newer candle is below the low of the older candle: bearish FVG (price jumped down, leaving a gap).
When a valid FVG is found:
– For a bullish FVG it looks for a later close that breaks down through that gap (sell signal).
– For a bearish FVG it looks for a later close that breaks up through that gap (buy signal).
– A moving-average trend filter must agree (downtrend for sells, uptrend for buys).
– It checks that price has not already “filled” the gap before the breakout.
If all conditions are satisfied, it:
– Sets signal_dir = 1 for a buy, or -1 for a sell.
– Draws a box from the original FVG bar to the bar just before the breakout (extended a bit to the right), between the gap high and gap low.
– Plots an ▲ label for buys or ▼ label for sells.
– Triggers the corresponding alert conditions.
Now the parameters:
PipSizeMultilier (PipSizeManual)
Multiplies the symbol’s minimum tick size (syminfo.mintick).
It is used when converting “MinFVG_Pips” into an actual price distance.
If you feel the indicator is too sensitive (too many small gaps), you can increase this multiplier to effectively require a larger price difference.
TickSize
Internal value = syminfo.mintick * PipSizeMultiplier.
This is the actual price step the script uses as a “pip” when checking minimum gap size.
FVG Search Lookback (IFVG_GapBars)
How many bars back from the current bar the script will scan for a 3-candle FVG pattern.
Larger value = it can find older FVGs, but loop cost is higher.
Min FVG Size (Pips/Points) (MinFVG_Pips)
Minimum allowed size of the gap, measured in “pips/points” using TickSize.
If the vertical distance between the gap high and gap low is smaller than this, the gap is ignored.
0.0 means “no size filter” (every FVG is allowed).
FVG Epsilon (Price Units) (FVG_EpsPoints)
Tolerance for the FVG detection.
It is subtracted/added in the condition that checks “low > old high” or “high < old low”.
0.0 means strict gap (no overlap at all). A small positive epsilon allows tiny overlaps to still count as a gap.
Show IFVG Zones (ShowZones)
If true, the script draws a box over the IFVG zone when a signal is confirmed.
If false, no boxes are drawn; you only see the ▲ / ▼ markers and alerts.
Buy Zone Color (ZoneColorBuy)
Fill color and border color for boxes created from bearish FVGs that later produce a buy signal.
Sell Zone Color (ZoneColorSell)
Fill color and border color for boxes created from bullish FVGs that later produce a sell signal.
Box Extension (Bars) (BoxExtension)
How many extra bars to extend the right side of the box beyond the breakout bar.
The internal right coordinate is “bar_index - 1 + BoxExtension”.
Increase this if you want the zone to visually extend further into the future.
MA Period (MA_Period)
Lookback length of the moving average used as a trend filter.
MA Type (MA_Kind)
Type of moving average: “SMA” or “EMA”.
If SMA is chosen, the script uses ta.sma; if EMA, it uses ta.ema.
Moving-average filter behavior:
For sell signals (from bullish FVG): MA must be sloping down (MA < MA ) and price must be below MA.
For buy signals (from bearish FVG): MA must be sloping up (MA > MA ) and price must be above MA.
If these conditions are not satisfied, the FVG is ignored even if the gap and breakout conditions are met.
Signals and alerts:
signal_dir = 1 → buy signal, ▲ label below the bar, “IFVG Buy Alert” / “IFVG Buy/Sell Alert” can fire.
signal_dir = -1 → sell signal, ▼ label above the bar, “IFVG Sell Alert” / “IFVG Buy/Sell Alert” can fire.
signal_dir = 0 → no new signal on this bar.
In short:
This indicator finds 3-candle IFVG gaps, filters them by size and trend, waits for a clean breakout through the gap, draws a box on the original gap zone, and gives you a clear buy or sell signal plus alerts.

On Balance Volume ModA/D doesnt take into account the opening price, it just sees the difference in high to close wik vs close to low wik and adds volume
however if the closing price is above the opening price then arguably there was more buying action than selling
so adjusting A/D formula so that if close > open then it adds to volume not subtract
Effectively this becomes something in bw OBV and A/D
also we need not worry about gaps, since no tradding happens in gaps, so just a gap up / gap down doesnt have any accumulation / distribution effect

OHLC for future# OHLC for Futures
## Overview
This indicator helps traders identify key price levels from previous trading sessions. It displays the previous session's High, Low, Close, and the current session's Open as reference points on your chart.
I believe the day's opening price is crucial, while yesterday's opening price is irrelevant.
I haven't found a suitable OHLC indicator for futures trading, so I spent some time developing this one myself. As I'm currently migrating my trading from other platforms to TradingView, I need to create many indicators. Due to time constraints, there might be some bugs. If you encounter any issues or have suggestions for improvement, feel free to leave a comment or send me a private message.
## Key Features
- Displays previous session OHLC levels as dot markers
- Supports Sunday evening session start for futures markets
- Automatically handles half-day trading and weekend gaps
- Optional display of current session's developing High/Low
- Works on any timeframe
### Gap Detection
The indicator automatically handles:
- Half-day trading when market closes early
- Weekend gaps from Friday to Monday
- Any unexpected day changes during active sessions
## Settings
### Time Configuration
**Start Weekday Session**: Enter time in HHMM format (example: 830 for 8:30 AM)
- Used for Monday through Saturday
**Start Sunday Session**: Enter time in HHMM format (example: 1700 for 5:00 PM)
- Used for Sunday evening sessions
**End Session**: Enter time in HHMM format (example: 1515 for 3:15 PM)
- When the trading session officially ends
**Important**: Recommended to set chart timezone to "Exchange" for best results.
## Setup Examples
### ES or NQ Futures
```
Start Weekday Session: 830
Start Sunday Session: 1700
End Session: 1515
Chart Timezone: America/Chicago
```
## Common Trading Applications
**Support and Resistance**
Previous High and Low often act as key levels where price may reverse or pause.
**Opening Range**
The opening price frequently serves as a pivot point during the trading session.
**Gap Trading**
Compare current Open to previous Close to identify gap situations.
**Range Analysis**
Use previous day's range to assess current volatility and potential targets.
## Tips for Best Results
1. Set your chart timezone to match the exchange timezone
2. Use 5-minute or 15-minute timeframes for clear visibility
3. Verify session times match your futures contract specifications
## Version Information
Current Version: 1.0
## Future Development
Planned enhancements:
- Alert system for price crossing OHLC levels
- Trading system integration with entry/exit signals
- Additional statistical analysis tools
## Notes
- This indicator is designed specifically for futures markets
## Disclaimer
This indicator is for educational and informational purposes only. Always conduct your own analysis and implement proper risk management before trading.
---
For questions, suggestions, or bug reports, please leave a comment below.

Smart Money Concepts Pro Smart Money Concepts Pro
A professional-grade framework for visualizing institutional price behavior through key Smart Money Concepts. It automatically maps structure shifts, imbalances, and liquidity events so traders can study how price develops around supply and demand.
Core Components
Market Structure (BOS / CHoCH) — Detects continuation and reversal breaks using pivot-based logic with a close-beyond threshold and configurable cooldown.
Order Blocks — Highlights institutional footprints validated by volume and distance filters; zones extend until mitigation.
Fair Value Gaps — Marks three-bar inefficiencies that meet a minimum gap size and optionally auto-remove once filled by a user-defined percentage.
Liquidity Sweeps — Identifies stop-hunt wicks exceeding a configurable extension beyond recent highs or lows.
Premium / Discount Zones — Defines equilibrium and price positioning within recent swing ranges.
Confluence Entries (optional) — Generates neutral BUY / SELL markers only when structure, zone, and directional context align.
Dashboard — Summarizes current structure bias, recent events, zone counts, and directional alignment in real time.
Why it’s distinct
All detections are governed by explicit thresholds—volume multipliers, minimum distances, and fill-percent logic—so each signal results from quantifiable structure rather than heuristic pattern matching. Automatic cleanup ensures charts remain clear as zones are mitigated or gaps filled.
Best use
Applicable across Forex, indices, crypto, and equities. Designed for study on 15 m – 1 D timeframes.
For optimal alignment, pin plots to the Right Scale after adding the script.
Disclaimer: This script is provided for educational and analytical purposes only. It does not constitute financial or investment advice.

ZynIQ FVG Master Pro v2 - (Pro Pack)Overview
ZynIQ FVG Master v2 (Pro) identifies fair value gaps and highlights key imbalance zones within price action. It includes detection for standard and extended FVGs, optional mitigation logic and context filters to help traders understand where inefficiencies may be filled.
Key Features
• Detection of regular and extended FVGs
• Optional mitigation and fill markers
• Configurable minimum gap size and sensitivity
• Direction-aware colour coding
• Optional smart filtering to reduce low-quality gaps
• Clean visuals designed for intraday and swing analysis
• Can be used alongside structure and liquidity tools for confluence
Use Cases
• Identifying imbalance zones likely to be revisited
• Spotting high-probability mitigation areas
• Combining FVGs with BOS/CHOCH or liquidity sweeps
• Mapping context for continuation and reversal setups
Notes
This tool provides FVG and imbalance context. It is not a standalone trading system. Use with your preferred confirmation and risk management.

CRT MTF + HTF Candles - Milana TradesCRT MTF + HTF Candles is an educational tool that helps you visualize higher-timeframe CRT and HTF candles on your intraday chart
The script automatically tracks key HTF levels and shows three types of CRT events:
1. Pending CRT
When a higher-timeframe candle breaks the previous high or low, the indicator marks this as a “pending” CRT.
This helps you see potential liquidity grabs and where price is currently trapped inside the HTF range
2. Completed CRT
A CRT becomes “completed” when price reaches the opposite side of the previously broken level
3. Invalid CRT
If price closes outside the HTF range before completion, the CRT is marked as invalid.
This helps you identify failed breaks and possible reversals.
Multi-Timeframe HTF Candles
The script draws clean higher-timeframe candles directly on your lower timeframe chart.
Each candle includes:
Body and wicks
HTF open & close
Swing high/low markers
Timeframe labels
Optional timers (showing time remaining in the candle)
Optional imbalances (FVG / volume imbalance)
Optional Midpont line (0.5)
HTF candle spacing
You can adjust candle width, spacing, and alignment so HTF candles fit nicely over lower-TF bars.
Gaps & Imbalances
The tool can highlight:
Fair value gaps
Volume imbalance
Swing Sweep line
When price tried update swing but closed inside the candle cange
Equlibrium line (Midpoint 0.5)
Timeframe tags & timers
Shows clear labels for each HTF candle
You can choose which timeframes to show (1H, 2H, 4H, Daily, etc.) and how many candles should be displayed
Trade smart, stay disciplined, and keep improving every day
Enjoy :)

HTF FVG + SessionsThis indicator combines multi-timeframe FVG A–C detection with intraday session boxes on a single chart.
It automatically finds bullish and bearish Fair Value Gaps on 15m, 30m, 1H, 4H, 1D and 1W timeframes.
Fresh FVGs are drawn in a transparent gold color, then dynamically shrink as price trades back into the gap.
Once price fully fills the gap, the FVG box and its label are automatically removed from the chart.
After the first touch, each FVG changes to a per-timeframe gray shade, making overlapping HTF gaps easy to see.
You can toggle each timeframe on/off and also globally enable/disable all FVGs from the settings panel.
Session boxes highlight Asia, London, NY AM, NY Lunch and NY PM using soft colored rectangles.
Each session box is plotted from the high to the low of that session and labeled with its name in white text.
A global “Show all session boxes” switch allows you to quickly hide or display the session structure.
This tool is designed for traders who want to combine FVG liquidity maps with clear intraday session context.

Morning ORB FVG Trigger✅ Overview
Morning ORB FVG Trigger is a complete intraday trading framework built around:
A Morning Opening Range Breakout (ORB)
The first Fair Value Gap (FVG) after that breakout
Strict risk management and position sizing
Optional HTF trend filter (Daily / Weekly / Monthly)
Optional Daily ATR filter to avoid extreme days
The script is designed for futures / indices / FX on intraday charts up to 15 minutes and for traders who want a clean, mechanical entry framework with clear risk.
🧠 Core idea
Define a morning opening range (e.g. 09:30–09:45).
Wait for a clean breakout above/below that range.
After the breakout, wait for the first FVG in breakout direction,
confirmed by the next candle (no immediate full reclaim).
Use a chosen stop logic + R:R factor to build risk/reward boxes.
Calculate position size based on your account risk.
(Optional) Only take trades:
In the direction of the HTF EMA trend (D/W/M).
On days where the morning range is within a band of the Daily ATR.
You can also disable all signals/boxes and use the script just as a visual ORB tool.
⏰ 1. ORB / Morning Range
Inputs (Main section)
Morning Range Session
Time window of the opening range in exchange time
Example: 09:30–09:45 for a 15-minute ORB.
You can type custom ranges (e.g. 09:30–09:35 for a 5-minute ORB).
Risk/Reward (TP factor)
Multiplier for the take-profit distance relative to the stop.
2.0 = TP is 2× the stop distance
1.5 = TP is 1.5× the stop distance
Show ORB range
If enabled, draws:
ORB high/low lines
ORB labels (e.g. 15min ORB high / low)
Optional midline
Extend ORB lines to the right (bars)
How many bars to extend the ORB high/low horizontally beyond the ORB itself.
Trade box width (bars)
Horizontal width (in bars) of:
Red risk box (entry–stop)
Green reward box (entry–TP)
Implementation details
The ORB is always calculated on 1-minute data internally, so it stays precise even on 5m/15m charts.
The script only works on intraday timeframes up to 15 minutes.
📦 2. FVG Block
Group: “FVG”
Threshold %
Minimum size of an FVG in % of price.
0 = every FVG
Higher values = only larger gaps
Auto threshold (from volatility)
If enabled, the minimum FVG size is derived from historical volatility
instead of a fixed percentage.
Allow breakout FVG partly inside ORB
Off (default): the FVG must lie fully outside the ORB.
On: the breakout FVG itself may still overlap the ORB a bit,
as long as it is the first one attached to the breakout move.
Enable FVG entry signals, boxes & alerts
On: full system – FVG detection, entry labels, risk/TP boxes, alerts.
Off: no entries, no risk/TP boxes, no alerts.
You only get the ORB and (optionally) the HTF dashboard, so you can trade your own setups.
Entry mode
Entry mode (Mid / Edge / NextOpen)
Mid – Entry at the midpoint of the FVG.
Edge – Long at the upper FVG edge, short at the lower FVG edge.
NextOpen – No limit order in the gap. Entry is placed at the next bar open after FVG confirmation.
Edge offset (ticks)
Additional offset for Edge entries:
Long:
+ticks = a bit above the FVG (more conservative)
-ticks = deeper into the FVG (more aggressive)
Short:
+ticks = a bit below the FVG
-ticks = deeper into the FVG
FVG detection logic
Uses a LuxAlgo-style 3-candle FVG pattern (gap between candle 1 and 3).
Only one FVG is taken: the first valid FVG after the ORB breakout in breakup direction.
The FVG candle is the middle bar; the script:
Detects the FVG on the previous bar.
Waits for the current bar to confirm it:
Bullish: current low must stay above the lower FVG boundary
Bearish: current high must stay below the upper FVG boundary
Only then an entry signal is generated.
🛑 3. Stop Logic
Group: “Stop Logic”
Stop mode (PrevBar / Pivot / FVG Candle)
PrevBar – Stop at the low/high of the candle before the FVG
(tight/aggressive).
FVG Candle – Stop at the low/high of the FVG candle itself
(medium).
Pivot – Stop at the most recent swing high/low
using pivotLeft / pivotRight pivots (more conservative).
Ticks (stop buffer)
Offset (in ticks) from the selected stop level.
> 0 = further away (more room, more risk)
< 0 = closer (tighter stop)
Pivot left / Pivot right
Number of candles left/right to define a swing high/low
when using Pivot stop mode.
Typical intraday values: 2–3.
The script also sanity-checks the stop:
if the calculated stop would be invalid (e.g. above entry in a long), it moves it by a minimal distance (2 ticks) to keep a valid risk.
📈 4. HTF Trend Filter (Daily / Weekly / Monthly)
Group: “HTF Trend Filter”
Enable HTF trend filter
If enabled, trades are only allowed:
Long when at least 2 of D/W/M closes are above their EMA
Short when at least 2 of D/W/M closes are below their EMA
EMA length (D/W/M)
EMA length for all three higher timeframes (Daily, Weekly, Monthly).
This helps focus entries in the direction of the dominant higher-timeframe trend.
📊 5. ATR Filter (Daily)
Group: “ATR Filter (Daily)”
Use daily ATR filter
If enabled, the height of the ORB (ORB high – ORB low) must be within
a band of the Daily ATR to allow any signals.
Daily ATR length
ATR period on the Daily timeframe.
Min ORB size vs ATR
Lower bound:
Example: 0.3 → ORB must be at least 0.3 × Daily ATR
0.0 = no minimum.
Max ORB size vs ATR
Upper bound:
Example: 1.5 → ORB must be ≤ 1.5 × Daily ATR
0.0 = no maximum.
If the ORB is too small (choppy) or too large (exhausted move), no breakout or FVG signal will be generated on that day.
🧭 6. HTF Dashboard & Signal Labels
Group: “HTF Trend Dashboard”
Show HTF dashboard
Draws a small label at the top of the chart showing:
HTF Trend (EMA X)
D: UP/FLAT/DOWN
W: UP/FLAT/DOWN
M: UP/FLAT/DOWN
Dashboard position
Top Right, Top Center, Top Left – places the dashboard at the top.
Over Risk Info – no top dashboard; instead, the HTF trend info is shown as a label near the risk box when a new signal appears.
Lookback (bars) for top anchor
How many bars to use to determine the top price level for dashboard placement.
Show HTF trend above risk box on signal
Only relevant if Dashboard position = Over Risk Info.
When enabled, a small HTF label appears near the risk box for each new trade.
Signal label vertical offset (ticks)
Vertical spacing between risk info label and HTF label.
Minimum spacing HTF/Risk (ticks)
Ensures a minimum vertical distance so the two labels don’t overlap.
HTF signal label X offset (bars)
Horizontal offset (left/right) relative to the risk info label.
⏳ 7. ORB–FVG Filters (Session & Time Window)
Group: “ORB FVG Filter”
Only same session day
If enabled, FVG entries are only allowed on the same calendar day
as the ORB. When the date changes, all state & drawings are reset.
Limit hours after ORB
Enables a time window after the ORB end.
Trading window after ORB (hours)
Length of that window in hours.
Example: 2.0 → FVG signals only in the first 2 hours after ORB end.
💰 8. Risk Management & Position Sizing
Group: “Risk Management”
Calculate position size
If enabled, the script computes suggested mini and micro contract size for you.
Account size
Your trading account size (in account currency).
Risk mode
Percent – risk is a % of account size (Account risk %).
Fixed amount – risk is a fixed dollar amount (Fixed risk ($)).
Account risk %
Risk per trade as a percentage of account size (e.g. 1.0 for 1%).
Fixed risk ($)
Fixed risk per trade in dollars when using Fixed amount mode.
Micro factor (vs mini)
How much a micro contract is worth relative to a mini.
Example:
0.1 → one micro moves 1/10 of one mini.
Risk Info label
For each new trade, a label is shown above the boxes with:
Stop distance in price and $ risk per mini
Max risk allowed for the trade
Suggested mini and micro size
Text like:
Suggested: 2 mini
Suggested: 5 micro
or Suggested: no trade
This makes the script especially useful for prop-firm rules or strict risk discipline.
🎨 9. Visual Style (Boxes, Labels, ORB Lines)
Group: “Box & Label Style (Trade)”
Label font size (Very small, Small, Normal, Large)
Entry label BG / text color
Stop label BG / text color
TP label BG / text color
Risk info BG / text color
Risk box color (entry–stop zone)
Reward box color (entry–TP zone)
Group: “ORB Style”
ORB high line color
ORB low line color
ORB line width
ORB label font size
ORB label background color
ORB label text color
Show ORB midline
ORB midline color / width / style (Solid / Dashed / Dotted)
⚠️ 10. Alerts
Group: “Alerts”
The script defines three alert conditions:
Long entry FVG breakout
Triggered when a new long signal appears.
Short entry FVG breakout
Triggered when a new short signal appears.
FVG entry (long/short)
Generic alert for any new signal (long or short).
To use them:
Add the indicator to the chart.
Open the Alerts dialog → “Condition”.
Select this script and one of the alert conditions.
Set your preferred expiration and notification settings.
Alerts only fire when Enable FVG entry signals, boxes & alerts is on.
🧩 11. How the trading logic flows (summary)
Build ORB on 1-minute data during the selected session.
Optionally reject the day if ORB is outside the ATR bounds.
Wait for a breakout (close above high or below low), respecting HTF trend filter.
After breakout, look for the first valid FVG in that direction:
Outside the ORB (unless breakout FVG allowed inside)
Confirmed by the next candle (no full reclaim)
Once confirmed:
Compute entry, stop, target.
Draw risk/reward boxes and all labels.
Optionally show HTF signal label over the risk info.
Trigger alerts if enabled.
If you disable FVG signals, only steps 1–3 (plus dashboard) are effectively active.
⚠️ 12. Notes & Disclaimer
Script is intended for intraday trading up to 15-minute timeframes.
All signals are mechanical and do not guarantee profitability.
Always backtest and forward-test on your own data before risking real money.
This script is for educational purposes only and is not financial advice.
🚀 Quick-start guide
Add the script to your chart
Use an intraday timeframe ≤ 15 minutes (1m, 3m, 5m, 15m).
Works best on liquid indices, futures, FX and large-cap stocks.
Set the Morning Range
In “Morning Range Session” choose the exchange’s opening window.
Examples
US index futures (CME): 08:30–08:45 or 08:30–08:35
US stocks (NYSE/Nasdaq): 09:30–09:45 or 09:30–09:35
The ORB is always calculated on 1-minute data internally, so the range stays accurate on higher intraday charts.
Keep the default filters at first
HTF Trend Filter: ON
EMA length = 20
This will only allow trades in the direction of the dominant D/W/M trend.
ATR Filter: OFF (optional; you can enable later once you’re comfortable).
Use the full trade system
In the FVG group leave
“Enable FVG entry signals, boxes & alerts” = ON
Entry mode: Mid
Stop mode: FVG Candle or PrevBar
Risk/Reward: 2.0 as a starting point.
Set your risk
Turn on “Calculate position size”.
Enter your Account size and choose either:
Risk mode = Percent (e.g. 1.0 = 1% per trade), or
Risk mode = Fixed amount (e.g. $250 per trade).
The risk info label will show:
Stop distance in price and $/contract
Max allowed risk
Suggested mini and micro contract size.
Enable alerts (optional)
Open the Alerts dialog → Condition: this script.
Choose one of:
Long entry FVG breakout
Short entry FVG breakout
FVG entry (long/short)
Choose “Once per bar” or “Once per bar close”, and your preferred notification type.
Replay & journal
Use the TradingView bar replay tool to step through past days.
Focus on:
How the ORB defines the structure.
How the first confirmed FVG outside the ORB behaves.
Whether the risk/TP levels fit your own style and product.
🎛 Recommended settings & profiles
These are starting points, not rules. Always adapt to the instrument and your own risk tolerance.
1. Conservative / Trend-following
Timeframe: 5m or 15m
Morning Range Session: 15-minute ORB around the cash or futures open
FVG
Threshold %: 0.05–0.1 (filter out very small gaps)
Auto threshold: OFF (keep it simple)
Allow breakout FVG partly inside ORB: OFF
Enable FVG entry signals/boxes/alerts: ON
Entry mode: Mid
Stop Logic
Stop mode: Pivot
Pivot left/right: 2–3
Stop buffer: +1–2 ticks
HTF Trend Filter
Enabled: ON
EMA length: 20
ATR Filter
Enabled: ON
Daily ATR length: 14
Min ORB vs ATR: 0.3–0.4
Max ORB vs ATR: 1.2–1.5
Risk Management
Risk mode: Percent
Account risk: 0.5–1.0%
Idea: Only trade when the higher-timeframe trend supports the move and the opening range is of a “normal” size for the current volatility.
2. Balanced / Intraday directional
Timeframe: 3m or 5m
FVG
Threshold %: 0.02–0.05
Auto threshold: ON (lets the script adapt to volatility)
Allow breakout FVG partly inside ORB: ON
(first breakout FVG may partly sit inside the ORB)
Entry mode: Edge
Edge offset (ticks): 0 or +1
Stop Logic
Stop mode: FVG Candle
Stop buffer: 0–1 ticks
HTF Trend Filter
Enabled: ON
ATR Filter
Enabled: OFF (optional)
Risk Management
Risk mode: Percent
Account risk: 1.0–1.5% (if this fits your plan)
Idea: Slightly more aggressive entries at the gap edge, still aligned with HTF trend, but with more flexibility on ATR.
3. Aggressive / Scalping around the ORB
Timeframe: 1m or 3m
FVG
Threshold %: 0.0–0.02
Auto threshold: ON
Allow breakout FVG partly inside ORB: ON
Entry mode: NextOpen or Edge with a negative offset (deeper into the gap)
Stop Logic
Stop mode: PrevBar
Stop buffer: 0 or -1 tick
HTF Trend Filter
Enabled: OFF (or ON but treat as soft guidance)
ATR Filter
Enabled: OFF
Risk Management
Risk mode: Percent
Account risk: lower, e.g. 0.25–0.5% per trade
Idea: More trades and tighter stops. Best for experienced traders who understand the limitations of scalping and whipsaw risk.
Final reminder
All of these are templates, not guarantees:
Always check how the system behaves on your market and session.
Start on replay and demo before trading real money.
Adjust filters (HTF, ATR, thresholds) until the signals fit your personal approach.

BPR (Ballanced price range) DetectorHow This BPR Detector Works
This indicator is designed to detect and visualize balanced price ranges (BPRs) on price charts. The indicator has two main components:
Regular FVG Detection - The indicator first detects regular Fair Value Gaps in price action, which are spaces where price has moved quickly leaving a gap. This is necessary because BPRs are derived from regular FVGs.
BPR Detection - When the price action inverts and moves through a regular FVG in the opposite direction, the indicator identifies this as a BPR. This concept is important in Inner Circle Trader (ICT) methodology as it can signal potential changes in trend direction. Additionally the detection logic is refined by incorporating displacement.
The main functionality preserved includes:
Detection of regular FVGs (required to find BPRs)
Conversion of regular FVGs to BPRs when price moves through them creating a FVG in the opposite direction
Visual display of both FVG and BPR zones
Mitigation tracking for both types of imbalances
Displacement visualization that helps identify energetic price moves
Key Settings
FVG Settings - Control the appearance and behaviour of regular Fair Value Gaps
BPR Settings - Control the appearance of Breaker Price Ranges (which have different colours by default)
Mitigation Settings - Define how the indicator determines when an imbalance has been filled
Displacement Settings - Optional highlighting of energetic price moves that may lead to imbalances

Sunday Open & Friday Close LinesSunday Open & Friday Close Lines — © Erica Lorrai | Trade Tribe HQ
A clean weekly anchor tool for traders who love simple, high-signal charting.
Clean charts, clean mind, clean trades.
This script marks the two most important moments of every trading week:
where the market closed… and where it truly reopened.
Designed for traders who use dealer-cycle logic, market structure, or BTMM-style timing, these lines help you instantly:
Spot weekend gaps
Identify weekly narrative shifts
See where the dealers reset liquidity
Anchor your weekly analysis with precision
Track the beginning of new cycles and the end of old ones
No clutter. No noise. Just two high-value levels that quietly run your entire week.
Customize the color, width, and line type to match your chart style and make weekly transitions impossible to miss.
Whether you're new to trading or deep into pattern-cycle logic, this little tool becomes one of those “how did I trade without this?” markers.
© Erica Lorrai — Trade Tribe HQ
Aloha & welcome to the Tribe. 🌺
How to Use
Add the script to your chart on any timeframe.
The indicator automatically detects each new trading week.
Two vertical lines will appear:
Friday Close Line – last candle before the weekend
Sunday Open Line – first candle of the new week
Use the settings panel to customize color, width, and line style.
These weekly anchors help you identify weekend gaps, weekly resets, and structural shifts in real time.
If you’re new here — welcome to the Tribe. 🌺
This little tool is one of the first things I teach my traders:
“See the week clearly, and the trades get clearer too.”
If you want more BTMM-style tools, weekly breakdowns, or want to learn the system behind these levels, come hang out at Trade Tribe HQ.
Happy trading.
— Erica Lorrai

Liquidity Sweep & FVG StrategyThis strategy combines higher-timeframe liquidity levels, stop-hunt (sweep) logic, Fair Value Gaps (FVGs) and structure-based take-profits into a single execution engine.
It is not a simple mash-up of indicators: every module (HTF levels, sweeps, FVGs, ZigZag, sessions) feeds the same entry/exit logic.
1. Core Idea
The script looks for situations where price:
Sweeps a higher-timeframe high/low (takes liquidity around obvious levels),
Then forms a displacement candle with a gap (FVG) in the opposite direction,
Then uses the edge of that FVG as a limit entry,
And manages exits using unswept structural levels (ZigZag swings or HTF levels) as targets.
The intent is to systematically trade failed breakouts / stop hunts with a defined structure and risk model.
It is a backtesting / study tool, not a signal service.
2. How the Logic Works (Conceptual)
a) Higher-Timeframe Liquidity Engine
Daily, Weekly and Monthly highs/lows are pulled via request.security() and stored as HTF liquidity levels.
Each level is drawn as a line with optional label (1D/1W/1M High/Low).
A level is marked as “swept” once price trades through it; swept levels may be removed or shortened depending on settings.
b) Sweep & Manipulation Filter
A low sweep occurs when the current low trades through a stored HTF low.
A high sweep occurs when the current high trades through a stored HTF high.
If both a high and a low are swept in the same bar, the script flags this as “manipulation” and blocks new entries around that noise.
The script also tracks the sweep wick, bar index and HTF timeframe for later use in SL placement and labels.
c) FVG Detection & Management
FVGs are defined using a 3-candle displacement model:
Bullish FVG: high < low
Bearish FVG: low > high
Only gaps larger than a minimum size (ATR-based if no manual value is set) are kept.
FVGs are stored in arrays as boxes with: top, bottom, mid (CE), direction, and state (filled / reclaimed).
Boxes are auto-extended and visually faded when price is far away, or deleted when filled.
d) Entry Conditions (Sweep + FVG)
For each recent sweep window:
After a low sweep, the script searches for the nearest bullish FVG below price and uses its top edge as a long limit entry.
After a high sweep, it searches for the nearest bearish FVG above price and uses its bottom edge as a short limit entry.
A “knife protection” check blocks trades where price is already trading through the proposed stop.
Only one entry per sweep is allowed; entries are only placed inside the configured NY trading sessions and only if no manipulation flag is active and EOD protection allows it.
e) Stop-Loss Placement (“Tick-Free” SL)
The stop is not placed directly on the HTF level; instead, the script scans a window around the sweep bar to find a local extreme:
Longs: lowest low in a configurable bar window around the sweep.
Shorts: highest high in that window.
This produces a structure-based SL that is generally outside the main sweep wick.
f) Take-Profit Logic (ZigZag + HTF Levels)
A lightweight ZigZag engine tracks swing highs/lows and removes levels that have already been broken.
For intraday timeframes (< 1h), TP candidates come from unswept ZigZag swings above/below the entry.
For higher timeframes (≥ 1h), TP candidates fall back to unswept HTF liquidity levels.
The script picks up to two targets:
TP1: nearest valid target in the trade direction (or a 2R fallback if none exists),
TP2: second target (or a 4R fallback if none exists).
A multi-TP model is used: typically 50% at TP1, remainder managed towards TP2 with breakeven plus offset once TP1 is hit.
g) Session & End-of-Day Filters
Three predefined NY sessions (Early, Open, Afternoon) are available; entries are only allowed inside active sessions.
An End-of-Day filter checks a user-defined NY close time and:
Blocks new entries close to the end of the day,
Optionally forces flat before the close.
3. Inputs Overview (Conceptual)
Liquidity settings: which HTF levels to track (1D/1W/1M), how many to show, and sweep priority (highest TF vs nearest vs any).
FVG settings: visibility radius, search window after a sweep, minimum FVG size.
ZigZag settings: swing length used for TP discovery.
Execution & protection: limit order timeout, breakeven offset, EOD protection.
Visuals: labels, sweep markers, manipulation warning, session highlighting, TP lines, etc.
For exact meaning of each input, please refer to the inline comments in the open-source code.
4. Strategy Properties & Backtesting Notes
Default strategy properties in this script:
Initial capital: 100,000
Order size: 10% of equity (strategy.percent_of_equity)
Commission: 0.01% per trade (adjust as needed for your broker/asset)
Slippage: must be set manually in the Strategy Tester (recommended: at least a few ticks on fast markets).
Even though the order size is 10% of equity, actual risk per trade depends on the SL distance and is typically much lower than 10% of the account. You should still adjust these values to keep risk within what you personally consider sustainable (e.g. somewhere in the 1–2% range per trade).
For more meaningful results:
Test on liquid instruments (e.g. major indices, FX, or liquid futures).
Use enough history to reach 100+ closed trades on your market/timeframe.
Always include realistic commission and slippage.
Do not assume that past performance will continue.
5. How to Use
Apply the strategy to your preferred symbol and timeframe.
Set broker-like commission and slippage in the Strategy Tester.
Adjust:
HTF levels (1D/1W/1M),
Sessions (NY windows),
FVG search window and minimum size,
ZigZag length and EOD filter.
Observe how entries only appear:
After a HTF sweep,
In the configured session,
At a FVG edge,
With TP lines anchored at unswept structure / liquidity.
Use this primarily as a research and backtesting tool to study how your own ICT / SMC ideas behave over a large sample of trades.
6. Disclaimer
This script is for educational and research purposes only.
It does not constitute financial advice, and it does not guarantee profitability. Always validate results with realistic assumptions and use your own judgment before trading live.

Psychological Price Level GBPJPY (.250 / .750)This indicator is designed for GBPJPY traders who work with precision and smart-money-based analysis. It automatically plots psychological price levels at .250 and .750, which are known institutional reference points that often influence market structure, price reactions, and liquidity behavior. Unlike typical round-number indicators, this tool focuses specifically on quarter levels, which are frequently used by algorithms, banks, and experienced institutional traders.
Fixed and Reliable Levels
As price evolves, the levels update automatically and remain fixed on the chart without shifting when you scroll. This ensures that the levels always stay anchored to relevant market structure, making them reliable reference points for planning entries, targets, or stop placements.
Customization
The indicator allows full customization. You can freely adjust the line color, line thickness, and line style to match your personal trading chart layout. You can also choose whether lines extend left, right, or both directions, making the tool flexible enough to fit minimalist or highly marked-up workspaces.
Why These Levels Matter
In smart money trading approaches, the .250 and .750 levels often act as magnetic zones. Price frequently gravitates toward them to test liquidity or engineer traps before continuing its move. These levels may serve as rejection points, breakout confirmation zones, or take-profit areas depending on the broader context. Because they frequently align with order blocks, fair value gaps, and market structure shifts, they can add meaningful confluence to directional bias and trade timing.
Who Can Benefit
This tool is particularly useful for scalpers, day traders, and swing traders who base decisions on liquidity behavior and institutional logic. It works well on any timeframe and complements concepts such as premium and discount models, inefficiencies, fair value gaps, and volume imbalances. Many traders find that these price levels help them identify reactions earlier, refine entries, and improve confidence when executing trades.
Final Note
If this indicator supports your trading workflow, feel free to leave a comment or mark it as a favorite + give it a BOOST . Your feedback helps guide future improvements and ensures the tool continues evolving for serious GBPJPY traders.
Happy trading — and stay precise. 🚀📊
