SPY SPX ES Price Converter+ [Pt]This is a + version of my original SPY SPX ES Price Converter indicator
Description
The SPY SPX ES Price Converter is a powerful and easy-to-use tool that allows traders to view corresponding price levels for linked instruments in real-time. This includes SPY, SPX, ES, and SPX500USD. Although these instruments often move in sync, differences in price movements, volume, and trading hours can create unique key levels and support/resistance areas for each. By mapping these levels on the same chart, traders can more easily spot trading opportunities and improve their chances of success.
Customizable features
- multiplier from the closest whole number price level
- line color
- line style
- label position / size
- # of levels to display
- toggle current price display table
|| ------------------------------------------------------------------------------------------------------------------------------------------------------------------------------------||
This script includes the following premium unique features.
SPY / SPX Gaps detector
A gap is an area on a chart where the price between two bars changes significantly without any trades happening between them. Such gaps often occur when a strong shift in sentiment happens during the hours when markets are usually closed. This indicator highlights these gaps on the chart and extends them further until they have been covered (i.e., when a newer bar has crossed that gap).
Overnight gaps from SPY or SPX can be mapped directly onto ES chart
VWAPs
VWAPs of these linked instruments can be mapped onto the chart. For example, ES VWAP mapped onto SPY chart, or vise versa. This allows for clear visualization of the price action near these VWAP levels.
Custom Cross Instruments Price Targets
Want to trade SPY options while watching ES chart or vise versa? You can setup to 8 price targets and see the corresponding converted price level. No need to switch between charts to try to figure out which price level corresponds to which.
Search in scripts for "gaps"

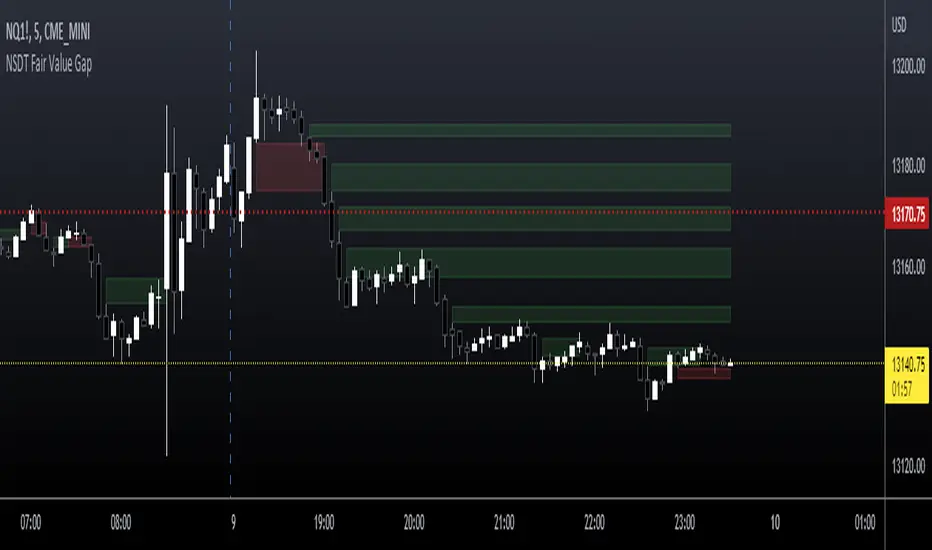
NSDT Fair Value GapThis script is our version of the "Fair Value Gap".
A Fair Value Gap is nothing more than a series of 3 candles with a gap between a candle high/low and a candle high/low two candles prior.
For example:
A Gap Up - the Low of a candle is higher than the High of two candles back.
A Gap Down - the High of a candle is lower than the Low of two candles back.
Typically, on a Gap Up, the trader would wait for the price to re-enter the Gap, and take a Long position.
Typically, on a Gap Down, the trader would wait for the price to re-enter the Gap, and take a Short position.
We found that simply trading through the Gaps (fill the gap) produced a better result. So we reversed the procedure and the colors to show our suggested direction.
We have added inputs so the trader can determine the size of the Gaps to be plotted on the chart. A minimum and maximum can be set.
The number of Gaps to be displayed can be adjusted.
There is a option to remove Gaps that had been filled, to help keep a clean chart.
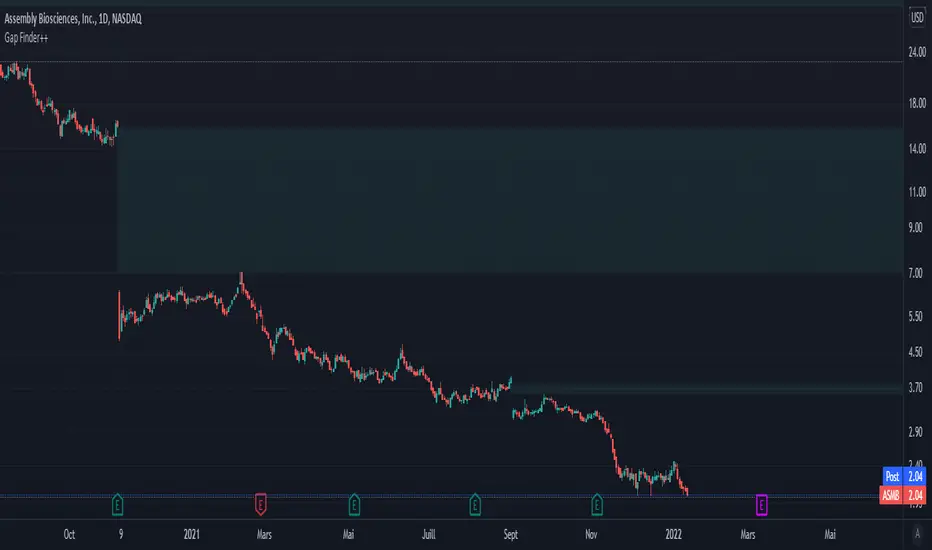
Customizable Gap Finder++█ OVERVIEW
Customizable Gap Finder by ProfessorZoom with a partial close of a gap
█ CONCEPTS
1 — Gaps bullish or bearish
2 — Gaps can be filled
3 — Gaps can be partially close
4 — Some display options
█ OTHER SECTIONS
Thanks to The rational investor for teaching me this and ProfessorZoom because he writes 99% of the script.
Did you know the percentage of gaps filled ? If not, I recommand you to follow his courses, and I have no conflicts of interest.
Simple Gaps as overlaySimple Gaps indicator as an overlay. Otherwise, identical to SImple Gaps which you can find here .

Bravo Backtest - Multi Timeframe Fair Value GapsBravo Backtest – Multi Timeframe Fair Value Gaps
This indicator displays Fair Value Gaps (FVGs) across multiple timeframes, with a strong focus on clarity, structure, and non-repainting behavior.
To reduce noise and keep charts clean, only Fair Value Gaps from your current chart timeframe and higher are shown. Lower-timeframe imbalances are intentionally filtered out.
Key features:
- Multi-timeframe Fair Value Gap detection
- Wick-to-wick, three-candle FVG logic
- Non-repainting: all FVGs are confirmed on candle close
- Automatic removal of invalidated FVGs (close through the zone)
- Adjustable lookback period to limit historical zones
- Optional bullish / bearish filtering
- Optional borders that inherit the FVG color
- Clean, professional UI designed for real trading use
This tool is built to support higher-timeframe context, execution clarity, and disciplined charting, making it suitable for both discretionary traders and structured trading models.
Developed and verified by Bravo Backtest.

Fair Value Gaps (Custom)Fair Value Gaps (FVG) - Custom
A comprehensive Fair Value Gap indicator designed for futures traders, offering multi-timeframe analysis with full customization of colors, opacity, and visual elements per timeframe.
What are Fair Value Gaps?
Fair Value Gaps (FVGs) are three-candle patterns where a gap exists between the high of the first candle and the low of the third candle (bullish) or between the low of the first candle and the high of the third candle (bearish). These imbalances often act as support/resistance zones where price tends to return.
Key Features
Multi-Timeframe Support
5 independent timeframe slots
View higher timeframe FVGs on lower timeframe charts
Each timeframe has its own color, opacity, label, and midline settings
Flexible Fill Methods
Any Touch — FVG filled when price touches the zone
Midpoint Reached — FVG filled when price reaches 50% of the zone
Wick Sweep — FVG filled when wick passes through entire zone
Body Beyond — FVG filled when candle body closes beyond the zone
Visual Customization
Per-timeframe color AND opacity control via color picker
Optional midline display per timeframe
Customizable labels with fill percentage display
Optional borders with style/width settings
Boxes can extend to chart edge or fixed bar length
Dashboard & Alerts
Real-time FVG count dashboard (Bull/Bear above/below price)
Alert conditions: Price enters FVG, Midline cross, New FVG formed, FVG filled
Recommended Settings for ES/NQ Futures
Min Gap Size: 8 ticks (2 points)
Fill Method: Body Beyond (most conservative)
Default Opacity: 10% (adjust per timeframe as needed)
Usage Tips
Use higher timeframe FVGs as key support/resistance zones
Watch for confluence when multiple timeframe FVGs overlap
Midline often acts as the first target/reaction point
Combine with other confluence factors (order blocks, volume, etc.)

New Day Opening Gaps (1m 3:29-9:15)Precise Day Opening Gap IndicatorThis custom Pine Script indicator is designed for traders who rely on high-precision gap analysis, particularly for markets like the NSE/BSE.🎯 Core Functionality: Precision Gap IdentificationThis indicator calculates and highlights the exact price gap between the previous day's close and the current day's open. Unlike standard gap analysis that relies on higher timeframes, this script ensures accuracy by strictly using 1-minute data:Previous Close: Captured from the 1-minute candle closing at 3:29 PM (15:29).Current Open: Captured from the 1-minute candle opening at 9:15 AM (09:15).The resulting gap zone is plotted and automatically extends to the right, serving as a critical level for current price interaction.✨ Key Features1. Cross-Timeframe PersistenceThe gap markings are calculated based on the 1-minute chart but are displayed correctly and persist across all timeframes, including 5-minute, 15-minute, 1-hour, and even the Daily chart, ensuring consistency no matter how you analyze the price action.2. Controlled Historical ViewAvoid chart clutter with the "Number of Gaps to Show" input. Easily control how many historical day-opening gaps you want to display on your chart, allowing you to focus only on the most recent and relevant levels.3. Full CustomizationCustomize the look and feel to fit your charting style:Gap Zone: Adjust the color and opacity (transparency) of the gap box.Date Label: Toggle the date label display on/off and control its color, background, opacity, and size. The label is optimally placed at the top-right of the gap zone for clear visibility.🛠️ Recommended UseThis tool is perfect for intraday traders looking to:Identify immediate support and resistance zones based on overnight price action.Track where price action reacts to prior day gaps (filling or holding the gap).Maintain a clear visual reference of daily market openings.

SMC Concepts (Sessions, Lookback Gaps) | קונספטים SMCThe indicator marks the Asian session and the London session in order to see liquidity taking - in addition, it gently marks gaps throughout the entire chart - the indicator marks gaps of a 24/12/6/3 hour back time - from the New York session. The marking of these gaps will be throughout the entire chart until the New York session. Options for selecting a specific time precisely.האינדיקטור מסמן את סשן אסיה ואת סשן לונדון על מנת לראות לקיחת נזילות -בנוסף מסמן בעדינות גאפים לאורך כל הגרף -האינדיקטור מסמן גאפים של זמן לאחור של 24/12/6/3 שעות- מזמן סשן נויורק סימון הגאפים האלו יהיה לאורך כל הגרף עד לסשן נויורק . אפשרויות לבחירת זמן מסוים בדווקה .

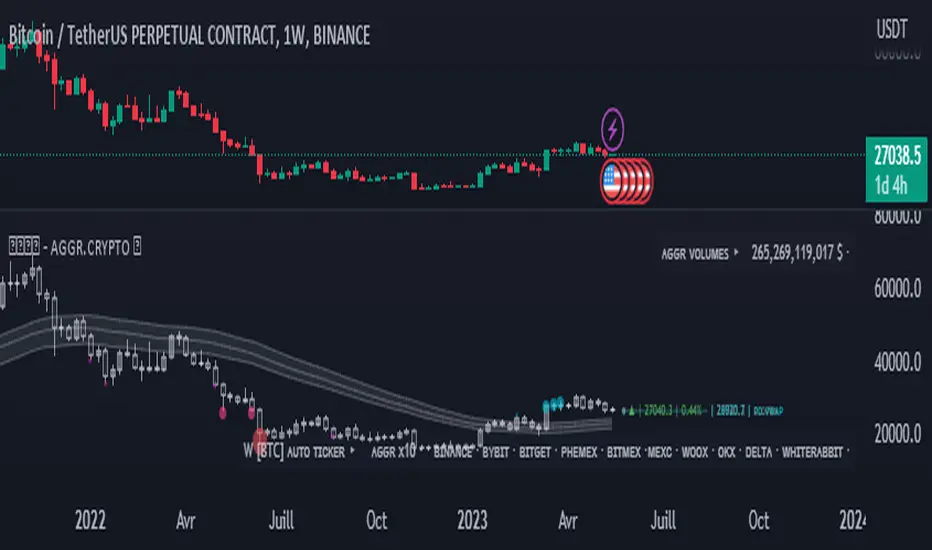
Opal - Aggr.Crypto█ OVERVIEW
The Multi-Exchange Crypto Aggregator is a unique concept ticker that gathers up to 10 tickers into one. A new OPAL Chart is created as an indicator, with its own candles and information. This information is meant to be interpreted as average information in order to reduce noise from a single ticker only. Everything is automated between assets. Our script will always check and ensure that data is received for calculations; otherwise, invalid tickers are ignored. This version is designed for Crypto Perpetual markets.
█ HOW DATA SLIPPAGE/DIFFERENCE IMPACT NOISE
This new average ticker aims to reduce noise in your candles and their live movements, avoiding most of the minor/last-second spikes, especially when they don't happen on every desired exchange at the same time. Our candles have different behaviors and highlight close-open slippage/gaps, as it seems to provide a strong reaction. Those gaps represent average slippage.
█ HOW TO USE
This should help you visualize market behaviors. Volume pressures are the origin of a lot of misunderstood things. Data analysis and observations show that makers target liquidity on both sides. Time and sessions have their own logic and will always need experience, as it is basically a gigantic Tetris game. Anyway, this should help with timing confirmations or bring confidence.
█ FEATURES
Aggregated (Tickers) Candles ▸ Aggregated OHLC candles, the idea behind the script. Set desired tickers to automate in settings. Value and Var% are displayed right next to the current candle.
Aggr. Dynamics/Levels ▸ Plot some strong levels as landmarks calculated on modified price, from Volume Weighted Average Price (VWAP) to Daily aggregated Open Price. The previous day's key level is included.
Aggr. Data Markers ▸ Plot some key markers on the chart, such as Open Pressure gaps, or estimated 3-scale liquidation bubbles with 2 confirmation modes (using different filters).
Aggr. Averages ▸ Plot up to 3 averages or HLC channels for visual ease.
█ SIGN
All of our contents are shared for educational purposes only.
Wishing you success;
OPAL - Strive for Greatness
Simple ICT Order Blocks and Fair Value Gaps by Gowtham KannakajeThis scripts identifies ICT Order Block and ICT Fair Value Gaps
Fair Value Gap:
- Fair Value Gap toggle is off by default
- Users can choose to color the bars having Fair Value Gaps or can select to define the Fair Value Gap using boxes.
- Bar color and box colors can be customized
Order Blocks:
- Order Block box and candle color toggle is on by default
- Users can choose to color the Order Block candles or can select to define the Order Blocks using boxes.
- Bar color and box colors can be customized for bullish and bearish Order Block separately
Note:
- Order Blocks are considered valid only if the candle forming the Fair Value Gap closes away from the Order Block.
- Since Trading View limits the number of boxes to 500, it is advised to use the Color Candle option to identify the Order Blocks or Fair Value Gaps which are very old.
New concept Definitions:
Naked OB : An order block whose immediate next candle forms a Fair Value Gap. Here, the Order Block high or low contributes to the formation of Fair Value Gap.
Covered OB : An order block whose immediate next candle doesn't form a Fair Value Gap. Here, the Order Block high or low doesn't contribute to the formation of Fair Value Gap. Instead it will have other candles in between the Order Block and Fair Value Gap.
Disclaimer: The usage of this indicator might or might not contribute to your profits and losses and the author is not responsible for the same.
Happy Trading.

ICT Opening Gaps [MK]
The indicator plots levels which can act as magnets to price. The levels are gap areas which are used within the ICT (The Inner Circle Trader) trading system.
The indicator plots 5 areas of interest:
1: Daily Volume Imbalances - Referencing the Daily chart, boxes are calculated from close to open between all candles. Candles which have only 'wicks' between the close and open prices are considered 'volume imbalances. The boxes can then be shown on LTFs to aid in decision making for intraday traders. Imbalances can be limited to a maximum amount shown and mitigated imbalances can be removed from the chart. All colors can be customised.
Volume Imbalance example:
2: NWOG - New Week Opening Gap - Plotted from Friday Close at 1659 to Sunday Opening at 1800 (EST). The current NWOG can be displayed on its own, or previous weeks can also be shown (ICT recommends the previous 4 weeks also). Boxes are plotted with a midline and all colors can be customised.
New Week Opening Gaps example:
3. NDOG - New Day Opening Gaps - Plotted from day close at 1659 (EST) to restart at 1800 (EST). All colors can be customised. These gaps can be very small so line widths of 3+ are recommended if the lines are to be seen on HTFs
New Day Opening Gap example:
4. New Opening Gap - Plotted from close at 1659 to Session open at 0930 (EST). These areas can possibly be closed/filled after opening at some time. The indicator will draw box to the right of price which shows if the Opening Gap is UP or DOWN. The box will change color to show up or down, or text alone can be used instead of the box. All colors can be customised.
New Opening Gap Box example:
5. 0930 Opening Line - Draws a horizontal line from the opening price at 0930 (EST) to the last bar on the chart. This is the level used to calculate the New Opening Gap. All colors can be customised.
0930 Opening Line example:

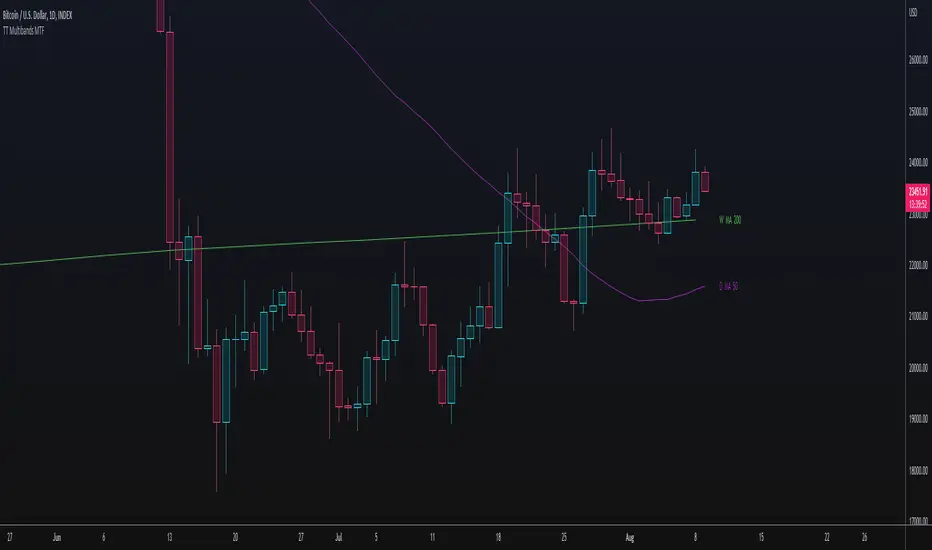
TT Multibands MTFThis Multi Moving Average Indicator is for a long list of Moving Averages:
- Simple Moving Average (SMA)
- Exponential Moving Average (EMA)
- Weighted Moving Average (WMA)
- Hull Moving Average (HMA)
- Double Exponential Moving Average (DEMA)
- Triple Exponential Moving Average (TEMA)
- Volume Weighted Moving Average (VWMA)
- Kaufman's Adaptive Moving Average (KAMA)
- Relative Moving Average (RMA)
- Arnaud Legoux’s Moving Average (ALMA)
Advantages:
- Auto Plotting the Lable: < TIMEFRAME + BAND TYPE + LENGTH >
- Multi TimeFrame (MTF)
- Usable with Custom Time Frames: You can choose any Time Frame out of your Custom Time Frame List
- "No Repainting"
- "No Gaps" on lower Chart Time Frames (HD, no "Stairs")
"No Repainting" and "No Gaps" TRUE
"No Gaps" FALSE
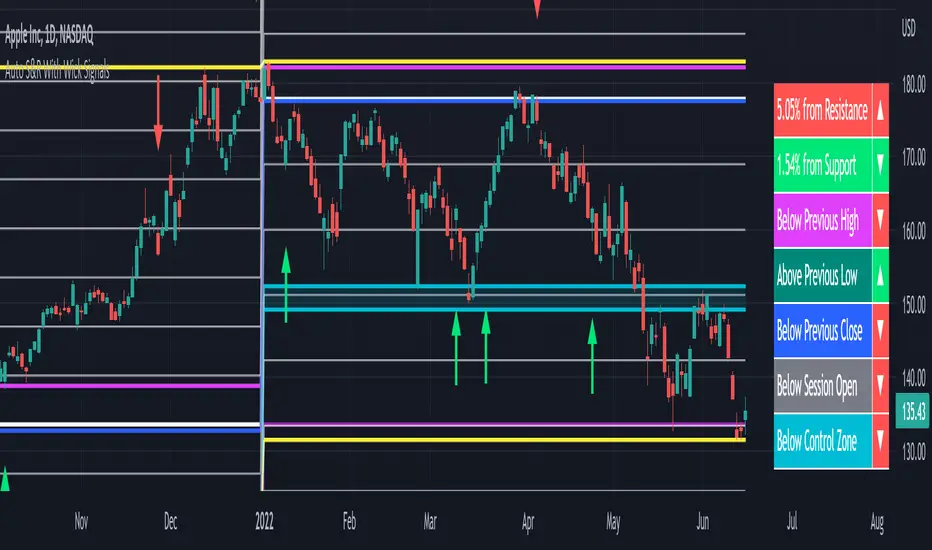
Auto Support & Resistance With Wick Signals & Percentage GapsThis auto support and resistance indicator uses percentage deviations from the previous session close to calculate levels. It provides arrows as signals when it detects 2 wicks in the last 5 bars from a support or resistance level. Includes alerts for price crossing any level as well as real time percentage gaps from current price to the next closest support and resistance level. You also have the option to set up to 3 major levels of your own for any levels that are very important on longer timeframes that you want included. Those will show on the chart as well as within your percentage gap table with color coded background. All features can be customized or turned off to suit your preferences.
SOURCE
This indicator uses the previous session close as a source by default but can be adjusted to use the previous session high or the previous session low. I find the close setting to provide the most accurate levels.
SESSION
The default setting for the previous session used is the daily session but can be adjusted to use the daily, weekly, monthly, quarterly or yearly session. Use longer sessions when looking at longer time frame charts.
SIGNALS
The signals by default are set to only show an arrow if there have been 2 bullish or bearish wicks off of a support or resistance level in the last 5 bars. This can be changed to one bullish wick off of support and one bearish wick off of resistance or it can be set to give a signal anytime a bar crosses a support or resistance level. This can be controlled in the indicator settings.
PERCENTAGE DEVIATION LEVELS
The default percentage deviation is set to 1% but can and should be adjusted according to whatever ticker you are using. For example use .25% or .5% when looking at forex intraday charts since they are not as volatile as other markets. For leveraged etfs used 1% multiplied by the leverage on the etf, so for SQQQ use 3% as it is a 3x leveraged etf. When looking at longer timeframes or highly volatile charts, set the percentage deviation to 2%, 5%, 10%, etc.
LINE COLORS
The color of the lines will change from red to green depending on if the price is above or below that level. You can customize these colors in the settings.
MAJOR LEVELS
If you have major levels of support and resistance from longer timeframes and your own charting, you can add up to 3 major levels that will show on the chart as well as show the percentage gaps in the table. The label for each major level will be colored to match the color of the line on the chart individually.
PERCENTAGE GAP TABLE
The gap table will update live with percentages to go from current price to the next closest support and resistance levels so you don’t have to calculate them manually. The position of the percentage gap table can also be changed within the indicator settings.
TURN FEATURES ON/OFF
There are 3 toggle switches so you can easily turn on or off certain features such as: the support and resistance lines, the percentage gaps table and the arrow signals.
LINE WIDTHS
You can also set the line width of all levels and the line width of the starting level within the indicator settings.
***MARKETS***
This indicator can be used as a signal on all markets, including stocks, crypto, futures and forex.
***TIMEFRAMES***
This automatic support and resistance indicator can be used on all timeframes as long as there is enough data for the session used.
***TIPS***
Try using numerous indicators of ours on your chart so you can instantly see the bullish or bearish trend of multiple indicators in real time without having to analyze the data. Some of our favorites are our Volume Spike Scanner, Volume Profile, Momentum and Trend Friend in combination with this auto support and resistance indicator. They all have real time Bullish and Bearish labels as well so you can immediately understand each indicator's trend.
Cash Gaps on a Future/CFD-ChartThe script is based on the great work of @NgUTech which very nicely prints the gaps on any given chart.
The purpose of this script is to show the gaps to futures or cfd of the underlying cash chart, because very often gap closing provides an opportunity to fade the move.
The script works in the way that the user provides the underlying chart symbol and the current spread of the instruments (cash-future/cfd) and it draws boxes where the cash-gaps are.
If you know a way to automatically calculate the spread of the two instruments, please let me know, thanks.
Michael

TC Gaps IndicatorTrade Central Gaps indicator makes it super easy to visualise gaps in your charts in any timeframe. You can also configure the width of gaps in percentage (default is 0.5%).

Bitcoin CME Gaps [NeoButane]Simple script that checks for gaps in price from CME. tickerid(x, y, sess) doesn't seem to be applying correctly for the ticker specified at the moment so there are a couple of 'gaps' peppered on lower timeframes.
Gaps are legitimate price levels to look as a support or resistance. The theory is that volume needs to be gap filled, but I currently believe it's an easy entry/exit trade for those who can move the market. I don't think there is sound analysis behind the why, but it is real.

Gappers - Closed gaps analysis
Hey all,
trading the week-end gap on monday is a well known trading technique, praised by most and ignored by others
With my script you can easily see where there have been monday gaps and see where these gaps has been closed on monday
If a gap is present the script shows a WHITE SQUARE
if a gap is present and is filled on monday candle it shows WHITE SQUARE + "GAP CLOSED"
You can also set the threshold for the gap (first parameter)
and set the threshold of how near last candle close your TP is
Defaults are 1.001 for gap and 1.001 for closed TP (for gap 1.0019 takes in account only big gaps)
Enjoy and tell me what you think
Cheers!
Lorenzo

HTF Fair Value Gaps🔍 What This Indicator Does
1. Multi-Timeframe Fair Value Gap Mapping
Displays Fair Value Gaps from:
1H
4H
Daily (optional)
These HTF FVGs are projected onto lower timeframes (5M / 15M) so you can:
trade in alignment with HTF imbalance,
avoid entering directly into opposing zones,
understand where reactions are likely.
2. Bullish & Bearish FVG Clarity
Bullish FVGs highlight areas of inefficiency below price
Bearish FVGs highlight areas of inefficiency above price
Zones are color-coded and extend forward for clarity
This helps traders immediately identify:
pullback targets in trends,
continuation zones,
areas of potential reaction or acceleration.
3. Clean, Non-Cluttered Visualization
No lower-timeframe noise
No redundant boxes
HTF gaps only — intentional and selective
This keeps execution charts readable and focused.

VYW GapsThis is a copy of the built-in Gaps indicator with the addition of drawing untouched close prices as well.
By default the lines are drawn as dashed orange lines.

Breakaway Gaps## Breakaway Gaps — Multi-Method Gap & Imbalance Mapping Tool
**Overview**
Breakaway Gaps is a gap-mapping tool designed to highlight areas where price has displaced rapidly and left potential imbalance zones on the chart. It blends multiple detection techniques into one framework, allowing traders to monitor different styles of “breakaway” behavior without clutter or manual drawing.
---
### What the script provides
- **Gap & imbalance zone detection** — identifies areas where price has moved quickly and may have left inefficiencies behind.
- **Breakaway zones** — highlights areas created by strong directional movement or structural shifts in price.
- **Automatic zone management** — highlighted areas extend forward and are removed once price interacts with them, keeping the chart clean.
- **Adjustable behavior** — all major parameters can be tuned: sensitivity, lookback length, displacement thresholds, color themes, and the number of displayed zones.
---
### Why this tool is useful
- Captures different forms of breakaway conditions in a single indicator.
- Helps traders visualize zones that may act as future reaction points, liquidity magnets, or reference areas.
- Designed to keep the chart clean by automatically maintaining and updating all zones.
- Flexible enough to support both discretionary and systematic styles.
---
### What it does *not* do
- Does **not** generate trade signals, entries, exits, stop levels, or position direction.
- Does not predict outcomes or guarantee that any highlighted zone will be respected or filled.
- Should be used as a contextual tool alongside your own analysis and risk management.
---
### Suggested applications
- Identifying potential retracement targets after strong moves
- Marking areas where liquidity may rest or where price may rebalance
- Supporting market structure, breakout, or liquidity-based trading frameworks
- Higher-timeframe context zones combined with lower-timeframe execution
---
### Customization
The tool offers full user control over sensitivity, zoning behavior, highlight style, and display limits, so traders can adapt it to different markets and timeframes.
---
**Disclaimer**
This tool is for chart visualization only. It does not provide financial advice or guaranteed outcomes. Always use proper risk management and your own judgment when trading.

ORB + Fair Value Gaps (FVG/iFVG) Suite with Daily 50% MidlineA complete smart-money–focused price-action toolkit combining the New York Open Range Breakout (ORB), ICT-style Fair Value Gaps, Inverted FVGs, and a dynamic Daily 50% Midline.
Designed for traders who want a clean, fast, and highly visual way to track liquidity, imbalances, and intraday directional bias.
📌 Key Features
1. NY Session ORB (09:30–09:45 New York Time)
Automatically plots:
ORB High
ORB Low
Labels for ORB high/low
Optional 5-minute chart restriction
Lines extend forward for easy reference
Used to identify breakout conditions, liquidity sweeps, and directional bias into the morning session.
📌 2. ICT-Style Fair Value Gaps (FVGs)
Full automated detection of bullish & bearish FVGs based on the classic 3-candle displacement structure:
Bullish FVG: high < low
Bearish FVG: low > high
Each FVG is drawn as a box with:
Custom colour
Custom border style (solid, dashed, dotted)
Automatic extension to the right until filled
Optional size text showing the gap in points (font size/colour adjustable)
Adjustable max lookback for performance
📌 3. Inverted FVGs (iFVGs)
Once price fully fills an FVG, it automatically becomes an iFVG, shown with:
Custom iFVG colour
Custom border style
Extension to the right
Once price trades through the zone from the opposite side, the iFVG is considered “consumed” and:
It stops extending
And optionally auto-deletes based on user settings
This makes it easy to track meaningful imbalances that turn into liquidity pockets.
📌 4. “Show Only After ORB” Filter
Optionally hide all FVGs/iFVGs formed before the ORB completes.
This is especially useful for intraday strategies focused on NY session structure only.
📌 5. Daily 50% Midline (OHLC Midpoint)
A dynamic, always-updating midpoint of the current daily candle:
Mid = (Daily High + Daily Low) / 2
Features:
Custom colour
Dashed styling
Extends left and right as a horizontal ray
Updates live as the daily candle forms
Great for bias filters, mean reversion, and daily liquidity zones.
📌 6. Performance-Optimized (Fast!)
Built with:
Fully configurable max lookback
Memory-efficient arrays
Auto-cleaning of old FVG/iFVG objects
Lightweight daily midline recalculation
This allows extremely fast rendering even on 1-minute charts.
📌 7. Alerts
Includes a clean alert condition:
Price returned to a Fair Value Gap
Works for both bullish and bearish FVG revisits.
🎯 Who This Indicator Is For
This tool is ideal for traders who use:
ICT / SMC concepts
Liquidity-based trading
ORB strategies
Imbalance-driven price action
Intraday or NY session-focused setups
Futures, crypto, forex, and equities
🎁 Summary
This indicator gives you:
A clean ORB framework
Automatic, dynamic FVG and iFVG analysis
Real-time daily candle context
Customizable visuals
Powerful session filtering
Efficient performance
All in one clean, intuitive package built for real-time decision making.

Open Close Trend ChangeOpen Close Trend Change
This indicator identifies potential trend reversal points based on the Close-Open Gap methodology. It detects specific two-candle patterns followed by a confirmation candle that breaks a key gap level, signaling a potential trend change. The indicator also provides visual confirmation signals when follow-through occurs.
What is a Trend Change?
A Trend Change occurs when:
Two consecutive candles of the same color form a specific pattern
No additional pattern repetition occurs afterward
A candle in the opposite direction closes beyond the gap level
Optional: The next candle confirms the move with a wick touching the level
This creates a Close-Open Gap between the two setup candles that acts as a critical decision level.
Pattern Rules
Long Trend Change (Bullish Reversal)
Setup Requirements:
Two consecutive down-close candles (close < open)
Second candle must make a lower low AND lower high than the first candle
No additional qualifying two-candle sequence follows immediately
Gap Level: Close price of the first candle
Confirmation: An up-close candle (close > open) closes above the gap level
Follow-Through Confirmation (Green Triangle):
The candle immediately after the gap break closes above the gap level
The wick (low) of this candle touches or goes below the gap level (testing support)
Short Trend Change (Bearish Reversal)
Setup Requirements:
Two consecutive up-close candles (close > open)
Second candle must make a higher high AND higher low than the first candle
No additional qualifying two-candle sequence follows immediately
Gap Level: Close price of the first candle
Confirmation: A down-close candle (close < open) closes below the gap level
Follow-Through Confirmation (Red Triangle):
The candle immediately after the gap break closes below the gap level
The wick (high) of this candle touches or goes above the gap level (testing resistance)
Key Features
Multi-Timeframe Support: Calculate trend changes on any timeframe while viewing on your preferred chart timeframe
Customizable Lookback: Adjust how far back the indicator searches for patterns
Visual Clarity: Distinct colors for bullish (green) and bearish (red) trend changes
Confirmation Triangles: Visual indicators when follow-through occurs with proper level retest
Selective Display: Toggle long or short signals on/off independently
Extended Lines: Optional line extension to track levels into the future
Smart Pattern Recognition: Automatically filters out superseded patterns when multiple setups occur in sequence
Parameters
SETTINGS
Bars Lookback (default: 50): Number of bars to analyze for trend change patterns
Timeframe (default: Daily): Timeframe used for pattern detection
VISUAL SETTINGS
Show Long Trend Changes: Display bullish reversal signals
Show Short Trend Changes: Display bearish reversal signals
Long TC Color: Color for long trend change lines (default: green)
Short TC Color: Color for short trend change lines (default: red)
Line Width: Thickness of trend change lines
Extend Lines Right: Extend lines to the right edge of the chart
Show Confirmation Triangles: Display triangles when follow-through confirmation occurs
Understanding Confirmation Triangles
The confirmation triangles are a powerful feature that identifies high-probability setups:
Why They Matter:
When the candle after a gap break closes in the same direction AND retests the level with its wick, it demonstrates:
Commitment: Market participants are willing to continue in the new direction
Support/Resistance: The gap level is now acting as support (long) or resistance (short)
Validation: The level has been successfully flipped
Visual Indicators:
Green Triangle (pointing up): Appears below bullish follow-through candles
Red Triangle (pointing down): Appears above bearish follow-through candles
Triangles only appear when both close and wick conditions are met
Trading Application
The Close-Open Gap acts as a decision level where price previously showed commitment to a direction. When this gap is broken by a candle closing on the opposite side, it suggests:
Previous directional momentum has weakened
Market participants are willing to push through the gap
A potential shift in short-term trend direction
When confirmed with a triangle: Higher probability of continuation
Example Use Cases
Long Trend Change:
Wait for two down-close candles forming lower lows (red line appears)
Enter long when up-close candle breaks above the gap
Stronger signal: Green triangle appears when next candle retests and closes above
Use gap level as initial stop-loss reference
Consider tighter stops when confirmation triangle is present
Short Trend Change:
Wait for two up-close candles forming higher highs (red line appears)
Enter short when down-close candle breaks below the gap
Stronger signal: Red triangle appears when next candle retests and closes below
Use gap level as initial stop-loss reference
Consider tighter stops when confirmation triangle is present
Pattern Recognition Logic
Rolling Window Approach:
When three or more consecutive same-colored candles occur, the indicator uses only the last two qualifying candles as the setup. This ensures:
Only the most recent pattern is considered
Earlier setups in a continuous sequence are automatically superseded
Reduced chart clutter from redundant signals
Example: If you see 4 consecutive down-close candles where each makes lower lows and lower highs, only the gap between the last two will be marked.
Important Notes
Lines without triangles indicate basic trend change setups
Lines with triangles indicate confirmed setups with follow-through
Confirmation triangles appear only when specific wick and close conditions are met
Not all gap breaks will generate confirmation triangles
Trend changes indicate potential reversals but are not guaranteed
Always combine with other technical analysis tools and proper risk management
Consider overall market context and trend direction
Works best when aligned with higher timeframe trend structure
How It Works
The indicator continuously monitors the selected timeframe for valid two-candle patterns. The process:
Scans for two consecutive same-colored candles meeting specific criteria
Filters out patterns that are immediately followed by another qualifying setup
Draws a horizontal line at the gap level (close of first candle)
Monitors for a candle closing beyond the gap in the opposite direction
Checks the following candle for confirmation (close + wick retest)
Displays a triangle when full confirmation occurs
Best Practices
Use confirmation triangles as higher-confidence entry signals
Combine with volume analysis for additional confirmation
Consider multiple timeframes: gaps on higher timeframes often more significant
Watch for confluence with other support/resistance levels
Gaps that align with round numbers or key levels tend to be more reliable
Monitor how price behaves after the confirmation triangle appears
Disclaimer
This indicator is a pattern recognition tool for educational purposes. It does not predict future price movements and should be used as part of a comprehensive trading strategy with proper risk management. Past performance does not guarantee future results. Confirmation signals improve probability but do not eliminate risk.

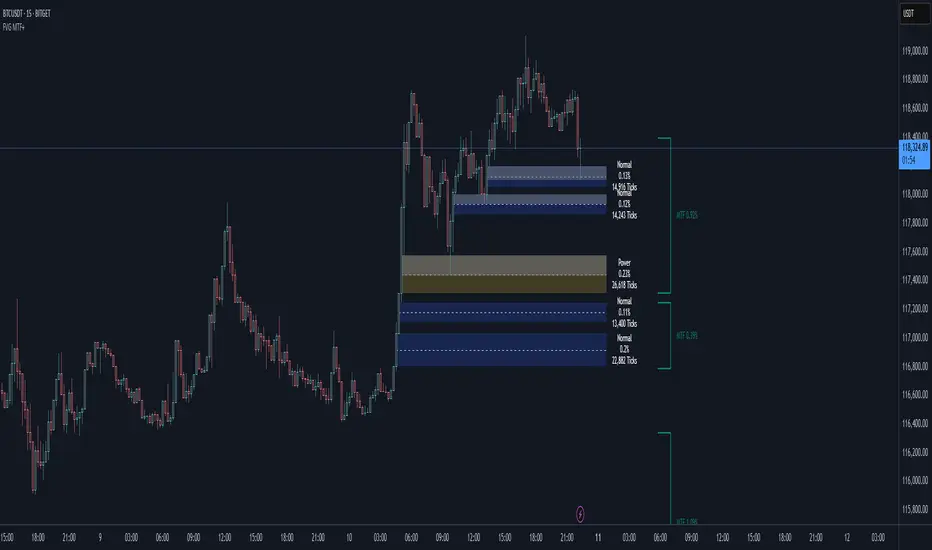
Smart Fair Value Gaps (FVG) + MTF [Intelligent]This indicator elevates the standard Fair Value Gap (FVG) concept by introducing an intelligent classification system, advanced filtering, and integrated Multi-Timeframe (MTF) analysis. It is designed to move beyond simple FVG detection, providing traders with a deeper, more contextual understanding of market imbalances. By analyzing the characteristics of each FVG relative to recent historical data, the script helps to distinguish between high-momentum gaps and potential exhaustion points.
What is a Fair Value Gap (FVG)?
A Fair Value Gap, or price imbalance, is a three-candle pattern where the wick of the first candle does not overlap with the wick of the third candle. This creates an inefficient price delivery area that the market often seeks to revisit or "mitigate" in the future.
Bullish FVG: The space between the high of the first candle and the low of the third candle in a strong upward move.
Bearish FVG: The space between the low of the first candle and the high of the third candle in a strong downward move.
Key Features
Intelligent FVG Classification: This is the core of the indicator. Instead of treating all FVGs equally, it classifies them into four distinct types based on their size and the volume on which they formed, relative to a dynamic historical baseline.
🟡 Power FVG: High Size & High Volume Ratio. Indicates a gap formed with strong conviction and momentum, often a good continuation signal.
🟣 Exhaustion FVG: Low Size & High Volume Ratio. Suggests a high amount of effort (volume) for little price movement, which may indicate a trend is losing steam.
🟠 Absorption FVG: High Size & Low Volume Ratio. A significant price gap was created with relatively little volume, suggesting a lack of resistance and potential for price to move easily through that area.
🔵 Normal FVG: Any FVG that does not meet the criteria for the other classifications.
Multi-Timeframe (MTF) Analysis: Plot FVGs from a higher timeframe directly onto your current chart. These HTF zones often act as powerful areas of support or resistance and provide crucial context for lower-timeframe price action.
Advanced Filtering Suite: Gain complete control over which FVGs are displayed to reduce chart noise and focus on what matters.
Minimum Size Filter: Ignores insignificant micro-gaps by setting a minimum size requirement as a percentage of price.
EMA Trend Filter: Only display FVGs that align with the broader market trend (e.g., only show Bullish FVGs when price is above the 200 EMA).
Volume Filter: Qualify FVGs by requiring them to form on volume that is a specified multiple of its moving average, ensuring they are backed by significant market participation.
Comprehensive Customization: Tailor every aspect of the indicator to fit your personal trading style and chart aesthetic.
Mitigation Rules: Define precisely when an FVG is considered "mitigated" and no longer valid. Choose from a full fill, a 50% fill (Consequent Encroachment), or a simple wick touch.
Visuals & Data: Customize colors, borders, and box extensions. Toggle visuals for partial fills and the 50% CE line.
Data Labels: Display key information directly on the FVG boxes, including size in percentage and ticks, the volume of the FVG candle, and the volume ratio compared to the average.