Pivot Liquidity Sweep + SignalsCore Functionalities:
Sweep Signals:
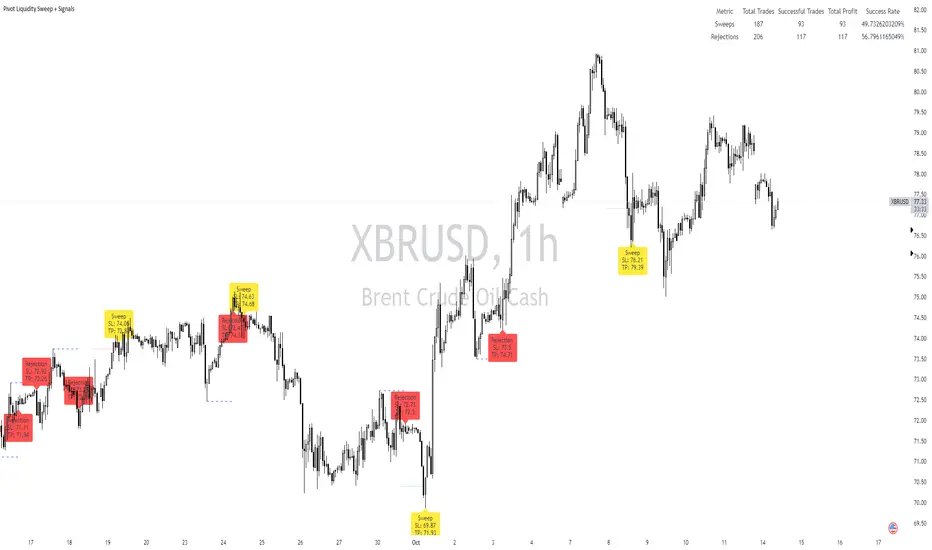
The indicator identifies sweeps of liquidity by detecting when price exceeds recent pivot highs (swing highs) or pivot lows (swing lows) and then reverses direction. It draws attention to these scenarios by labeling them on the chart.
For bullish sweep signals, the entry point is the closing price of the sweep candle, with the stop loss placed at the highest point between the sweep candle and the previous candle.
For bearish sweeps, the entry point is similarly identified, with the stop loss being the lowest price of the sweep candle and the candle before it. The profit target is dynamically set to the low or high of the closest valid pivot depending on the direction of the trade.
Rejection Signals:
Rejection signals are identified when price attempts to break a pivot high or low but fails, causing a rejection.
Bullish rejections involve price trying to break a pivot low but closing back above it, indicating potential for a bounce.
Bearish rejections follow a similar pattern, with price attempting to break a pivot high but failing to hold above it, signaling a potential bearish move.
High-Precision Intrabar Data:
The "Intrabar Precision" feature allows the indicator to use lower timeframe data to accurately plot sweeps and rejections, providing traders with precise entry and exit points.
The intrabar settings are particularly useful for traders looking for high-precision trades, such as scalpers who want to capture small yet consistent moves.
ATR and Percentage-Based Filters:
The indicator allows for customizable filters to ensure signals meet certain thresholds before being validated. Traders can use ATR (Average True Range) or percentage-based conditions to filter out low-quality signals, ensuring that the trades captured have enough volatility or price movement potential.
Dashboard:
The built-in dashboard provides a quick overview of trades executed using the indicator, displaying metrics such as the total number of sweep and rejection trades, their success rates, and total profit in points.
The dashboard is color-coded for easy reading and offers traders insights into the overall performance of their strategy, helping with ongoing evaluation and optimization.
Labeling and Alerts:
Every time a sweep or rejection signal is detected, the indicator automatically labels the chart to help traders quickly identify the trading opportunities.
Alerts are also generated for each trading signal, providing the trader with real-time notifications, which can be useful for those who are not constantly monitoring their charts.
Stop Loss and Target Adaptation:
The stop loss levels are adjusted dynamically based on the recent pivot points, and the target profit is derived from valid subsequent pivot levels to ensure realistic and efficient trade exits.
Search in scripts for "pivot"
Pivot Length BandsPivot Length Bands Indicator
Description:
The Pivot Length Bands indicator is designed to visualize price volatility based on pivot points and ATR-adjusted pivot points. I. These bands can help traders identify potential support and resistance levels and assess the current volatility of the market.
Inputs:
Swing Length: The length of the swing used to calculate the pivot points and average true range.
Pivot Length Left Hand Side: The number of candles to the left of the current pivot point to consider when calculating the pivot high and low.
Pivot Length Right Hand Side: The number of candles to the right of the current pivot point to consider when calculating the pivot high and low.
Usage:
Traders can use the bands as potential levels for placing stop-loss orders or profit targets.
The width of the bands adjusts dynamically based on the current volatility of the market.
Note:
This indicator is best used in conjunction with other technical analysis tools and should not be relied upon as a standalone trading signal.
EXAMPLE 1:
Entry:
Exit:
EXAMPLE 2:
Entry:
Exit:

Pivot Point Trend LineThis Indicator simply draw lines between high pivot points and low points.
in the code by default its used tradingview default ta.pivothigh and ta.pivotlow function to get the high and low points.
it will generate recent 4 lines of high and low pivot points.
you can change the no of days for both highs and lows pivot points.
this script is not generating any buy or sell signals its just autodraw and connect 2 pivot points. so you dont have to do it manually.


Pivot Points by Pangusandhai.comPivot Points by Pangusandhai.com
This PP will usefull only for pangusandhai.com clients.
because they only know about how to use it for intraday, swing & investment purpose.

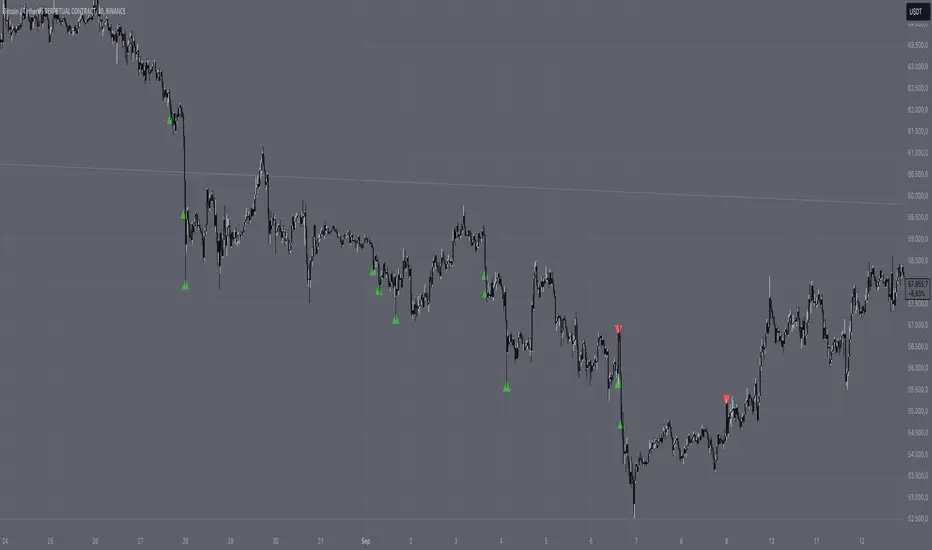
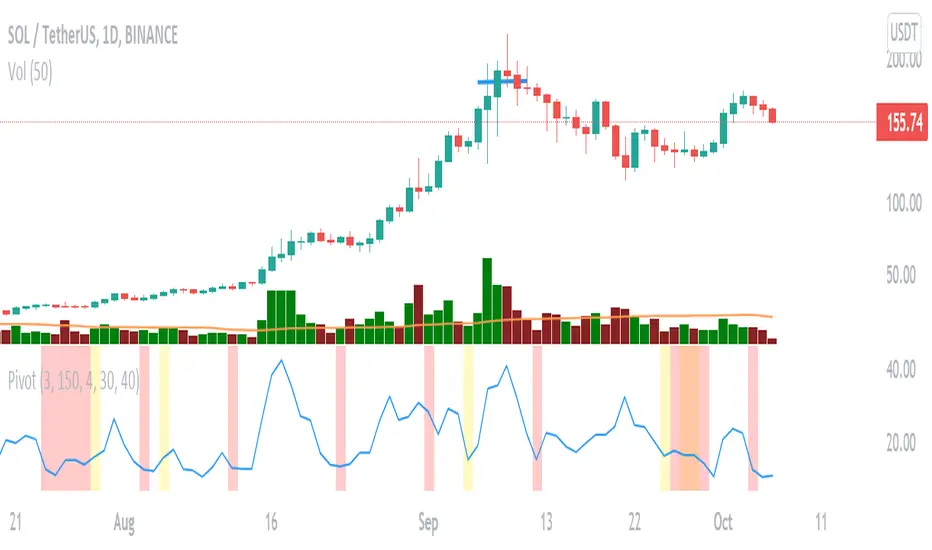
Pivot Volume ConfluenceThe Pivot Volume Confluence indicator is designed to help traders identify significant pivot points (local highs and lows) that are accompanied by increased trading volume. This combination can signal important market turning points and provides valuable insights into potential support and resistance areas.
Key Features:
• Pivot Point Identification: Automatically detects local highs and lows on the chart based on a customizable pivot length.
• Volume Analysis: Compares the volume at the pivot point with the average volume of the last N bars to recognize significant volume spikes.
• Timeframe-Based Adjustment: Automatically adjusts the indicator parameters according to the current timeframe for optimal performance across different timeframes.
• Custom Settings: Allows you to set your own values for pivot length and volume multiplier to tailor the indicator to your trading strategy.
• Visual Markers: Clearly highlights significant pivot points with high volume using colored symbols on the chart.
• Alerts: Integrates alert functionalities to notify you when important pivot points are detected.
Settings:
• Use Custom Settings: Enable this option to use your own parameters instead of automatic adjustments.
• Custom Pivot Length: Set the number of bars to be used for determining pivot points.
• Custom Volume Multiplier: Define the factor by which the average volume is multiplied to set the threshold for significant volume.
• Show Settings in Chart: Displays the current indicator settings directly on the chart.
How to Use the Indicator:
1. Add to Chart:
• Add the “Pivot Volume Confluence” indicator to your desired financial instrument.
2. Adjust Settings:
• Adjust the settings according to your needs or use the preset default values.
• Enable “Use Custom Settings” to input your own values for pivot length and volume multiplier.
3. Interpret the Signals:
• Red downward triangles mark pivot highs with significantly high volume and may indicate potential downward reversal points.
• Green upward triangles mark pivot lows with significantly high volume and may indicate potential upward reversal points.
• Use these markers to identify entry and exit points or to confirm existing trading positions.
4. Set Up Alerts:
• Set up alerts to be notified when a significant pivot point occurs.
• This allows you to react promptly to market movements without having to monitor the chart constantly.
Notes:
• Delay in Pivot Detection: Due to the calculation method, pivot points are recognized only after confirmation by subsequent bars. This leads to a natural delay that should be considered when interpreting the signals.
• Adjusting the Volume Multiplier: A lower multiplier will result in more signals, while a higher multiplier will highlight only the most significant volume spikes.
• Compatibility: The indicator is universally applicable and suitable for various markets such as stocks, forex, commodities, and cryptocurrencies.
• Performance: Using very short timeframes or having many charts open simultaneously may affect performance.
Benefits:
• Deep Market Analysis: By combining price and volume data, you gain a more comprehensive view of market activities.
• Flexibility: The ability to adjust settings allows you to fine-tune the indicator to your specific trading strategy.
• Notifications: With integrated alerts, you won’t miss important signals and can make timely trading decisions.
Disclaimer:
Please note that trading financial instruments involves risks and is not suitable for all investors. Past performance is not indicative of future results. Use this indicator as part of a comprehensive trading strategy and always conduct your own analysis.
Pivot HL Trading SetupThis simple script base on function of Pivot High Low to plot Trading Setup on chart with detail as below:
2. Trading Setup
2.1 Buy setup
+ New Pivot Low is plotted
+ Entry Long at market price.
+ Stoploss at Pivot Low
+ Takeprofit at Pivot High
+ Buy setup invalidation when price crossed Pivot High or Pivot Low
2.1 Sell setup
+ New Pivot High is plotted
+ Entry Short at market price.
+ Stoploss at Pivot High
+ Takeprofit at Pivot Low
+ Sell setup invalidation when price crossed Pivot High or Pivot Low

Pivot Point (MM)It helps indicate the contraction point so that we can have a low-risk entry of a buy point.
It followed the strategy of Mark Minervini.
changing the lookback period input to change the percentile
changing the Pivot Length to decide how many bars you would consider as a pivot
changing the Close range to decide in how much percentage does the close range you would consider as a pivot
The percentile rank is represented in the colour of the background, you can alter how low you want to set to indicate lowering volatility.
The blue line shows the percentage range in ( pivot length) days/bars
The coloured background shows the signal of pivot point forming
Pivot and liquidation lines [LM]Hello traders,
I would like to introduce you pivot and liquidation zones. Levels are rendered based on pivot points. We are looking for confluence of liquidation lines in order to have the gist where the market could go. calculation for the liquidation lines are taken from Bybit. It's good to look for line clusters. Indicator doesn't tell you where the market will go but it tells you where are the potential zones of position liquidations
There are several settings:
pivot setting - ordinary pivot lines setting
first leverage - setting for first leverage
second leverage - setting for second leverage
third leverage - setting for first leverage
fourth leverage - setting for second leverage
Hope you will enjoy it.

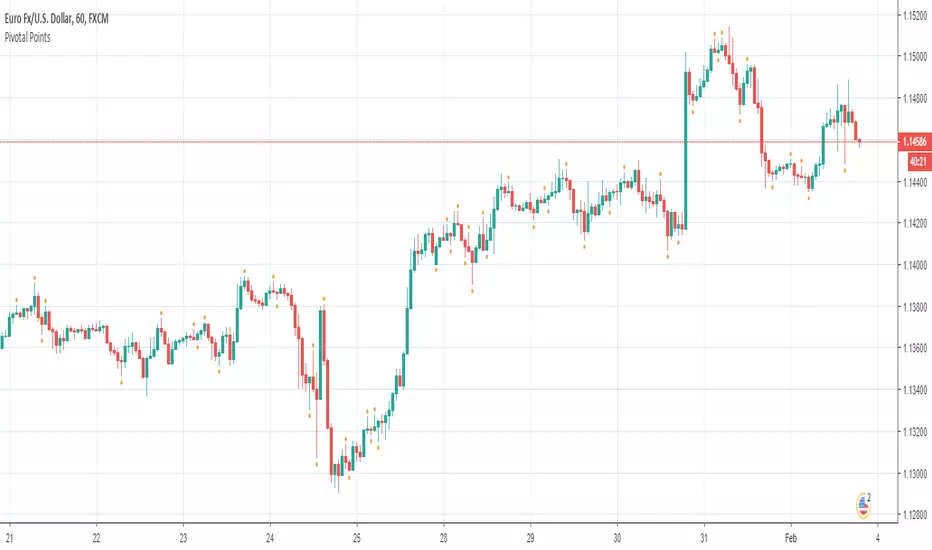
Pivot Points by stelmaxFor pivot levels, we use different definitions of the pivot point. In fact, there are three different methods to calculate the reference level using this method.
For these pivot points, we set the variable x, the value of which depends on whether the open is higher or lower than the close.
If the close is less than the open, x = H + 2L + C.
If the close is higher than the open, x = 2H + L + C.
When open equals close, x = H + L + 2C
This final value will be one of the most commonly used designs. This is because, as FX is a 24 hour market, the open is almost always equal to the close.
If you look at the daily chart throughout the week, the close and the open are really just names. This is in contrast to the stock market, where the open and close are very different things, separated by time and price.
Once we have the pivot point and the x-value, we use it to compute the pivot point of the base P.
P = x / 4
Support and resistance levels are also calculated from x (pivot points do not use more than one support and resistance level).
S₁ = x / 2 - H
S₂ = x / 2 - L
Thus, we have seen how to calculate different types of Pivot Points indicator. But how can we now use them in our trade?
First, we can use our anchor point to define the general direction. - If the existing market price is above the key PP level, it suggests a bullish trend.
- If the market is below the key PP level, it suggests a bearish trend.
Pivot levels are set according to the value of the previous trading day.
+ If the price is below the PP pivot level - priority is given to sell deals, if higher - to purchases
+ Confirmatory signals can be candlestick patterns and the Stochastic indicator
+ The SL level can be set either for a signal candle or for the nearest level
+ Target - movement to the nearest support / resistance level
Keep in mind that the Pivot Level Indicator is not a complete trading system!
Remember that there are no indicators in trading that do not make mistakes, Pivot Points, like any others, require confirmation of their signals. When building your own trading system, use several indicators.
Observe Money Management. Never risk more than 2 percent of your capital in one trade. This approach will protect you from ruin and will allow you to consistently make money on Forex using the Pivot Point.
Be clear about your trading strategy. If, according to the pivot point strategy, you need to open a deal - open, if you fix the result - fix it, and it doesn't matter if you are in the black or not. Only following the rules of Pivot Points "from and to" will allow you to earn.

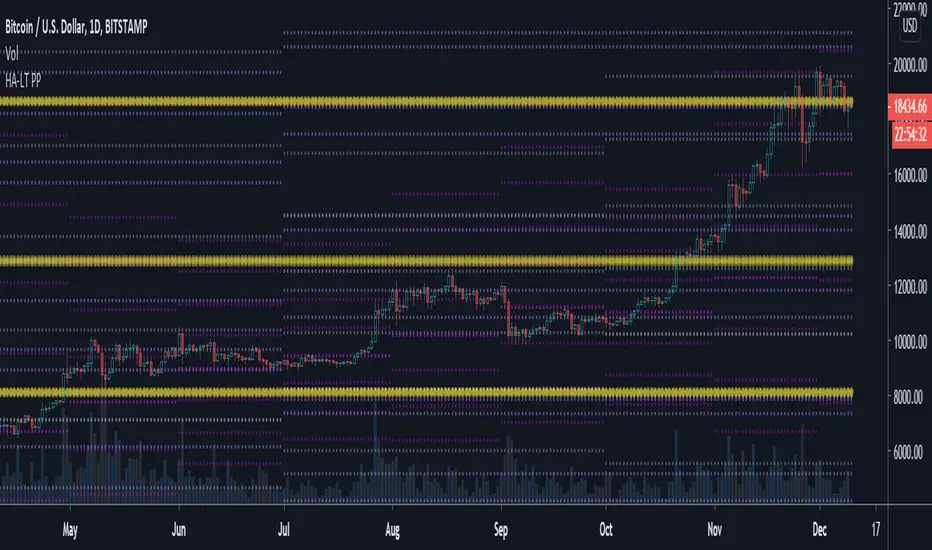
Heikin Ashi Pivot PointsPivot points are price levels that are calculated based on previous high, low, and close values. Pivot point levels include the pivot, 4 resistance levels (R1, R2, R3, R4), and 4 support levels (S1, S2, S3, S4). Pivot points are used as support and resistance levels.
This indicator includes the following pivot points:
6M (6 month)
Yearly
Weekly HA (Heikin Ashi)
Monthly HA (Heikin Ashi)
Quarterly HA (Heikin Ashi)
6M HA (6 month Heikin Ashi)
Yearly HA (Heikin Ashi)
Pivot Support / Resistance Finder [JV] Hi Traders,
this is the result of the many feedback messages I received about this first draft of this script. It has significant updates:
The use of Arrays.
Using PineCoders Coding Conventions for Pine: www.pinecoders.com
Display up to 6 Support / Resistance levels.
Line colors and Labels change according to their status (Support or Resistance).
Moved Labels to the future for better overview of the Prices / Levels.
There are many configurable options. Feel free to explore them all.
If you should notice a bug or something of a kind, feel free to contact me.
All feedback is very welcome as well.
Request might be considered but don't take them for granted please.
Pivot Points
Pivot Points are considered to be levels which may become significant levels (Support / Resistance) in the future. They can be interpreted in various ways, but fact is that price, when it comes close to a previous Pivot Point, can mess with your head. Prices often returns to previous Pivot Points, more than once even a few times, as shown below.
I hope you find this useful.
Happy Trading!

Pivot Points QuarterlyQuarterly only
What is a Pivot Point?
A pivot point is a technical analysis indicator, or calculations, used to determine the overall trend of the market over different time frames. The pivot point itself is simply the average of the high, low and closing prices from the previous trading day. On the subsequent day, trading above the pivot point is thought to indicate ongoing bullish sentiment, while trading below the pivot point indicates bearish sentiment.
The pivot point is the basis for the indicator, but it also includes other support and resistance levels that are projected based on the pivot point calculation. All these levels help traders see where the price could experience support or resistance. Similarly, if the price moves through these levels it lets the trader know the price is trending in that direction.
When the price of an asset is trading above the pivot point , it indicates the day is bullish or positive.
When the price of an asset is trading below the pivot point , it indicates the day is bearish or negative.
The indicator typically includes four additional levels: S1, S2, R1, and R2. These stand for support one and two, and resistance one and two.
Support and resistance one and two may cause reversals, but they may also be used to confirm the trend. For example, if the price is falling and moves below S1, it helps confirm the downtrend and indicate a possible continuation to S2.
This Script includes the Mid Pivot Points , Open and Close levels

Pivot Points Monthly & YearlyMonthly and Yearly only
What is a Pivot Point?
A pivot point is a technical analysis indicator, or calculations, used to determine the overall trend of the market over different time frames. The pivot point itself is simply the average of the high, low and closing prices from the previous trading day. On the subsequent day, trading above the pivot point is thought to indicate ongoing bullish sentiment, while trading below the pivot point indicates bearish sentiment.
The pivot point is the basis for the indicator, but it also includes other support and resistance levels that are projected based on the pivot point calculation. All these levels help traders see where the price could experience support or resistance. Similarly, if the price moves through these levels it lets the trader know the price is trending in that direction.
When the price of an asset is trading above the pivot point, it indicates the day is bullish or positive.
When the price of an asset is trading below the pivot point, it indicates the day is bearish or negative.
The indicator typically includes four additional levels: S1, S2, R1, and R2. These stand for support one and two, and resistance one and two.
Support and resistance one and two may cause reversals, but they may also be used to confirm the trend. For example, if the price is falling and moves below S1, it helps confirm the downtrend and indicate a possible continuation to S2.
This Script includes the Mid Pivot Points, Open and Close levels
Pivotal Points, Wyckoff Trend Tracking Trading SystemPivotal Points by Wyckoff Trend Tracking Trading System
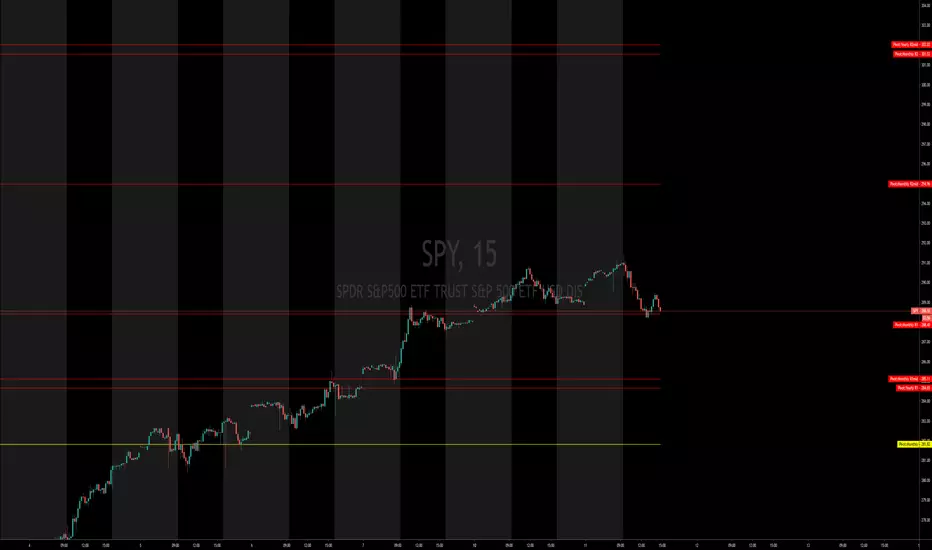
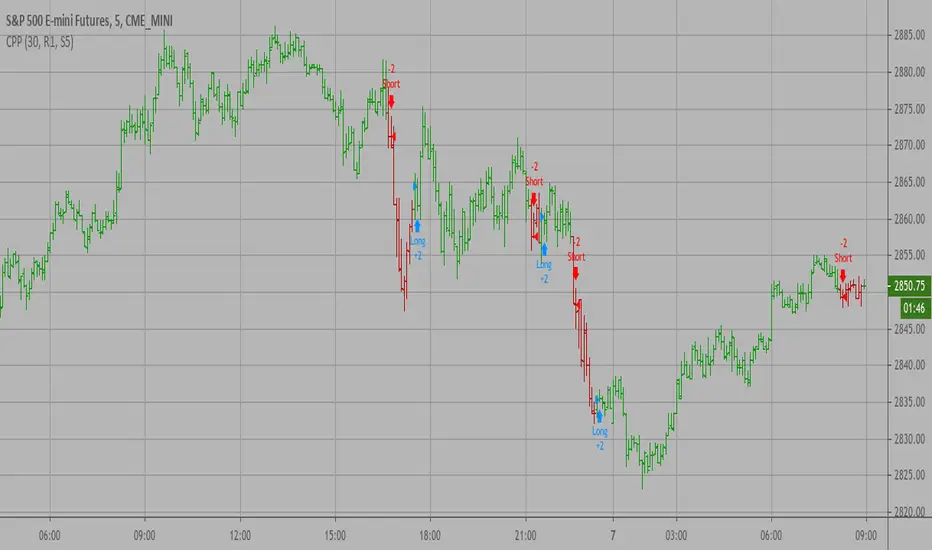
Pivot Points Strategy🟢 It enters long trades near support zones (S1–S3)
🔴 It enters short trades near resistance zones (R1–R3)
🎯 All positions aim to exit at the central pivot (P).
🚫 It avoids trading when price crosses the pivot during the bar.
🔄 Strategy resets when a new pivot is calculated.
📊 Supports pyramiding up to 5 positions for scaling in.

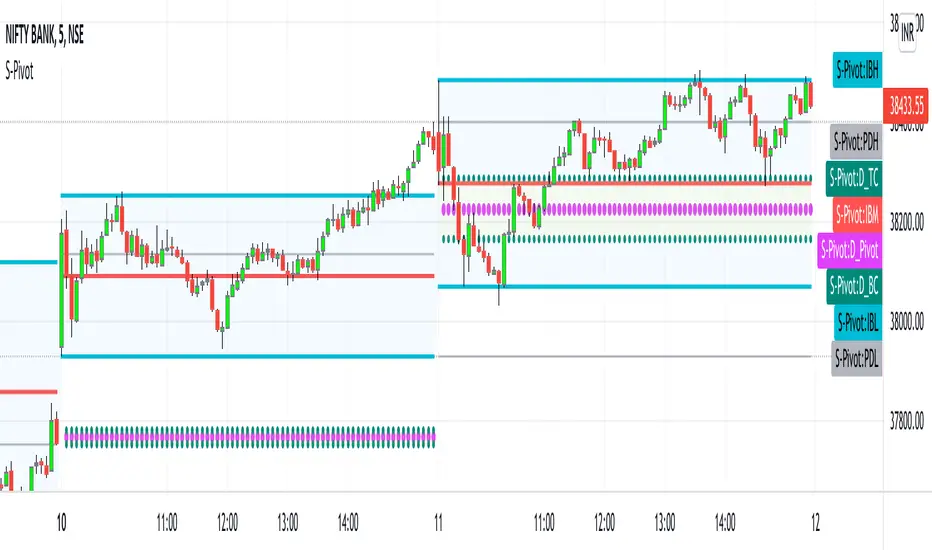
CPR_Previous Day Ranges_Initial BalanceHello Traders,
This script best works on Indian Index (Tested on BANKNIFTY & NIFTY)
This indicator can be used only for day trading (intraday: ex: 5min, 15min Timeframes) on indices.
This script helps to plot
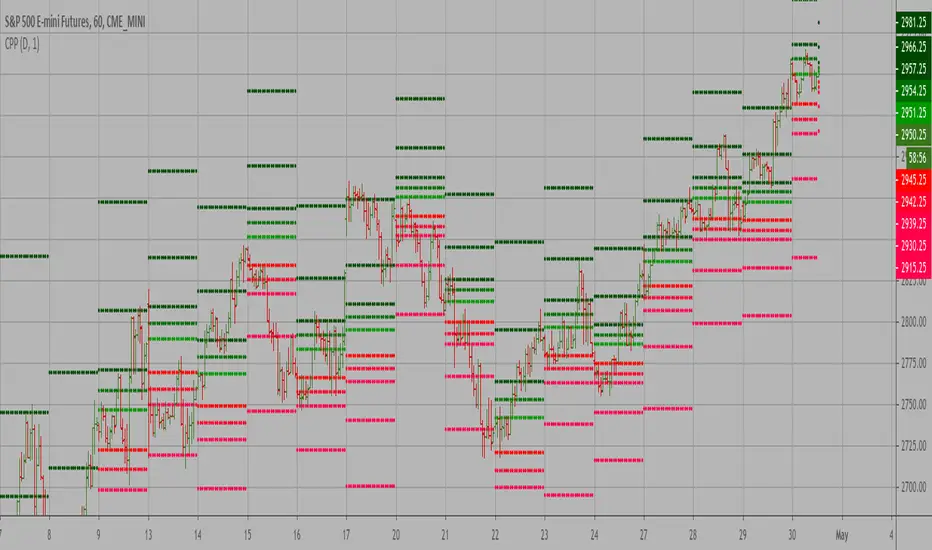
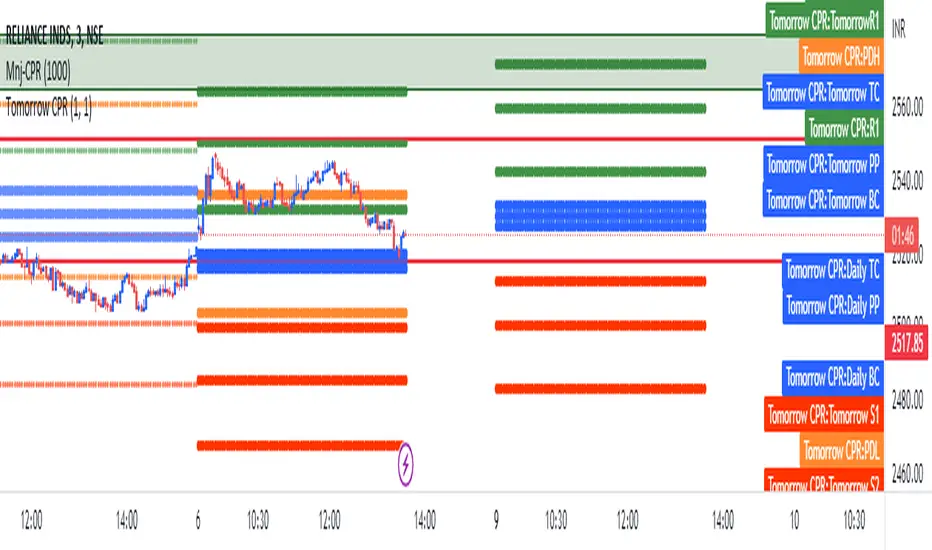
1. Central Pivot Range(CPR)
2. Previous Day Ranges (PDH & PDL)
3. Initial Balance(IB)
brief description of indicators:
1. CPR: Central Pivot Range --> This indicator helps to identify key price points to set up trades. CPR is beneficial for intraday trading.
2.Previous Day Ranges: These ranges will help to understand the current day market.
PDH: Previous Day High value on current day
PDL: Previous Day Low value on current day
3.Initial Balance(IB):This indicator will help in day trading. IB will plot current day first 1hr high, low & mid values.
Disclaimer: This indicator can be used as refrence only. This has been tested on Banknifty and Nifty indices on day trading 5 minutes and 15 minutes timeframe. Understand yourself to knowledge of different trading methods.
Pivot Point BreakoutThis is a strategy taken from Perry Kaufman's book, Trading Systems and Methods.
Just like the title says, it's a breakout strategy. It works by buying when the current high is higher than the last pivot high, and selling when the low is lower than the last pivot low.
It does not have a good success probability, and relies on the good reward to risk ratio. Definitely not recommended for someone with weak hands.

Pivot point labelThis script provides the user with a label containing the high and low pivot points from a period defined by the user.

Camarilla Pivot Points Backtest Pivot point studies highlight prices considered to be a likely turning point
when looking at values from a previous period, whether it be daily, weekly,
quarterly or annual. Each pivot point study has its own characteristics on
how these points are calculated.
Red color = Sell
Green color = Buy
WARNING:
- For purpose educate only
- This script to change bars colors.
Camarilla Pivot Points Strategy Pivot point studies highlight prices considered to be a likely turning point
when looking at values from a previous period, whether it be daily, weekly,
quarterly or annual. Each pivot point study has its own characteristics on
how these points are calculated.
Red color = Sell
Green color = Buy
WARNING:
- For purpose educate only
- This script to change bars colors.

Camarilla Pivot Points V1 Pivot point studies highlight prices considered to be a likely turning point
when looking at values from a previous period, whether it be daily, weekly,
quarterly or annual. Each pivot point study has its own characteristics on
how these points are calculated.
WARNING:
- For purpose educate only