PivotBoss PEMA MethodPivotBoss PEMA method. Very useful if you combine it with other PivotBoss ADR and PivotBoss Pivots
Search in scripts for "pivot"
Updated Floor Pivots @scorpiomanojFRMThis features intraday pivots for Indian markets.
The total trading time per day is 375 minutes.
This is bifurcated into 3 zones of 125 minutes each.
Pivots constructed based on prior 125 minutes which are called intraday pivots.
These intraday pivots provide key clues on the possible direction of the markets.
These can be used as supports and resistances in conjunction with higher time frame pivots for scalping / intraday trades.

Strategy - Bobo's Pivot ATR SwingHi there, welcome to my pivot ATR swing bot. I put this out there with source code hidden to see what ideas others have to use it. Also if there are any coders of trading systems out there who wanted to work with me to put this into a form that could trade automatically we could both use... I'd welcome that kind of collaboration and will happily share the underlying rules of this and the more highly developed version that isn't public.
But as it is, the signals are free for all, use them as you wish and at your own risk. If you want to discuss the code, strategy or ideas, I'm around fairly regularly just message.
The bot is fairly simple design that will give you signals for long and short intraday/week on equity futures / CFDs / ETFs. You'll see it backtests fairly well on an hourly SPX500 chart as configured. You will need to set up certain parameters to account for any different timeframes and markets you wish to trade. For me it's most effective pick out a few good swing trades per week in equity futures. However part of the idea of putting this in the public domain is to see if other people will have good but different ideas how to use it. Please share with me if so :).
The basic concept is a series of 3 lines that define the area and movement we wish to trade. The daily pivot is the central line (blue). We are looking to capture reversions to this middle line from extremes (red and green). Therefore the bot will signal exit at the close of every candle that has passed through the pivot.
Entry is decided by the outer bands around the blue line. Red is the top band, green the bottom. As configured, these are simply placed a daily ATR value apart, centred around the pivot. You can change this quite a lot though, so let's go through the settings:
Pivot Timeframe - simple, a daily pivot is calculated from the previous day's values (high + low + close)/3 . BUt the same calculation can be applied to any length candle, day, minute, month or whatever. This makes the middle target line more or less responsive to recent price action.
ATR Band Timeframe - When we calculate the average range, we need to know what candle length makes up our series. Daily candles is the default, but you can change that here.
ATR Lookback - When we calculate the average range, we need to know how many instances of the timeframe (day, minute, hour etc) we look back to create an average. The lower the lookback value, the more the width of the bands (the distance from pivot) will change quickly based on the volatility of previous candles. The higher the lookback value, the more stable the band width will be to recent volatility.
ATR divisor - The ATR value above is divided by this value, before being added or subtracted to the pivot to create the red and green lines. Default value is 2, and this means the distance from the red band to the green band will be equal to 1 ATR, as calculated according to the parameters above. Setting this to 1 would mean that each band is one ATR away from pivot (ie the bands got wider apart). Set this to 4, and it means that it is only 1/2 an ATR from green to red.
Take Profit / Stop Loss. - We know what a stop and profit target are, but worth nothing that a 0 value disables stop loss or profit targets. The bot will still close positions when crossing pivot.
Also, note the mintick value of the instrument you apply this to. For example for the CFD chart SPX500 the mintick value is 0.1. So a 100 value for stop loss = 10 points on SPX500. but if you were to trade the same thing basically, but the emini future ES, the mintick value is 0.25. So for a 10 point stop on the ES chart, you would need a value of 40 in this bot. US30 and YM have convenient mintick values of 1. Currencies can be a bit of a nightmare :).

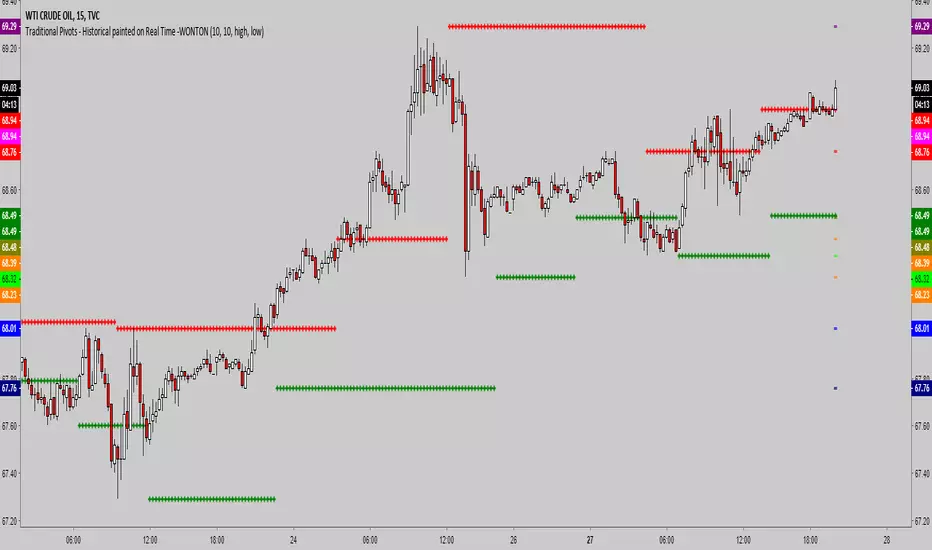
Traditional Pivots - Historical painted on Real Time -WONTONSimple script which allows you:
- to set left bars, right bars to determine high and low pivots (default is 10)
- set the source, default is High for High Pivot and Low for Low Pivot, but it can be modified
- see the last 5 high and low pivots organized and sorted by price
- pivots are standard
A few notes
- TV is quirky on loop time outs, you may have to hide and show the indicator multiple times to eliminate an error if you encounter it
- The historic pivots are sorted by price and will only display as long as you have the chart open, it will begin displaying on the first real time bar
- Leave the chart open for a while and the historic pivot lines will build
- The actual pivots are also shown for reference in history
Equal Highs/Lows Multi-Pivot [Julio]Equal Highs/Lows Multi-Pivot
Description
A sophisticated multi-timeframe pivot analysis tool that detects and highlights equal highs and equal lows across four different pivot lengths simultaneously. This indicator identifies price levels where the market creates identical extremes, a powerful signal of institutional support/resistance and potential reversal or breakout zones.
How It Works
Four Independent Pivot Streams
Pivot 1 (Intraday - 2 bars): Ultra-fast level detection for scalpers
Pivot 2 (Session - 4 bars): Short-term swing levels
Pivot 3 (Daily - 6 bars): Medium-term structural levels
Pivot 4 (Weekly - 9 bars): Long-term institutional levels
Equal High (EQH) Detection
Compares consecutive swing highs and draws a line when two highs are nearly identical within a defined threshold. The indicator uses ATR-based confluence to determine "equality," filtering out noise while catching true market structure.
Equal Low (EQL) Detection
Same logic applied to swing lows, identifying support zones where price repeatedly fails to break below previous lows.
Key Features
Four Simultaneous Timeframes: Analyze intraday, session, daily, and weekly structures all on one chart
ATR-Based Confluence Threshold: Automatically adjusts sensitivity based on current volatility (no fake signals)
Color-Coded Levels: Each pivot length has distinct colors for instant visual identification
Highs: Red, Orange, Yellow, Fuchsia
Lows: Green, Blue, Aqua, Purple
Confirmation Mode: Optional setting to wait for full pivot confirmation before marking levels
Customizable Alert Zones: Toggle individual pivot lengths on/off to reduce clutter
Smart Label Positioning: Labels auto-center between the two equal pivots for clarity
Ideal For
Swing traders tracking support/resistance across multiple timeframes
Scalpers identifying micro-structure for quick entries and exits
Market structure analysts studying institutional price action patterns
Multi-timeframe traders needing confluence from intraday to weekly levels
Anyone trading 1-minute to 4-hour charts
Trading Applications
Identify strong support/resistance zones: Equal levels = confirmed institutional levels
Confirm trend reversals: Multiple equal lows = strong accumulation zone; multiple equal highs = distribution
Plan entries with precision: Enter near equal levels for higher probability setups
Detect liquidity concentration: Where price repeatedly tests the same level
Multi-timeframe confluence: Look for equal levels across multiple pivot lengths for ultra-strong zones
How to Use
Identify the equal levels: Color-coded lines instantly show where price creates matching extremes
Check for confluence: Strong setups occur where multiple pivot lengths align
Wait for price action: Watch for breakouts through equal levels or reversals at these zones
Enter with structure: Use equal levels as entry/exit triggers combined with your trading methodology
Manage with confidence: These levels mark institutional decision points
Customization Options
Adjust pivot lengths to match your preferred timeframe structure
Set ATR threshold sensitivity (lower = stricter equality, higher = more signals)
Toggle confirmation mode for additional filter
Enable/disable individual pivot streams to reduce visual clutter
Customize colors to match your chart theme
Default Settings Optimized For
NASDAQ futures and liquid forex pairs
Intraday and swing trading (1-minute to 4-hour charts)
Smart Money / ICT trading methodologies
Volatility-adjusted confluence detection

SHA Multi Pivot Points -v1.0.0🔎Using Pivot Points in Trading
Traders use PPs to help determine predefined support and resistance levels to guide their trading strategies. In addition, traders identify potential price reversals, trend direction, and breakout opportunities:
Trend identification: PPs act as a reference level to gauge market sentiment. If the price opens above the PP and remains above it, traders interpret this as an uptrend. Conversely, if the price opens below the pivot point and stays below, it suggests a downtrend.
Support and resistance determination: Pivot levels are natural barriers where price reactions frequently occur. Traders may enter long positions near support levels, expecting a price bounce, or if the price approaches resistance levels, traders may consider shorting the asset.
Breakout trading: When the price breaks above resistance or support, it may indicate strong momentum for further movement.
Reversal identification: Traders also look for failed breakouts or price rejections at pivot levels to anticipate reversals.
Trading strategy combinations: Traders can improve accuracy by combining PPs with other technical analysis indicators.
1. Camarilla Pivot Points
📌 Overview:
Developed by Nick Scott in 1989, Camarilla Pivot Points are designed for short-term, intraday trading. Unlike traditional pivots, Camarilla levels are tighter and more responsive, making them useful in volatile markets.
📐 Key Levels:
It generates eight levels:
- Resistance: Initial Level (R1), Mid-range Level (R2), Sell Reversal Level (R3), Breakout Level (R4)
- Support: Initial Level (S1), Mid-range Level (S2), Buy Reversal Level (S3), Breakout Level (S4)
✅ How to Use:
- S1/R1 + RSI or volume divergence to confirm weak momentum and early reversals.
- S2/R2 with price action patterns to enter early on major moves before L3/H3 get tested.
- S3/R3: Mean-reversion zones → price often reverses.
- Break of S4/R4: Strong breakout → trend-following signal.
- Combine with volume or candlestick confirmation for entries.
🔹 2. Floor (Standard) Pivot Points
📌 Overview:
This is the most traditional pivot method, widely used by floor traders. It’s symmetrical and provides a clear central pivot point with equally spaced support and resistance levels.
📐 Key Levels:
- Povit Points : Average price (PPs)
- Resistance : First price ceiling (R1), Stronger ceiling (R2), Extreme resistance (R3)
- Support : First price floor (S1), Stronger floor (S2), Extreme support (S3)
✅ How to Use:
- Above PPs = bullish bias; Below PPs = bearish bias.
- S1/R1 are most used for intraday targets.
- S2–S3/R2–R3 indicate potential extreme moves.
- Often used in combination with momentum indicators.
🔹 3. Woodie Pivot Points
📌 Overview:
Woodie’s pivot formula gives double weight to the closing price, emphasizing the most recent session's sentiment.
📐 Key Levels:
- Povit Points : Weighted average (PPs)
- Resistance : First price ceiling (R1), Stronger resistance (R2)
- Support : First price floor (S1), Stronger support (S2)
✅ How to Use:
- Works best in fast-moving markets.
- PPs acts as a momentum-based balance level.
- Good for scalpers and momentum traders.
🔹 4. Fusion Pivot Points
📌 Overview:
This method differs significantly — it calculates only one support and one resistance level, adjusting based on the relationship between the open and close.
📐 Key Levels:
- Povit Points : Single directional (PPs)
- Resistance : Potential ceiling (R)
- Support : Potential floor (S)
✅ How to Use:
- Not symmetrical → more responsive to price behavior.
- Best for breakout or reversal strategies.
- Use when you're expecting directional momentum.
🔹 5. Classic Pivot Points (Traditional)
📌 Overview:
Also known as Standard or Traditional Pivot Points, this is the default method used by most charting platforms. It offers a balanced and simple framework.
📐 Key Levels:
- Povit Points : Central price level (PPs)
- Resistance : First ceiling (R1), Stronger resistance (R2), Extreme resistance (R3)
- Support : First floor (S1), Stronger floor (S2), Extreme support (S3)
✅ How to Use:
- PPs is the market’s equilibrium point.
- Helps define market structure, bias, and trade zones.
- Combine with order blocks, RSI, or MACD for confirmation.
📊 Summary Comparison :
1. Camarilla Pivot Points
- Focus : Mean Reversion & Breakouts
- Best Use : Scalping, Day Trading
2. Floor Pivot Points
- Focus : General Support/Resistance
- Best Use : Intraday, Swing
3. Woodie Pivot Points
- Focus : Recent Close Emphasis
- Best Use : Momentum Trading
4. Fusion Pivot Points
- Focus : Trend/Breakout
- Best Use : Directional Breakouts
5. Classic Povit Points
- Focus : Market Structure
- Best Use : General Use
⚠️ Disclaimer
The information and tools provided in this script are for educational and informational purposes only. They do not constitute financial advice, investment recommendations, or a solicitation to buy or sell any financial instrument.
Trading in the financial markets involves risk of loss and is not suitable for every investor. You are solely responsible for your trading decisions. Always do your own research, use proper risk management, and consult a licensed financial advisor before making any financial decisions.

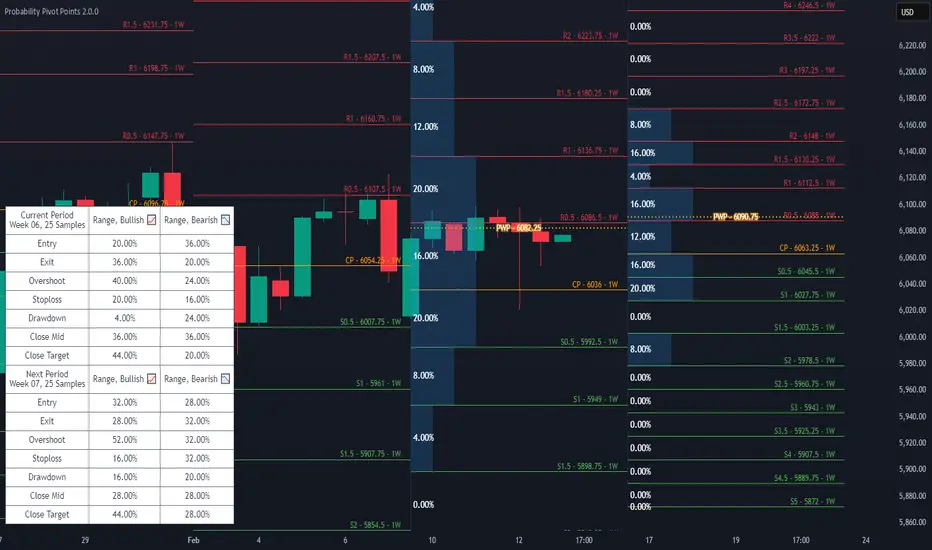
Probability Pivot PointsProbability Pivot Points integrates a customizable Pivot Points indicator with conditional probabilities calculated from historical occurrences.
Features
Six different discretionarily Pivot Point Bias strategies utilizing Midpoint Pivot Points in bullish and bearish variants: Standard, Range, Continuation, Counter Trend, Expansion, and Extension.
Next Period's Pivot Points given the current period's OHLC data. Includes settings to use theoretical OHLC values to see what the next period's Pivot Points could look like.
Supports Traditional, Floor, Fibonacci, and Average True Range Pivot Point calculations.
Includes settings to customize the Fibonacci ratios and Average True Range calculations.
Automatically maximize or manually set the number of historical Pivot Points to draw.
Probability visualizations for the Pivot Points based on historical occurrences for the current and upcoming trading periods. The Probability Weighted Pivot (PWP) Point uses the probabilities calculated as weights against every displayed Pivot Point to show a mean of the data.
Load seasonal or non-seasonal historical data to calculate the odds of a High, Low, or Close occurring between any two Pivot Points.
Settings to manually set the weekly, monthly, and quarterly seasonal data loaded into the Pivot Probabilities feature. Automatic detection and loading of the current seasonal period's data is the default behavior. Includes a table that displays the data that's loaded.
Get probabilities for the currently selected Pivot Point Bias strategy.
Check the odds of High, Low, or Close occurrences at the strategy's marked Entry, Exit, or Stop Loss Pivot Points.
Seasonal Filters let you select specific years to sample probabilities from.
Customize pivot colors, width, label size, label color, Bias Entry and Exit Zone colors, Pivot Probability colors, and pick between the Point Five and M Legacy Midpoint label styles.
Auto Timeframe changes the Pivot Points higher timeframe based on the chart timeframe in use. Includes settings to customize what chart timeframes will display specific Pivot Point higher timeframes.
Q: Is this an update to your older Pivot Probabilities indicator?
Pivot Probabilities was designed to require a separately applied Pivot Points indicator to be interpreted and used properly. Probability Pivot Points is designed with an included set of Pivot Pivots that can interact with the probability calculations, which helps make improvements to new calculations and visualizations that Pivot Probabilities was never originally designed to do. Features from Pivot Probabilities are being completely redesigned, reimplemented, and expanded upon as a component in this larger Probability Pivot Points indicator. Anyone with access to the old Pivot Probabilities will also get access to Probability Pivot Points and are considered part of the same package.
Market Pivot Levels [Past & Live]Market Levels provide a robust view of daily pivot points of markets such as high/low/close with both past and live values shown at the same time using the recently updated system of polylines of pinescript.
The main need for this script arose from not being able to use plots for daily points because plots are inherently once drawn can't be erased and because we can't plot stuff for previous bars after values are determined we can't use them reliably. And while we can use traditional lines, because we would have extremely high amount of lines and we would have to keep removing the previous ones it wouldn't be that effective way for us. So we try to do it with the new method of polylines .
Features of this script:
- Daily High/Low Points
- Yesterday High/Low/Close Points
- Pre-Market High-Low points.
Now let's preview some of the important points of code and see how we achieve this:
With the code below we make sure no matter which chart we are using we are getting the extended hours version of sessions so our calculations are made safely for viewing pre-market conditions.
// Let's get ticker extended no matter what the current chart is
tc = ticker.new(syminfo.prefix, syminfo.ticker, session.extended)
Coding our own function to calculate high's and low's because inbuilt pinescript function cannot take series and we send this function to retrieve our high's and lows.
// On the fly function to calculate daily highlows instead of tv inbuilt because tv's length cannot take series
f_highlow(int last) =>
bardiff = last
float _low = low, float _high = high
for i = bardiff to 0 by 1
if high > _high
_high := high
if low < _low
_low := low
With doing calculations at the bars of day ending points we can retrieve the correct points and values and push them for our polylines array so it can be used in best way possible.
// Daily change points
changeD = timeframe.change("D")
// When new day starts fill polyline arrays with previous day values for polylines to draw on chart
// We also update prevtime values with current ones after we pushed to the arrays
if changeD
f_arrFill(cpArrHigh, cpArrLow, prevArrh, prevArrl, prevArrc, prevMarh, prevMarl)
valHolder.unshift(valueHold.new(_high, _low, _high, _close, _low, time, pr_h, pr_l))
The rest of the code is annotated and commented. You can let me know in comments if you have any questions. Happy trading.

SuperTrend Enhanced Pivot Reversal - Strategy [PresentTrading]
- Introduction and How it is Different
The SuperTrend Enhanced Pivot Reversal is a unique approach to trading that combines the best of two worlds: the precision of pivot reversal points and the trend-following power of the SuperTrend indicator. This strategy is designed to provide traders with clear entry and exit points, while also filtering out potentially false signals using the SuperTrend indicator.
BTCUSDT 6hr
ETHBTC 6hr
Unlike traditional pivot reversal strategies, this approach uses the SuperTrend indicator as a filter. This means that it only takes trades that align with the overall trend, as determined by the SuperTrend indicator. This can help to reduce the number of false signals and improve the overall profitability of the strategy.
The Pivot Reversal Strategy with SuperTrend Filter is particularly well-suited to the cryptocurrency market for the reason of High Volatility. This means that prices can change rapidly in a very short time, making it possible to make a profit quickly. The strategy's use of pivot points allows traders to take advantage of these rapid price changes by identifying potential reversal points
- Strategy: How it Works
The strategy works by identifying pivot reversal points, which are points in the price chart where the price is likely to reverse. These points are identified using a combination of the ta.pivothigh and ta.pivotlow functions, which find the highest and lowest points in the price chart over a certain period.
Once a pivot reversal point is identified, the strategy checks the direction of the SuperTrend indicator. If the SuperTrend is positive (indicating an uptrend), the strategy will only take long trades. If the SuperTrend is negative (indicating a downtrend), the strategy will only take short trades.
The strategy also includes a stop loss level, which is set as a percentage of the entry price. This helps to limit potential losses if the price moves in the opposite direction to the trade.
- Trade Direction
The trade direction can be set to "Long", "Short", or "Both". This allows the trader to choose whether they want to take only long trades (buying low and selling high), only short trades (selling high and buying low), or both. This can be useful depending on the trader's view of the market and their risk tolerance.
- Usage
To use the Pivot Reversal Strategy with SuperTrend Filter, simply input the desired parameters into the script and apply it to the price chart of the asset you wish to trade. The strategy will then identify potential trade entry and exit points, which will be displayed on the price chart.
- Default Settings
The default settings for the strategy are as follows:
ATR Length: 5
Factor: 2.618
Trade Direction: Both
Stop Loss Level: 20%
Commission: 0.1%
Slippage: 1
Currency: USD
Each trade: 10% of account equity
Initial capital: $10,000
These settings can be adjusted to suit the trader's preferences and risk tolerance. Always remember to test any changes to the settings using historical data before applying them to live trades.

Mean Shift Pivot ClusteringCore Concepts
According to Jeff Greenblatt in his book "Breakthrough Strategies for Predicting Any Market", Fibonacci and Lucas sequences are observed repeated in the bar counts from local pivot highs/lows. They occur from high to high, low to high, high to low, or low to high. Essentially, this phenomenon is observed repeatedly from any pivot points on any time frame. Greenblatt combines this observation with Elliott Waves to predict the price and time reversals. However, I am no Elliottician so it was not easy for me to use this in a practical manner. I decided to only use the bar count projections and ignore the price. I projected a subset of Fibonacci and Lucas sequences along with the Fibonacci ratios from each pivot point. As expected, a projection from each pivot point resulted in a large set of plotted data and looks like a huge gong show of lines. Surprisingly, I did notice clusters and have observed those clusters to be fairly accurate.
Fibonacci Sequence: 1, 2, 3, 5, 8, 13, 21, 34...
Lucas Sequence: 2, 1, 3, 4, 7, 11, 18, 29, 47...
Fibonacci Ratios (converted to whole numbers): 23, 38, 50, 61, 78, 127, 161...
Light Bulb Moment
My eyes may suck at grouping the lines together but what about clustering algorithms? I chose to use a gimped version of Mean Shift because it doesn't require me to know in advance how many lines to expect like K-Means. Mean shift is computationally expensive and with Pinescript's 500ms timeout, I had to make due without the KDE. In other words, I skipped the weighting part but I may try to incorporate it in the future. The code is from Harrison Kinsley . He's a fantastic teacher!
Usage
Search Radius: how far apart should the bars be before they are excluded from the cluster? Try to stick with a figure between 1-5. Too large a figure will give meaningless results.
Pivot Offset: looks left and right X number of bars for a pivot. Same setting as the default TradingView pivot high/low script.
Show Lines Back: show historical predicted lines. (These can change)
Use this script in conjunction with Fibonacci price retracement/extension levels and/or other support/resistance levels. If it's no where near a support/resistance and there's a projected time pivot coming up, it's probably a fake out.
Notes
Re-painting is intended. When a new pivot is found, it will project out the Fib/Lucas sequences so the algorithm will run again with additional information.
The script is for informational and educational purposes only.
Do not use this indicator by itself to trade!

Institutional PivotsToday I propose a novel idea of plotting pivots, this can be also considered as Value areas/Noise areas.
*What is it?
Its a simple concept of gauging price action with respect to its most time spent in a particular range, this is usually denoted as Value area in the Market profile concept, where that "most" word is represented by 70% of the price action.
*What's different from the Market Profile?
Market profile is dependent on real time price movement to complete to see the value area or noise area to plot a static area, there is always a possibility of it shifting as price may move outside of it, and hence its called "developing value area", till of course session is closed and plot is finalized.
While that method is solid indication of "actual price profile" development, it lacks when it comes to offering traders a more stable view to enable them to make decisions. And therefor, when traders trade MP they are usually limited by the number of trades they can take.
This is the main reason as to why traders prefer to use other methods like Pivots/ORB/Range-breakouts over pure MP charts, even though latter reduces the possibility of wrong estimations of "support/resistance working/holding".
*Why the name Institutional Pivots?
In my research I've found that these Pivots/Value area/Noise area ranges are often the areas watched by the big players who trade breakouts or mean reversion strategies, so while that name may sound dubiously clickbaity, it is indeed intended to represent an observation. I know how that sounds, but you can choose to ignore it if you do not agree or see good results after using it. After all, its free to use for everyone.
*Nomenclature/colors and settings?
Noise area/Value area/Central Pivot area - Designated with Yellow labels, in which NU represents the Upper level and ND represents the Lower level
Targets - Target calculation mechanism is based on " today's price action" and today's Open, D1 and D2 represent down targets for the day and U1 and U2 represent upper targets. Please note that this is independent of the "Noise area/Value area/Central Pivot area", so overlap of levels is possible. AND if overlap happens, that's an indication of more strength at S/R line/area for the price.
One more thing to note here is that if there is formation of the new low or new high in the day, those levels will change as their calculation gets influenced by the same. This is NOT a repaint issue, this is SHIFT/FORMATION OF THE NEW levels and it's an "intended" behavior.
Open and POpen - Open represents open of the time-frame selected and POpen represents previous open of the time-frame.
Lable's starting with "H" are indicating higher Timeframe levels, levels which are same as above.
ATR based targets - When you enable this in settings, you will get target calculation based on ATR (self explanatory)
Full ATR mode - When you enable this option, you will get both Noise area as well as targets based on ATR, please don't forgot to turn off the ATR based targets when you enable this, as they conflict with each other.
I've not kept lines, area plots or even price levels as I feel it's just noise and takes away from the indicators main focus, please don't ask to add them, I'll not.
This is meant as purely educational idea, if you use this to trade, it is at your discretion and responsibility will be yours alone.
Past performance is not assurance of the future performance.
More example chart/s

BBofVWAP with entry at Pivot PointThis strategy uses BB of VWAP and Pivot point to enter and exit the Long position.
settings
BB length 50
BB Source VWAP
Entry
When VWAP crossing up BB midline and price/close is above weekly PivotPoint ( you can also use Daily pivot point )
Exit
When VWAP is crossing down BB lower band
Stop Loss
Stop loss defaulted to 5%
Note : Long will position will be exited on either VWAP crossing down BB lower band or stop loss is hit - whichever comes first . Being said that some time your stop loss exit is less than 5% which saves from more losses.
Entry is based on weekly Pivot point , so any time frame below weekly will work perfect. I have tested t on 30 min , 1 HR , 4 Hr , Daily charts. Even weekly setting shows good results , that will work for long term investing style.
if you change Pivot period to Daily , chose time frames below Daily.
I also noticed this strategy mostly do not enter Long position in a down trend. Even it finds one , it will be exited with minimal loss.
Warning
For the use of educational purposes only

Rolling Fibonacci Pivot Points [QuantNomad]Standard Fibonacci Pivot Points are calculated from the previous day (or another period) close/low/high. But what is the day close for cryptocurrencies trading 24/7 on exchange? Does it make sense to use a specific time price as a close if it continue trading after that?
So I decided to solve that issue with Rolling Fibonacci Pivot Points where I calculate pivot points not at the end of the period but for every bar. Every time recalculating pivot points I look at a window of period length in bars and base my calculations on these bars. This way you get smooth pivot points changing with every bar and it seems like levels might be really nice support and resistance for the price.
I implemented 6 periods: Auto, Day, Week, Month, Quarter, Year. For the Auto period, I select the most suitable period for the timeframe of your chart.
On the chart, you can see by default 7 levels plotted:
PP – Pivot Point
S1 – Support on 0.382 fib level
S2 – Support on 0.618 fib level
S3 – Support on 1.000 fib level
R1 – Resistance on 0.382 fib level
R2 – Resistance on 0.618 fib level
R3 – Resistance on 1.000 fib level
Also in parameters you can display additional midpoints:
S0.5 – Support on 0.236 fib level
S1.5 – Support on 0.500 fib level
S2.5 – Support on 0.786 fib level
R0.5 – Resistance on 0.236 fib level
R1.5 – Resistance on 0.500 fib level
R2.5 – Resistance on 0.786 fib level
####################
It's a pro indicator, you can have access to it for a small fee. Link to my PRO indicators you can find in my signature.
####################
Disclaimer
Please remember that past performance may not be indicative of future results.
Due to various factors, including changing market conditions, the strategy may no longer perform as good as in historical backtesting.
This post and the script don’t provide any financial advice.


Automatic Fibonacci Pivot Point S/R LevelsThis is a great tool to find confluences between Fibonacci Pivot point on various time frames.
Fib Pivots used
23.6%
38.2%
50%
61.8%
76.4%
100%
127.2%
141.4%
161.8%
200%
If price is between two levels on the update the lines shift
Yearly Pivots shown on 1m - Daily timeframes
PIvots recalculate on every day
Monthly pivots show on 1m - 60m timeframes
Pivots recalculate every hour
Weekly pivots show on 1m - 15m timeframes
Pivots recalculate every 30m
There is a lot of code but it got the job done.
It would easy to interchange if you prefer different types of pivots
It would be easy to add an on/off if you dont want so many levels on your smaller time frames
If anyone can streamline it please do

Extrapolated Pivot Connector - Lets Make Support And ResistancesIntroduction
The support and resistance methodology remain the most used one in technical analysis, this is mainly due to its simplicity, and unlike lots of techniques used in technical analysis support and resistances have a certain logic, price can sometimes appear moving into a channel, support and resistances allow the trader to estimate such channel and project it into the future in order to spot points where price might reverse direction.
In this script a simple linear support and resistance indicator is proposed, the indicator is made by connecting past pivot high's/low's to more recent ones and extrapolating the resulting connection. The indicator is also able to make support and resistances by using other indicators as input.
Indicator Settings
The indicator include various settings, the first one being the length setting who determine the sensitivity of the pivot high/low detection, low values of length will detect the pivot high/low of noisy variations, while higher values will detect the pivot high/low of longer term variations.
The figure above use length = 5.
The A-High parameter determine the position of the pivot high to be used as first point of the resistance line, higher values will use oldest pivot high's as first point. The B-High parameter determine the last pivot high. A-Low and B-Low work the same way but affect the support line, a label is drawn on the chart in order to help you determine the position of A/B-High/Low.
Using Other Indicators Output As Input
The "Use Custom Source" option allow you to apply the indicator to other indicators, for example we can use a moving average of period 50 as input
Or the rsi :
Let me help you set the proposed indicator easily to indicators appearing on a separate window, for example the momentum oscillator, add the momentum oscillator to the chart, to do so click on indicator and search "momentum", click on the first result, once on the chart put your mouse pointer on the indicator title, you'll see appearing the hide, settings and delete option, at the right of delete you should see three dots which represent the "more" option, click on it and select "Add indicator on Mom" and select the extrapolated pivot indicator, you can do that by searching it, altho it might be easier to do it by adding the indicator to favorites first, you then only need to select it from your favorites.
You might see a mess on the indicator window, thats because the extrapolated pivot is still using high and low as input, go to the settings of the extrapolated pivot indicator and check "Use Custom Source", it should appear properly now.
Tips And Tricks When Using Support And Resistances
Linear support and resistances assume an approximately linear trend, if you see non linear growth in the price evolution you can use a logarithmic scale in order to have a more linear evolution. To do so right click on the the chart scale and select "Logarithmic" or use the following key shortcut "alt + l".
When applying the indicator to an oscillator centered around zero make sure to adjust the settings of the oscillator such that the peak magnitude of the oscillator is relatively constant over time.
Here a roc of period 9 has non constant peak amplitude, you can see that by looking at the position of the pivots (circles), increasing the period of the roc help capture more significant pivots high's/low's
Conclusion
In this post an indicator aiming to draw support and resistances is presented, the fact that it can be applied to any other indicator is a relatively nice option, and i hope you might make use of this feature.
The code make heavy use of the new features that where integrated on the v4 of pine, such features are really focused on making figures and labels, things i don't really work with, but it is nice to step out my short codes habits, and i don't exclude working with figures in pine in the future.
Thanks for reading !

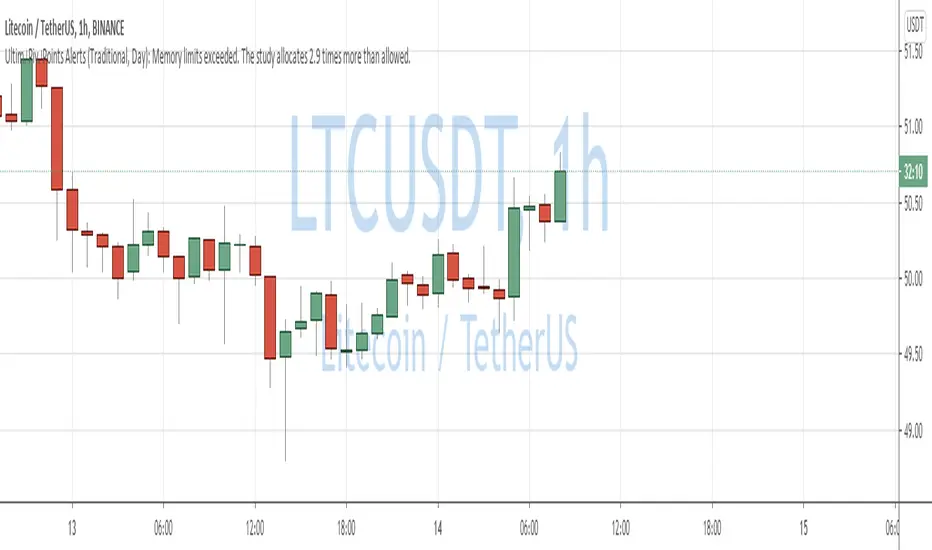
QuantNomad - Ultimate Pivot Points AlertsCreated a universal script for pivot points alerts.
In the script, you can choose one of 4 pivot point types: Traditional, Fibonacci, Woodie, and Camarilla.
You are able to create separate alerts for every level or create one for price crossing any level.
For separate levels, you can choose: "Cross", "Crossover" and "Crossunder".
You can also choose to show/hide:
Historical Levels
Levels Values
Current Levels - Levels calculated on the current period, on close of the period they will become valid levels for next periods. These levels do not participate in alerts calculations.
Because of some TradingView limitations, alerts won't be fired for the first bar of the session.
In the script used new v4 plotting features, so will be able to plot levels and labels nicely. Unfortunately, there is a limit on the number of consecutive lines you can plot on the plot (around 50), so historical lines in the past will disappear after 6-7 periods.
And remember:
Past performance does not guarantee future results.
Clone Levels - Auto-pivot using clones. WONTONMethod sets out pivots
100%
75%
50%
25%
0%
Divisions of a range using a cloning method from a High/Low range determined by selecting the number of Months to determine the anchor points.

Puntos Pivotes + 6 EMAS Para las personas que quieran utilizar los puntos pivotes y varias medias móviles exponenciales en un solo indicador // For people who want to use Pivot Points and different Exponential Moving Averages in One indicator

BK AK-Momentum Pivot Wolf🐺⚔️ BK AK–Momentum Pivot Wolf — The Court of Price. ⚔️🐺
Not prophecy. Procedure. Not prediction. Judgment.
Most indicators sell you a feeling: “it’s going up.”
Pivot Wolf is built to do the opposite: make the market prove it—under rules.
Price lies. Not maliciously—mechanically.
It prints motion whether there’s intent behind it or not. That’s why traders get slaughtered: they treat movement like truth.
Pivot Wolf treats movement like a defendant.
⚖️ The Law of the Tool (What It Refuses to Do)
This script does not exist to “call tops and bottoms.”
It exists to remove the sin that ruins traders:
answering before hearing.
If you trade before testimony, you’re not trading—you’re volunteering.
So Pivot Wolf is designed to withhold permission until three things line up:
Pivots = Boundary Stones
Where price must answer. Where excuses die. Where decisions become visible.
Momentum = Witness
Not what price did—what it carried. Force behind the move, not the costume of the candle.
Acceleration = Confession
The moment intent leaks. The early tell that strength is arriving—or that strength is bleeding out.
You’re not hunting “signals.”
You’re watching a case get built.
🪨 Solomon’s Hidden Layer (Why This Is a Wisdom Tool)
Solomon’s world wasn’t obsessed with forecasting. It was obsessed with right judgment.
He didn’t ask, “What do I want to happen?”
He asked, “What’s true—and what is counterfeit?”
That’s why his writing keeps returning to the same themes:
Weights & measures (standardization over vibes)
Witnesses (confirmation over impulse)
Gates & boundaries (permissioned action over chaos)
Silence (restraint as intelligence)
Pivot Wolf is built in that spirit: it’s a weights-and-witness engine disguised as an indicator.
It’s trying to keep you from trading counterfeit strength at the edge of a boundary.
🐺 How to Use It Like You Actually Respect Capital
1) Campaign Mode (Trend):
Boundaries tell you where business is allowed. Momentum/acceleration tell you whether business is justified. You press when testimony is clean—not when price is exciting.
2) Verdict Mode (Turns):
Reversals aren’t vibes. They’re a collapse of testimony: momentum fails at the boundary, acceleration flips, and the move confesses exhaustion.
3) Stand-Down Mode (The Feature Tourists Hate):
When the script goes quiet, it’s not “missing trades.”
It’s telling you: the court is not in session.
That’s the part that keeps your P&L alive.
🏷️ BK / AK
BK is the mark I’m building.
AK is honor—my mentor’s standard: clarity, patience, no shortcuts.
Above that: gratitude to Gd, the true source of wisdom, restraint, and endurance.
📜 King Solomon Lens
“Solomon didn’t predict. He judged. He built tests that made truth show itself. Pivot Wolf is that: pivots as boundary stones, momentum as witness, acceleration as the confession. No hammer in the Temple — rules are cut before entry. When it’s quiet, it’s saving you. When it speaks, it’s a ruling.”
This is not financial advice. This is structure.
If you wanted a fortune teller, you’ll hate this script.
If you wanted a system that makes the market prove itself before you strike—welcome to the Wolf.

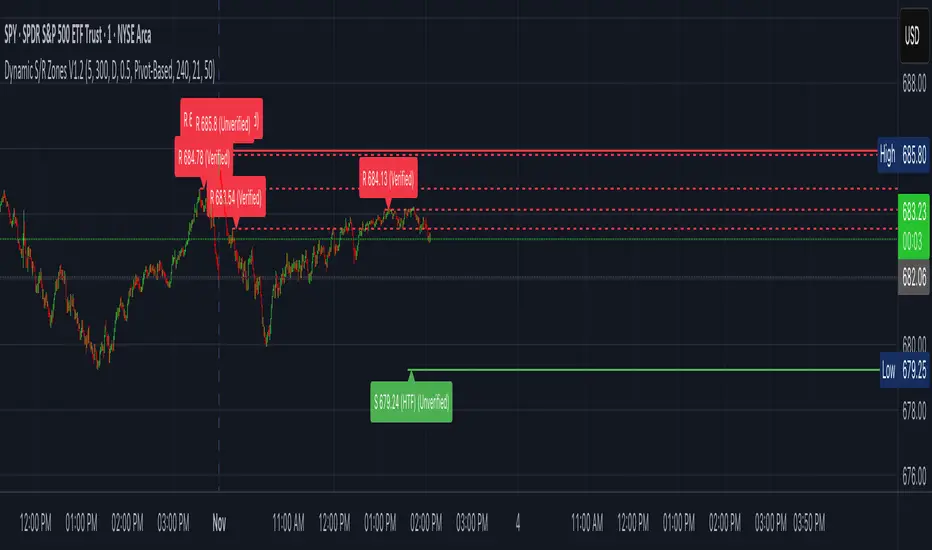
Dynamic S/R Zones (Verified Pivots)Dynamic S/R Zones V1.2
Overview
Dynamic S/R Zones V1.2 is a Pine v6 structure visualizer that highlights nearby Support/Resistance zones from confirmed swing pivots on the current chart and an optional higher timeframe (HTF). It can also plot simple Fibonacci guide levels (33% / 50% / 66%) between the most recent swing points. All HTF requests use lookahead_off to avoid forward-looking data, and S/R anchors are derived from verified pivots to minimize repainting. Optional “touch-verified” coloring flips a level’s display once price trades through it.
This tool is an illustrative S/R map for chart review and education.
How it works
Verified Pivots (Non-Repainting):
• Minor S/R uses ta.pivothigh/ta.pivotlow with a symmetric lookback (“Pivot Strength”).
• Lines anchor only on confirmed pivots, so once drawn they remain stable.
• A de-dup buffer filters out levels that are too close together.
HTF Major Zones:
• HTF OHLC is requested via request.security(..., lookahead=barmerge.lookahead_off).
• The same pivot logic runs on the HTF series; lines appear after the HTF bar closes.
• Major lines can be shown alongside (or instead of) minor lines.
Touch-Verified Coloring (optional):
• When a level is touched (high ≥ level ≥ low), it flips from neutral to a side color:
– Support (price above) ≈ green; Resistance (price below) ≈ red.
• The verification state is persistent for that line.
Fibonacci Guides (optional):
• Draws 33% / 50% / 66% between the last opposing swing high/low.
• Verification/coloring modes:
Pivot-Based: uses the most recent swing direction.
HTF Trend-Based: uses a fast/slow EMA comparison on a user-selected HTF.
Bounce/Reject Mode: color on touch regardless of trend interpretation.
• One arrow per bar (optional) indicates a newly verified fib touch.
What it displays
• Minor S/R lines from current-TF verified pivots (non-repainting anchors).
• Major S/R lines from HTF pivots (confirmed on HTF close).
• Optional labels that state level type, price, HTF tag, and Verified/Unverified status.
• Optional Fibonacci guide lines with labels, plus single-arrow confirmations.
• Coloring that reflects touch verification and current side (support/resistance).
Why it’s original
• Focuses on confirmed structure (minor + HTF) with de-duplication for clarity.
• Offers hybrid fib verification (pivot-based, HTF-trend-based, or bounce/reject) to let users study structure from multiple perspectives without asserting signals.
• Maintains persistent verification per level and avoids lookahead on HTF for stable, review-friendly visuals.
• Provides a compact workflow for scanning: minor structure, HTF context, then fib context.
Configuration & usage notes
• Pivot Strength: Higher values = stricter confirmation (fewer lines, more stable).
• Lookback Range: Prunes older lines; increase for broader context.
• HTF for Major S/R: Daily/4H/Weekly etc.; lines confirm on that timeframe’s close.
• Min Distance Between Levels: Helps reduce clutter from nearby duplicates.
• Touch-Verified Coloring: Enable for quick support/resistance side cues.
• Fibs: Choose coloring mode (Pivot-Based, HTF Trend-Based, or Bounce/Reject).
• HTF Trend TF / EMAs: Only affect coloring when using HTF trend mode for fibs.
• Performance: Labels and line counts can be tuned down on very long histories.
Limitations & assumptions
• Pivot detection depends on chart timeframe, liquidity, and chosen pivot length.
• HTF lines update after the HTF bar closes (by design, to avoid lookahead).
• Optional Realtime pivots for fibs (if enabled) are provisional and can shift until a swing verifies.
• Coloring and arrows are descriptive—they do not imply entries, exits, or probabilities.
Legal Disclaimer
These tools visualize calculations on historical data for charting and educational use only. They are not signals, recommendations, or promises of future results. Markets involve risk, and past results do not guarantee future outcomes. Provided “as is,” without warranties. Consider consulting a qualified professional before making decisions.
Volume Profile, Pivot Anchored by DGT - reviewedVolume Profile, Pivot Anchored by DGT - reviewed
This indicator, “Volume Profile, Pivot Anchored”, builds a volume profile between swing highs and lows (pivot points) to show where trading activity is concentrated.
It highlights:
Value Area (VAH / VAL) and Point of Control (POC)
Volume distribution by price level
Pivot-based labels showing price, % change, and volume
Optional colored candles based on volume strength relative to the average
Essentially, it visualizes how volume is distributed between market pivots to reveal key price zones and volume imbalances.
