Average Range LinesThis Average Range Lines indicator identifies high and low price levels based on a chosen time period (day, week, month, etc.) and then uses a simple moving average over the length of the lookback period chosen to project support and resistance levels, otherwise referred to as average range. The calculation of these levels are slightly different than Average True Range and I have found this to be more accurate for intraday price bounces.
Lines are plotted and labeled on the chart based on the following methodology:
+3.0: 3x the average high over the chosen timeframe and lookback period.
+2.5: 2.5x the average high over the chosen timeframe and lookback period.
+2.0: 2x the average high over the chosen timeframe and lookback period.
+1.5: 1.5x the average high over the chosen timeframe and lookback period.
+1.0: The average high over the chosen timeframe and lookback period.
+0.5: One-half the average high over the chosen timeframe and lookback period.
Open: Opening price for the chosen time period.
-0.5: One-half the average low over the chosen timeframe and lookback period.
-1.0: The average low over the chosen timeframe and lookback period.
-1.5: 1.5x the average low over the chosen timeframe and lookback period.
-2.0: 2x the average low over the chosen timeframe and lookback period.
-2.5: 2.5x the average low over the chosen timeframe and lookback period.
-3.0: 3x the average low over the chosen timeframe and lookback period.
Look for price to find support or resistance at these levels for either entries or to take profit. When price crosses the +/- 2.0 or beyond, the likelihood of a reversal is very high, especially if set to weekly and monthly levels.
This indicator can be used/viewed on any timeframe. For intraday trading and viewing on a 15 minute or less timeframe, I recommend using the 4 hour, 1 day, and/or 1 week levels. For swing trading and viewing on a 30 minute or higher timeframe, I recommend using the 1 week, 1 month, or longer timeframes. I don’t believe this would be useful on a 1 hour or less timeframe, but let me know if the comments if you find otherwise.
Based on my testing, recommended lookback periods by timeframe include:
Timeframe: 4 hour; Lookback period: 60 (recommend viewing on a 5 minute or less timeframe)
Timeframe: 1 day; Lookback period: 10 (also check out 25 if your chart doesn’t show good support/resistance at 10 days lookback – I have found 25 to be useful on charts like SPX)
Timeframe: 1 week; Lookback period: 14
Timeframe: 1 month; Lookback period: 10
The line style and colors are all editable. You can apply a global coloring scheme in the event you want to add this indicator to your chart multiple times with different time frames like I do for the weekly and monthly.
I appreciate your comments/feedback on this indicator to improve. Also let me know if you find this useful, and what settings/ticker you find it works best with!
Also check out my profile for more indicators!
Search in scripts for "range"

4H RangeThis script visualizes certain key values based on a 4-hour timeframe of the selected market on the chart. These values include the High, Mid, and Low price levels during each 4-hour period.
These levels can be helpful to identify inside range price action, chop, and consolidation. They can sometimes act as pivots and can be a great reference for potential entries and exits if price continues to hold the same range.
Here's a step-by-step overview of what this indicator does:
1. Inputs: At the beginning of the script, users are allowed to customize some inputs:
Choose the color of lines and labels.
Decide whether to show labels on the chart.
Choose the size of labels ("tiny", "small", "normal", or "large").
Choose whether to display price values in labels.
Set the number of bars to offset the labels to the right.
Set a threshold for the number of ticks that triggers a new calculation of high, mid, and low values.
* Tick settings may need to be increased on equity charts as one tick is usually equal to one cent.
For example, if you want to clear the range when there is a close one point/one dollar above or below the range high/low then on ES
that would be 4 ticks but one whole point on AAPL would be 100 ticks. 100 ticks on an equity chart may or may not be ideal due to
different % change of 100 ticks might be too excessive depending on the price per share.
So be aware that user preferred thresholds can vary greatly depending on which chart you're using.
2. Retrieving Price Data: The script retrieves the high, low, and closing price for every 4-hour period for the current market.
The script also calculates the mid-price of each 4-hour period (the average of the high and low prices).
3. Line Drawing: At the start of the script (first run), it draws three lines (high, mid, and low) at the levels corresponding to the high,
mid, and low prices. Users can also change transparency settings on historical lines to view them. Default setting for historical lines
is for them to be hidden.
4. Updating Lines and Labels: For each subsequent 4-hour period, the script checks whether the close price of the period has gone
beyond a certain threshold (set by user input) above the previous high or below the previous low. If it has, the script deletes the
previous lines and labels, draws new lines at the new high, mid, and low levels, and creates new labels (if the user has opted to
show labels).
5. Displaying Values in the Data Window: In addition to the visual representation on the chart, the script also plots the high, mid, and
low prices. These plotted values appear in the Data Window of TradingView, allowing users to see the exact price levels even when
they're not directly labeled on the chart.
6. Updating Lines and Labels Position: At the end of each period, the script moves the lines and labels (if they're shown) to the right,
keeping them aligned with the current period.
Please note: This script operates based on a 4-hour timeframe, regardless of the timeframe selected on the chart. If a shorter timeframe is selected on the chart, the lines and labels will appear to extend across multiple bars because they represent 4-hour price levels. If a longer timeframe is selected, the lines and labels may not accurately represent high, mid, and low levels within that longer timeframe.

Intraday Range CalculatorThis indicator shows an easy way to determine if the stock, index or ETF ended within a configurable intraday range.
This solution is ideal for those who study and like Iron Condors or Iron Butterflies strategies.
Results:
If the square is red, it means that the selected deviation limits have been exceeded within the chosen times.
If the square is green, the price stayed within the pre-set limits.
A yellow circle marks the moment when the price leaves the range, either by the upper band or by the lower band.
In the last bar a label with the test results will be displayed.
Settings:
In the configuration there are three fields:
1. Deviation : is the range in percentage that the price can move up or down from the start time to the end time.
2. Begin Time: is the time (in 24h or military format) where the process begins.
3. End Time: is the time (in 24h or military format) where the process ends.
Example:
* for the time 11:00 am, you must enter "1100"
* for the time 2:45pm, you must enter "1445"
Important:
The selected timeframe must be less than 1 hour and Extended Trading Hours in the lower left corner), otherwise the indicator may not show results.
Later I will make an improvement to solve these inconveniences.

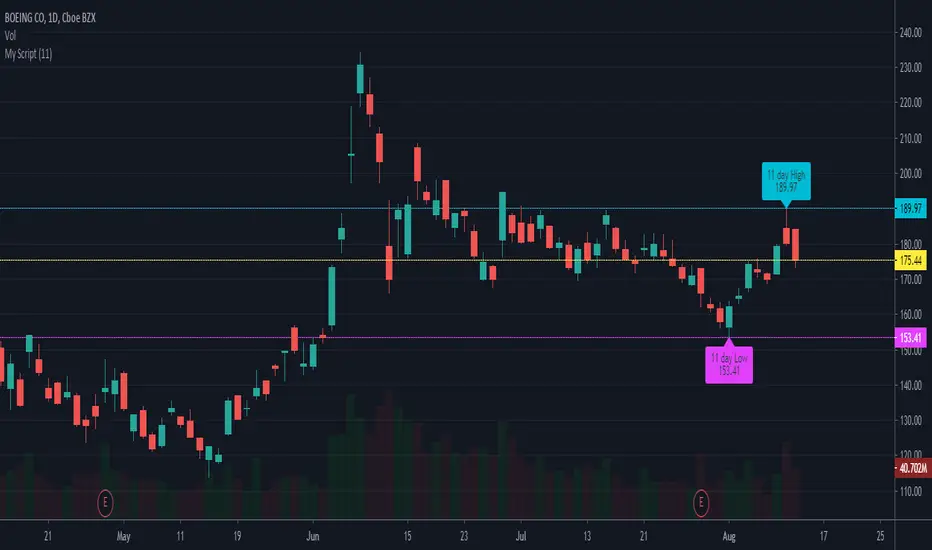
Narrow Range (NR) IndicatorNarrow Range (NR) trading strategy is a breakout-based method that assumes that the price of security trends up or down after a brief consolidation in a narrow range. This indicator can plot:
1. Narrow Range (NR) 4, 7, and 21
2. Narrow Range (NR) 4, 7, and 21 + Inside Bars (IB)
NR 4/NR 7/NR 21 day acts as a confirming factor on where the price will move further. Breakout of NR 4/NR 7/NR 21 candle with high volumes indicates bullishness, while the breakdown candle indicates bearishness.

Average Trading Range Percentage
Average high/low trading range for the current timeframe.
Daily high/low trading range.

[FN] Session Range & Date Range For BacktestingThis has been done before in different ways, however, my goal is to publish a single, simplified copy/paste version of the idea so you can quickly and easily incorporate it into your strategy backtesting.
You can designate weekdays, weekdays + weekends for 24/7 markets, and also session range.
So, you trade bitcoin? It works. CME futures? It works. You are a discretionary trader so the only signals that matter are the ones that happen when you're awake? It works. Copy and paste.
The goal is that its that easy. You'll have to let me know if it is. glhf everyone.
If I'm not mistaken, you should be able to copy/paste this directly into your strategy script (Paste it in before your entry declarations). Just leave out the last 2 lines where the bgcolor() is declared... unless you want the background color lit up, that's up to you. It's just for demonstration purposes in this script.
After you've pasted it in, then in your strategy.entry() function you are adding: to the strategy.entry() function.
e.g:
strategy.entry("Long", strategy.long, qty=1, when = ENTRY_SIGNAL and signal_backtest())
Shoutouts to @zenandtheartoftrading and @allanster for providing the basis of this code that I put together here. We stand on the shoulders of giants.

High-Low RangeThis script just shows a histogram of the daily range. You can change the interval to view the high/low range of any period, but I use it just to see what the day's range is and how it compares to prior days. Simple and straightforward.
Session RangeSimple script for showing the high/low/midrange of a session. By default configured to do the Daily range using the "regular" session. But it's configurable. For example on this chart I am showing the Weekly range.

RTH and ETH RangesKey Functions :
Visualizes Regular Trading Hours (RTH) and Extended Trading Hours (ETH) price ranges
Tracks session highs, lows, and 50% levels where significant market reactions occur
Detects breakouts beyond previous session extremes
Trading Applications :
Exposes potential liquidity raids at session boundaries where smart money targets stop orders
Identifies critical price thresholds where institutional activity concentrates
Highlights divergences between RTH and ETH behavior that precede directional moves
Provides measurement of session volatility differences
Maps key price levels for objective entry and exit parameters
Reveals market dynamics at session transitions where institutional positioning changes

Superior-Range Bound Renko - Alerts - 11-29-25 - Signal LynxSuperior-Range Bound Renko – Alerts Edition with Advanced Risk Management Template
Signal Lynx | Free Scripts supporting Automation for the Night-Shift Nation 🌙
1. Overview
This is the Alerts & Indicator Edition of Superior-Range Bound Renko (RBR).
The Strategy version is built for backtesting inside TradingView.
This Alerts version is built for automation: it emits clean, discrete alert events that you can route into webhooks, bots, or relay engines (including your own Signal Lynx-style infrastructure).
Under the hood, this script contains the same core engine as the strategy:
Adaptive Range Bounding based on volatility
Renko Brick Emulation on standard candles
A stack of Laguerre Filters for impulse detection
K-Means-style Adaptive SuperTrend for trend confirmation
The full Signal Lynx Risk Management Engine (state machine, layered exits, AATS, RSIS, etc.)
The difference is in what we output:
Instead of placing historical trades, this version:
Plots the entry and RM signals in a separate pane (overlay = false)
Exposes alertconditions for:
Long Entry
Short Entry
Close Long
Close Short
TP1, TP2, TP3 hits (Staged Take Profit)
This makes it ideal as the signal source for automated execution via TradingView Alerts + Webhooks.
2. Quick Action Guide (TL;DR)
Best Timeframe:
4H and above. This is a swing-trading / position-trading style engine, not a micro-scalper.
Best Assets:
Volatile but structured markets, e.g.:
BTC, ETH, XAUUSD (Gold), GBPJPY, and similar high-volatility majors or indices.
Script Type:
indicator() – Alerts & Visualization Only
No built-in order placement
All “orders” are emitted as alerts for your external bot or manual handling
Strategy Type:
Volatility-Adaptive Trend Following + Impulse Detection
using Renko-like structure and multi-layer Laguerre filters.
Repainting:
Designed to be non-repainting on closed candles.
The underlying Risk Management engine is built around previous-bar data (close , high , low ) for execution-critical logic.
Intrabar values can move while the bar is forming (normal for any advanced signal), but once a bar closes, the alert logic is stable.
Recommended Alert Settings:
Condition: one of the built-in signals (see section 3.B)
Options: “Once Per Bar Close” is strongly recommended for automation
Message: JSON, CSV, or simple tokens – whatever your webhook / relay expects
3. Detailed Report: How the Alerts Edition Works
A. Relationship to the Strategy Version
The Alerts Edition shares the same internal logic as the strategy version:
Same Adaptive Lookback and volatility normalization
Same Range and Close Range construction
Same Renko Brick Emulator and directional memory (renkoDir)
Same Fib structures, Laguerre stack, K-Means SuperTrend, and Baseline signals (B1, B2)
Same Risk Management Engine and layered exits
In the strategy script, these signals are wired into strategy.entry, strategy.exit, and strategy.close.
In the alerts script:
We still compute the final entry/exit signals (Fin, CloseEmAll, TakeProfit1Plot, etc.)
Instead of placing trades, we:
Plot them for visual inspection
Expose them via alertcondition(...) so that TradingView can fire alerts.
This ensures that:
If you use the same settings on the same symbol/timeframe, the Alerts Edition and Strategy Edition agree on where entries and exits occur.
(Subject only to normal intrabar vs. bar-close differences.)
B. Signals & Alert Conditions
The alerts script focuses on discrete, automation-friendly events.
Internally, the main signals are:
Fin – Final entry decision from the RM engine
CloseEmAll – RM-driven “hard close” signal (for full-position exits)
TakeProfit1Plot / 2Plot / 3Plot – One-time event markers when each TP stage is hit
On the chart (in the separate indicator pane), you get:
plot(Fin) – where:
+2 = Long Entry event
-2 = Short Entry event
plot(CloseEmAll) – where:
+1 = “Close Long” event
-1 = “Close Short” event
plot(TP1/TP2/TP3) (if Staged TP is enabled) – integer tags for TP hits:
+1 / +2 / +3 = TP1 / TP2 / TP3 for Longs
-1 / -2 / -3 = TP1 / TP2 / TP3 for Shorts
The corresponding alertconditions are:
Long Entry
alertcondition(Fin == 2, title="Long Entry", message="Long Entry Triggered")
Fire this to open/scale a long position in your bot.
Short Entry
alertcondition(Fin == -2, title="Short Entry", message="Short Entry Triggered")
Fire this to open/scale a short position.
Close Long
alertcondition(CloseEmAll == 1, title="Close Long", message="Close Long Triggered")
Fire this to fully exit a long position.
Close Short
alertcondition(CloseEmAll == -1, title="Close Short", message="Close Short Triggered")
Fire this to fully exit a short position.
TP 1 Hit
alertcondition(TakeProfit1Plot != 0, title="TP 1 Hit", message="TP 1 Level Reached")
First staged take profit hit (either long or short). Your bot can interpret the direction based on position state or message tags.
TP 2 Hit
alertcondition(TakeProfit2Plot != 0, title="TP 2 Hit", message="TP 2 Level Reached")
TP 3 Hit
alertcondition(TakeProfit3Plot != 0, title="TP 3 Hit", message="TP 3 Level Reached")
Together, these give you a complete trade lifecycle:
Open Long / Short
Optionally scale out via TP1/TP2/TP3
Close remaining via Close Long / Close Short
All while the Risk Management Engine enforces the same logic as the strategy version.
C. Using This Script for Automation
This Alerts Edition is designed for:
Webhook-based bots
Execution relays (e.g., your own Lynx-Relay-style engine)
Dedicated external trade managers
Typical setup flow:
Add the script to your chart
Same symbol, timeframe, and settings you use in the Strategy Edition backtests.
Configure Inputs:
Longs / Shorts enabled
Risk Management toggles (SL, TS, Staged TP, AATS, RSIS)
Weekend filter (if you do not want weekend trades)
RBR-specific knobs (Adaptive Lookback, Brick type, ATR vs Standard Brick, etc.)
Create Alerts for Each Event Type You Need:
Long Entry
Short Entry
Close Long
Close Short
TP1 / TP2 / TP3 (optional, if your bot handles partial closes)
For each:
Condition: the corresponding alertcondition
Option: “Once Per Bar Close” is strongly recommended
Message:
You can use structured JSON or a simple token set like:
{"side":"long","event":"entry","symbol":"{{ticker}}","time":"{{timenow}}"}
or a simpler text for manual trading like:
LONG ENTRY | {{ticker}} | {{interval}}
Wire Up Your Bot / Relay:
Point TradingView’s webhook URL to your execution engine
Parse the messages and map them into:
Exchange
Symbol
Side (long/short)
Action (open/close/partial)
Size and risk model (this script does not position-size for you; it only signals when, not how much.)
Because the alerts come from a non-repainting, RM-backed engine that you’ve already validated via the Strategy Edition, you get a much cleaner automation pipeline.
D. Repainting Protection (Alerts Edition)
The same protections as the Strategy Edition apply here:
Execution-critical logic (trailing stop, TP triggers, SL, RM state changes) uses previous bar OHLC:
open , high , low , close
No security() with lookahead or future-bar dependencies.
This means:
Alerts are designed to fire on states that would have been visible at bar close, not on hypothetical “future history.”
Important practical note:
Intrabar: While a bar is forming, internal conditions can oscillate.
Bar Close: With “Once Per Bar Close” alerts, the fired signal corresponds to the final state of the engine for that candle, matching your Strategy Edition expectations.
4. For Developers & Modders
You can treat this Alerts script as an ”RM + Alert Framework” and inject any signal logic you want.
Where to plug in:
Find the section:
// BASELINE & SIGNAL GENERATION
You’ll see how B1 and B2 are built from the RBR stack and then combined:
baseSig = B2
altSig = B1
finalSig = sigSwap ? baseSig : altSig
To use your own logic:
Replace or wrap the code that sets baseSig / altSig with your own conditions:
e.g., RSI, MACD, Heikin Ashi filters, candle patterns, volume filters, etc.
Make sure your final decision is still:
2 → Long / Buy signal
-2 → Short / Sell signal
0 → No trade
finalSig is then passed into the RM engine and eventually becomes Fin, which:
Drives the Long/Short Entry alerts
Interacts with the RM state machine to integrate properly with AATS, SL, TS, TP, etc.
Because this script already exposes alertconditions for key lifecycle events, you don’t need to re-wire alerts each time — just ensure your logic feeds into finalSig correctly.
This lets you use the Signal Lynx Risk Management Engine + Alerts wrapper as a drop-in chassis for your own strategies.
5. About Signal Lynx
Automation for the Night-Shift Nation 🌙
Signal Lynx builds tools and templates that help traders move from:
“I have an indicator” → “I have a structured, automatable strategy with real risk management.”
This Superior-Range Bound Renko – Alerts Edition is the automation-focused companion to the Strategy Edition. It’s designed for:
Traders who backtest with the Strategy version
Then deploy live signals with this Alerts version via webhooks or bots
While relying on the same non-repainting, RM-driven logic
We release this code under the Mozilla Public License 2.0 (MPL-2.0) to support the Pine community with:
Transparent, inspectable logic
A reusable Risk Management template
A reference implementation of advanced adaptive logic + alerts
If you are exploring full-stack automation (TradingView → Webhooks → Exchange / VPS), keep Signal Lynx in your search.
License: Mozilla Public License 2.0 (Open Source).
If you build improvements or helpful variants, please consider sharing them back with the community.

Opening Range Breakout (15 mins Range)Take the guesswork out of your trading with the Opening Range Breakout Pro script. This tool automatically marks the high and low of the first 15 minutes of the NYSE session, then highlights the first candle to break out above or below this range—removing ambiguity from your trade entries.
The opening range is one of the most powerful concepts in day trading. By identifying the price range set during the market’s first minutes, you gain a clear framework for your trades. When price breaks out above the range, it often signals a strong bullish move; a break below signals bearish momentum. This script visually marks these moments, so you can react quickly and confidently.
Why use Opening Range Breakout Pro?
• Defined Entry and Exit Points: The script gives you clear, objective breakout levels—no more guessing when to enter a trade.
• Removes Emotional Trading: With visual cues for breakouts, you can follow a systematic approach and avoid hesitation or FOMO.
• Backtested, Time-Tested Strategy: The opening range breakout has been used by professional traders for decades to capture early trends and maximize profit potential.
• High Reward Potential: By capitalizing on the volatility and momentum of the opening session, traders often catch the best moves of the day.
• Easy to Use: Just add to your chart—no configuration needed. The script works on any NYSE stock, on a 5-minute chart.
How it works:
• Draws the opening 15-minute high and low as orange lines.
• Labels the range prices for quick reference.
• Marks the first candle to close above the range with an orange ▲, and the first to close below with an orange ▼.
Take control of your trading day, remove uncertainty, and trade with confidence—just like the pros.

Relative Range at Time/ Relative volatility / High−Low This script is designed to help you compare the size of the current price candle (the difference between the highest and lowest prices in a given time period) to the average size of the last several candles. It does this by calculating the average range of a certain number of previous candles (you can set how many with the "Length" input) and then dividing the current candle's range by this average. The result is plotted on the chart as a bar: if the current candle's range is larger than the average, the bar is green; if it's smaller, the bar is red. A horizontal line is also drawn at the value of 1, so you can easily see whether the current candle's range is above or below the average. If there’s an issue with the data, the script will show an error message to let you know.

[TTI] Closing Range Indicator📜 ––––HISTORY & CREDITS––––
This Pine Script Utility indicator, titled " Closing Range Indicator," is designed and developed by TintinTrading but inspired by the teaching of Investor's Business Daily (IBD) and William O'Neil. It aims to help traders identify the closing range of a given timeframe, either daily or weekly.
🦄 –––UNIQUENESS–––
The unique feature of this indicator lies in its ability to simulate a functionality of Closing Range calculation based on hovering of the mouse over the close. It employs a conditional display that allows the user to set the indicator as 'invisible' without removing it from the chart and hence provides a numerical closing range value when hovering over the indicator.
🛠️ ––––WHAT IT DOES––––
The Closing Range Indicator calculates the closing range of a trading bar in terms of percentages. It computes the difference between the closing price and the low price of the bar, and then divides it by the range of the bar.
A stock that closes on the high would display 100%
A stock that closes on the low would display 0%
Generally, the higher the percentage the more bullish the close but there are exceptions to this rule.
The indicator can operate on two timeframes:
Daily : Computes the closing range based on the daily high, low, and closing prices.
Weekly : Computes the closing range based on the weekly high, low, and closing prices. If you enable the weekly it will show the weekly close on all daily timeframes. Meaning that if the week Closing range is 54.15% on Friday, it will show the value 54.15% for all days prior to Friday from the same week.
The indicator places a label at the close of each bar, with the label's tooltip showing the calculated closing range percentage. I generally hide the label and just reference the tooltip calculation with a a hoover on top of the bar.
💡 ––––HOW TO USE IT––––
Installation: Add the indicator to your TradingView chart by searching for " Closing Range Indicator" in the indicator library.
Reorder: Reorder the indicator so that it sits as the first indicator (even above the price) on the Pane. This will make sure that you always trigger the tooltip functionality.
Go to Settings:
Timeframe: Choose between daily ('D') and weekly ('W') timeframes from the settings.
Visibility: Enable the 'Make Invisible' option if you want the indicator to be hidden.
Interpretation:
A higher percentage indicates that the closing price is closer to the high of the range, signaling bullish sentiment.
A lower percentage indicates bearish sentiment.
Tooltip: Hover over the label to view the closing range in percentage terms.

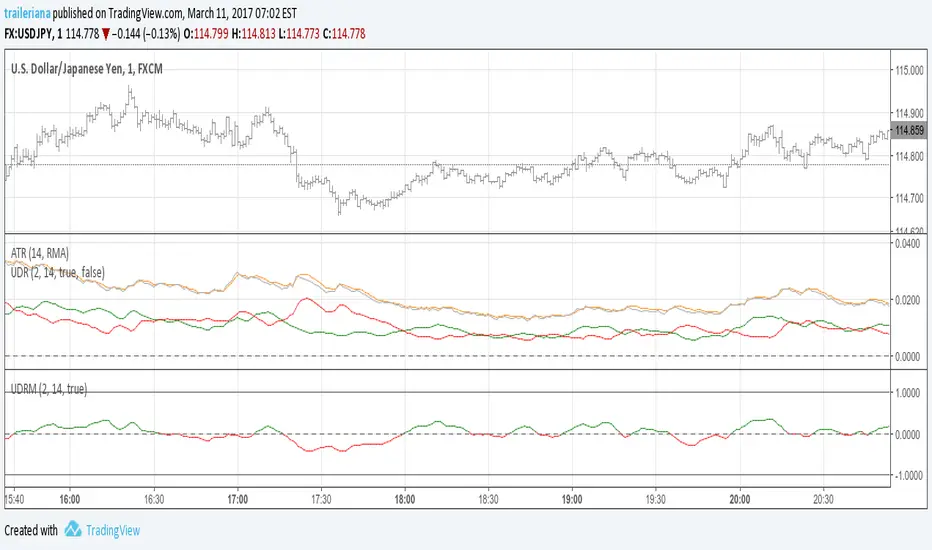
Average True Range Trailing Mean [Alifer]Upgrade of the Average True Range default indicator by TradingView. It adds and plots a trailing mean to show periods of increased volatility more clearly.
ATR TRAILING MEAN
A trailing mean, also known as a moving average, is a statistical calculation used to smooth out data over time and identify trends or patterns in a time series.
In our indicator, it clearly shows when the ATR value spikes outside of it's average range, making it easier to identify periods of increased volatility.
Here's how the ATR Trailing Mean (atr_mean) is calculated:
atr_mean = ta.cum(atr) / (bar_index + 1) * atr_mult
The ta.cum() function calculates the cumulative sum of the ATR over all bars up to the current bar.
(bar_index + 1) represents the number of bars processed up to the current bar, including the current one.
By dividing the cumulative ATR ta.cum(atr) by (bar_index + 1) and then multiplying it by atr_mult (Multiplier), we obtain the ATR Trailing Mean value.
If atr_mult is set to 1.0, the ATR Trailing Mean will be equal to the simple average of the ATR values, and it will follow the ATR's general trend.
However, if atr_mult is increased, the ATR Trailing Mean will react more strongly to the ATR's recent changes, making it more sensitive to short-term fluctuations.
On the other hand, reducing atr_mult will make the ATR Trailing Mean less responsive to recent changes in ATR, making it smoother and less prone to reacting to short-term volatility.
In summary, adjusting the atr_mult input allows traders to fine-tune the ATR Trailing Mean's responsiveness based on their preferred level of sensitivity to recent changes in market volatility.
IMPLEMENTATION IN A STRATEGY
You can easily implement this indicator in an existing strategy, to only enter positions when the ATR is above the ATR Trailing Mean (with Multiplier-adjusted sensitivity). To do so, add the following lines of codes.
Under Inputs:
length = input.int(title="Length", defval=20, minval=1)
atr_mult = input.float(defval=1.0, step = 0.1, title = "Multiplier", tooltip = "Adjust the sensitivity of the ATR Trailing Mean line.")
smoothing = input.string(title="Smoothing", defval="RMA", options= )
ma_function(source, length) =>
switch smoothing
"RMA" => ta.rma(source, length)
"SMA" => ta.sma(source, length)
"EMA" => ta.ema(source, length)
=> ta.wma(source, length)
This will allow you to define the Length of the ATR (lookback length over which the ATR is calculated), the Multiplier to adjust the Trailing Mean's sensitivity and the type of Smoothing to be used for the ATR.
Under Calculations:
atr= ma_function(ta.tr(true), length)
atr_mean = ta.cum(atr) / (bar_index+1) * atr_mult
This will calculate the ATR based on Length and Smoothing, and the resulting ATR Trailing Mean.
Under Entry Conditions, add the following to your existing conditions:
and atr > atr_mean
This will make it so that entries are only triggered when the ATR is above the ATR Trailing Mean (adjusted by the Multiplier value you defined earlier).
ATR - DEFINITION AND HISTORY
The Average True Range (ATR) is a technical indicator used to measure market volatility, regardless of the direction of the price. It was developed by J. Welles Wilder and introduced in his book "New Concepts in Technical Trading Systems" in 1978. ATR provides valuable insights into the degree of price movement or volatility experienced by a financial asset, such as a stock, currency pair, commodity, or cryptocurrency, over a specific period.
ATR - CALCULATION AND USAGE
The ATR calculation involves three components:
1 — True Range (TR): The True Range is a measure of the asset's price movement for a given period. It takes into account the following factors:
The difference between the high and low prices of the current period.
The absolute value of the difference between the high price of the current period and the closing price of the previous period.
The absolute value of the difference between the low price of the current period and the closing price of the previous period.
Mathematically, the True Range (TR) for the current period is calculated as follows:
TR = max(high - low, abs(high - previous_close), abs(low - previous_close))
2 — ATR Calculation: The ATR is calculated as a Moving Average (MA) of the True Range over a specified period.
The ATR is calculated as follows:
ATR = MA(TR, length)
3 — ATR Interpretation: The ATR value represents the average volatility of the asset over the chosen period. Higher ATR values indicate higher volatility, while lower ATR values suggest lower volatility.
Traders and investors can use ATR in various ways:
Setting Stop Loss and Take Profit Levels: ATR can help determine appropriate stop-loss and take-profit levels in trading strategies. A larger ATR value might require wider stop-loss levels to allow for the asset's natural price fluctuations, while a smaller ATR value might allow for tighter stop-loss levels.
Identifying Market Volatility: A sharp increase in ATR might indicate heightened market uncertainty or the potential for significant price movements. Conversely, a decreasing ATR might suggest a period of low volatility and possible consolidation.
Comparing Volatility Between Assets: Since ATR uses absolute values, it shouldn't be used to compare volatility between different assets, as assets with higher prices will consistently have higher ATR values, while assets with lower prices will consistently have lower ATR values. However, the addition of a trailing mean makes such a comparison possible. An asset whose ATR is consistently close to its ATR Trailing Mean will have a lower volatility than an asset whose ATR continuously moves far above and below its ATR Trailing Mean. This can help traders and investors decide which markets to trade based on their risk tolerance and trading strategies.
Determining Position Size: ATR can be used to adjust position sizes, taking into account the asset's volatility. Smaller position sizes might be appropriate for more volatile assets to manage risk effectively.

Relative Bi-Directional Volatility RangeThe basic math behind this Indicator is very similar to the math behind the Relative Strength Index without using a standard deviation as used for the Relative Volatility Index. The Volatility Range is calculated by utilizing the highs and lows. However not in the same way as in the Relative Volatility Index. This approach leads to different values, but the overall result clearly reveals the intrinsic Volatility of the chart, so the user can be aware, when something fundamentally is going on behind the scenes. If the Volatility rises on positive and negative range (-100 to 100) it implies that something fundamental is changing.
An advantage of using this kind of calculation is the possibility of separating the data into positive (buy pressure) and negative (sell pressure) components. The bi-directional character shows a slightly overhang in one of the directions, which can be used to detect a trend. A Moving Average of the users choice shell smoothen the overhang of the Relative Bi-Directional Volatility and show a trend direction. Similar to the math of the Relative Strength Index as standard a Relative Moving Average is preferred. If the Moving Average is in the positive range (0 to 100) it indicates a bullish trend, else if the Moving Average is in the negative range (0 to -100) it indicates a bearish trend. External Indicators can use a provided Trend Shift Signal which switches from 0 to 1, if the trend becomes bullish or from 0 to -1, if the trend becomes bearish.
The user should know, that in this Indicator the starting point of the Moving Averages always begins at the first bar, because the starting progress is approximated appropriately. Most Moving Averages require a minimum number of bars to be calculated, which is chosen with the Moving Average Length. In this cases the length used will be automatically reduced in the background until the number of bars is sufficient to match the chosen length. So if data history is very short, the Indicator can be used never the less as good as possible.
It is feasible to switch the Indicator on a higher timeframe, while staying in a lower timeframe on the chart. This can be useful for making the indication cleaner, if the Moving Average is to choppy and shows too many false signals. On the other hand the benefit of a higher timeframe (or a higher Moving Average Length) is paid with higher latency of the signaling. So the user has to decide what the best setting in his case is.
This Indicator can be used with all kinds of charts. Even charts with percentage or negative values should work fine.

Percentage Range IndicatorThe Percentage Range Indicator is useful for assessing the volatility of pairs for percentage-based grid bots. The higher the percentage range for a given time period, the more trades a grid bot is likely to generate in that period. Conversely, a grid bot can be optimised by using grids that are less than the Percentage Range Indicator value.
I have been using the Percentage Range Indicator based on the one hour time period and 168 periods of smoothing (seven days based on one-hour periods).
Enjoy.

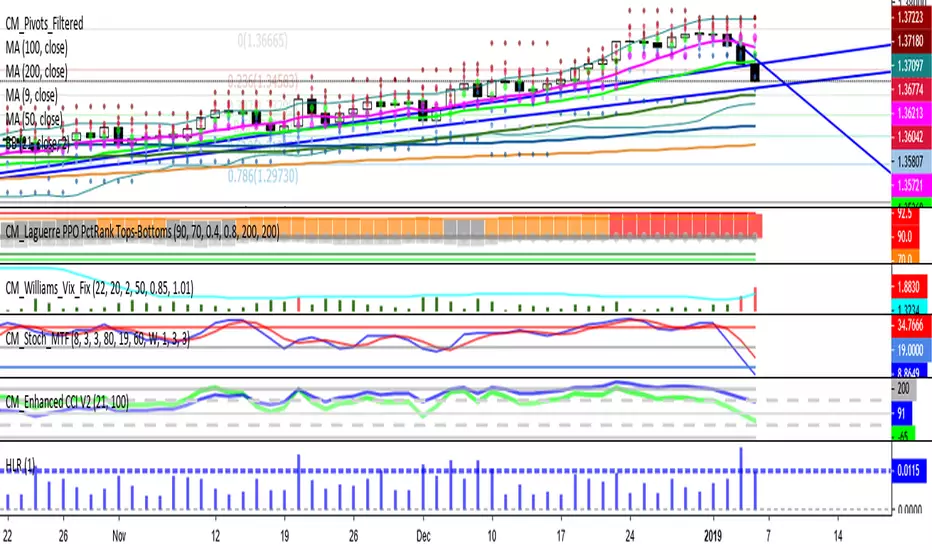
Higher order Orderblocks + Breakerblocks + Range + AlertsThis script identifies Orderblocks, Breakerblocks and Range using higher order pivots and priceaction logic.
I tried to reduce the number of blocks to make the chart cleaner, for this purpose I use only second order pivots for both MSB lines and supply/demand boxes, I also tried to filter out shifts in MS and false breakouts.
Any box has GRAY color until it gets tested.
After successful test box gets colors:
RED for Supply
GREEN for Demand
BLUE for any Breakerblocks
For cleaner chart and script speed all broken boxes deletes from chart.
It gives comparatively clean chart on any TF, even on extra small (5m, 3m, 1m).
For Range there is option to plot 0.25, 0.5, 0.75 lines.
I usually use log scale on charts and there is an option to use it for proper range mean.
In previous my scripts i have requests to make alerts and this time i made it.
It has customizable alert catching all needed alerts into one output:
- Alert MSB - when market structure changes alert will inform you about its direction, MSB line and new Demand/Supply.
- Alert Orderblock or Breakerblock test - alerts when block was tested and it holds (in other words when it get RED/GREEN/BLUE colors)
- Alert New Range - when new range detected
- Alert Range test - alerts when range top or botoom was tested and it holds.
some examples :

Opening Range FibonaccisThis indicator uses the concept of the "Opening Range" to create a Fibonacci zone from the high and low set during a specific time period after open (Defaults to 9:30 - 10:05 AM, EST)
The Opening Range is a popular tool for intraday technical analysis. Price frequently uses these levels as support/resistance, and a breakout from within the range can be a sign of further movement.
The Fibonacci levels are set such that the opening range high/low fall on the +/-0.5 fib. This creates an "extended range" outside of the opening range that may be useful during breakouts.

Classic Candlestick on Range ChartHello traders!
This is my first script to share with everyone! As of right now the range candles on Tradingview are lacking the option to see range charts using the classic candlesticks. This script allows you to overlay a regular candlestick or heikin-ashi candlestick on a range chart!! Unfortunately, the only bar that cannot be a candlestick is the current bar. Once that bar has completed its range then it will update to a regular candlestick.
Install / Use instructions!
-For the best visual appearance it is important to set the transparency of up bars and down bars to 0. This setting is found in the main chart settings under SYMBOL. However, if you want to see the current unfinished range bar you need to set the "projection up bars" and "projection down bars" to the color you prefer.
-To change the colors of the candlesticks is found under the indicator settings like any other script!

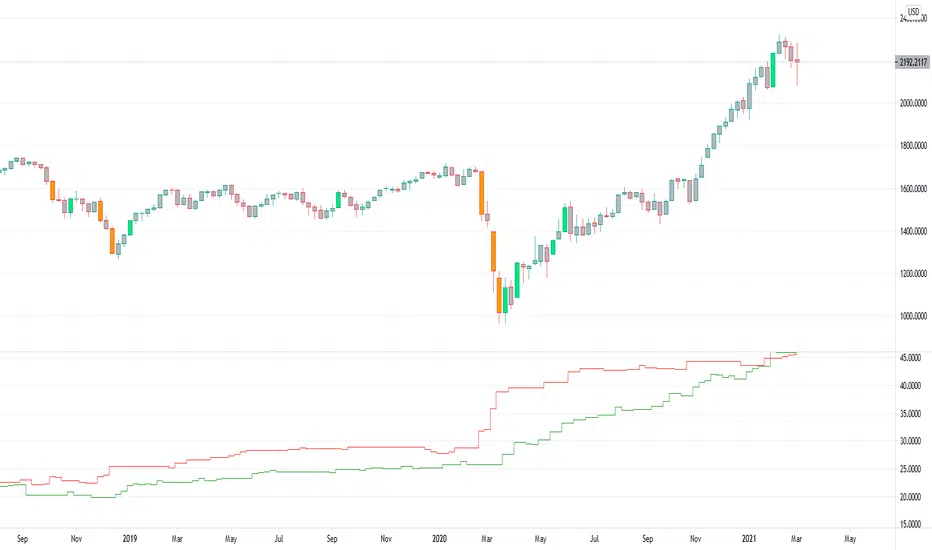
Up-Down RangeHere is an attempt to segregate ATR into ATR of up days and down days.
While setting trailing stops based on ATR, you probably need to consider more on how an instrument can drop during red days. Hence, ATR of only red days makes more compelling case than overall ATR. Another use case for this kind of indicator may be in options if you are selling puts and calls with the intent of pocketing premiums on expiry.
Parameters are as explained below:
Range Type : Different range types are tr (True Range) , close (difference between close prices), highlow (difference between high and low of candle)
Period : ATR Period
Moving Average Type : Moving Average Type for calculating ATR. Two additional types - min and max are added which calculates lowest and highest range in last n bars
HideFullAtr : Hides combined ATR if checked.
Daily RangeHey traders,
at first thanks to the one and only Master Educator Stefan Kassing for sharing his legendary system with us!
And also credit to Mortdiggiddy , RootDuk and PineCoders for helping me with the script =)
This script is calculating the daily range (in pips) of the current market you are in, in relation to the last 70 days (10 weeks) .
It is used for a possible Take Profit in Stefan Kassing's System .
How to add the script to your chart:
1. Click " Add to Favorite Scripts "
-> i.imgur.com
2. Go in the Chart & click the little arrow in the upper bar and then click " Daily Range ", then the Daily Range appears in the top left corner
-> i.imgur.com
To avoid errors make sure to right-click the Y-Axis on the right side of the chart and then left-click "Scale Price Chart Only" .
-> i.imgur.com
Also be aware that the daily range is only showing up , if you are in the daily time interval or below and you are not hovering with the cursor over the past candles respectively above or below them .
If you are using this script in exotic currencypairs or uncommon other markets , the daily range can be incorrect or not showing up .
So don't hesitate contacting me , then I will try to add the markets that you want to.
To change the color or the decimal places of the number, you can click the gear in the upper left corner.
-> i.imgur.com
Happy Pips

Up/Down Range MomentumThe Up/Down Range breaks the price range into an upward and a downward moving component, so we can easily turn it into a momentum oscillator. This script does just that.
You can find the Up/Down Range (UDR) indicator here: