Joel on Crypto - MACD ScalpingJoel on Crypto - MACD Scalping
This is a Scalping indicator primarily intended for the 5 minute time frame.
It is based on the Crypto Scalping YouTuber Joel on Crypto's popular 5 minute scalping strategy and this is the indicator he personally use when Scalping.
This is a Multi-timeframe indicator where if you use it on the 5 minute time frame, the MACD Histogram bars will be based on the 1 minute timeframe.
The purpose of this indicator is not to trade it like a bot. The purpose is to grab the traders attention a time where there COULD be a scalping opportunity.
Use this indicator at your own risk.
Search in scripts for "scalping"


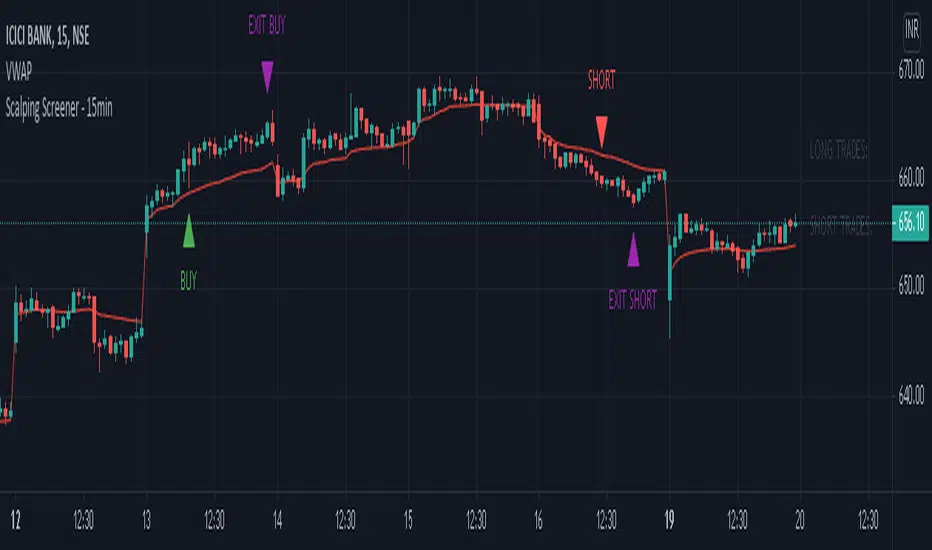
Scalping Screener - 15minSCALPING SCREENER - 15 mins (Indicator Tool)
TIME FRAME to use - 15 mins
DURATION OF TRADE - Using this indicator, Trade must be taken only during market hours and must be closed before market close (must not be carried forrward for next day).
SCALPING - This is a scalping strategy that is intended to make small profits in intraday trading
ENTRY CONCEPT -
- There must be 2 bulish candles and the 2nd candle's high should be greater than first candle's high.
- And If the latest candle high breaks high of the 2nd candle (prev candle), BUY signal is generated.
- Additional filters are added to reduce non-performaing trades.
- visa versa for SHORT signal
EXIT CONCEPT -
- 2nd candles low is the stop loss.
- Difference between 2nd candle high and 2nd candle low is target.
- The script will indicate when to BUY / SHORT and when to EXIT the trade.
INSTRUMENTS TO TRADE -
- High volatility instruments are best to be traded
- Nifty 50 stocks have been added to this indicator for the sake of screener. User can change these stocks with high volatility ones
- There is a limitation to add upto 40 scripts.
SCREENER FUNCTION -
- Right side of the chart has screener section which shows the list of stocks that qualify as per the BUY / SELL signal
NOTE -
The purpose of the scipt is for self learning / improvement and analysis.
Trading is a risky business and a trader must take any trade at their own RISK.
The author shall not be held responsible for Losses / Profits
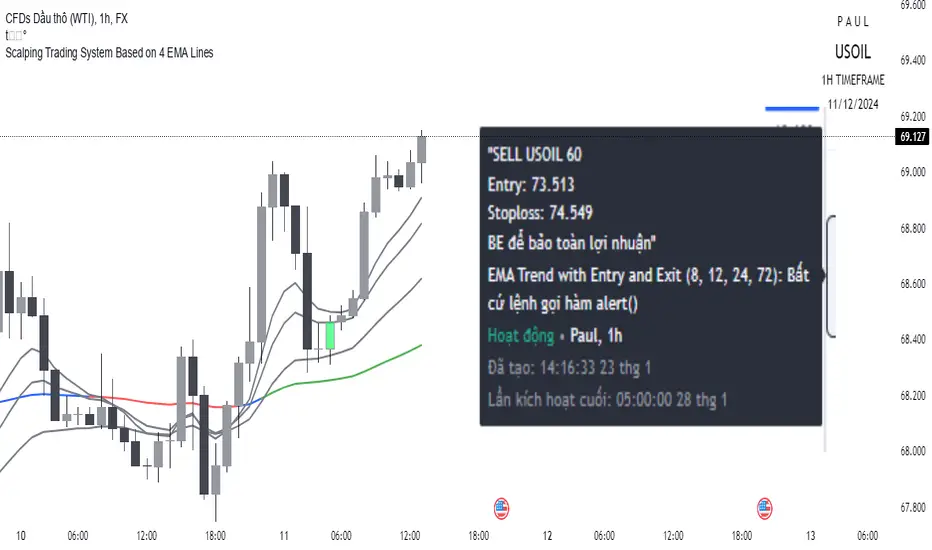
Scalping trading system based on 4 ema linesScalping Trading System Based on 4 EMA Lines
Overview:
This is a scalping trading strategy built on signals from 4 EMA moving averages: EMA(8), EMA(12), EMA(24) and EMA(72).
Conditions:
- Time frame: H1 (1 hour).
- Trading assets: Applicable to major currency pairs with high volatility
- Risk management: Use a maximum of 1-2% of capital for each transaction. The order holding time can be from a few hours to a few days, depending on the price fluctuation amplitude.
Trading rules:
Determine the main trend:
Uptrend: EMA(8), EMA(12) and EMA(24) are above EMA(72).
Downtrend: EMA(8), EMA(12) and EMA(24) are below EMA(72).
Trade in the direction of the main trend** (buy in an uptrend and sell in a downtrend).
Entry conditions:
- Only trade in a clearly trending market.
Uptrend:
- Wait for the price to correct to the EMA(24).
- Enter a buy order when the price closes above the EMA(24).
- Place a stop loss below the bottom of the EMA(24) candle that has just been swept.
Downtrend:
- Wait for the price to correct to the EMA(24).
- Enter a sell order when the price closes below the EMA(24).
- Place a stop loss above the top of the EMA(24) candle that has just been swept.
Take profit and order management:
- Take profit when the price moves 20 to 40 pips in the direction of the trade.
Use Trailing Stop to optimize profits instead of setting a fixed Take Profit.
Note:
- Do not trade within 30 minutes before and after the announcement of important economic news, as the price may fluctuate abnormally.
Additional filters:
To increase the success rate and reduce noise, this strategy uses additional conditions:
1. The price is calculated only when the candle closes (no repaint).
2. When sweeping through EMA(24), the price needs to close above EMA(24).
3. The closing price must be higher than 50% of the candle's length.
4. **The bottom of the candle sweeping through EMA(24) must be lower than the bottom of the previous candle (liquidity sweep).
---
Alert function:
When the EMA(24) sweep conditions are met, the system will trigger an alert if you have set it up.
- Entry point: The closing price of the candle sweeping through EMA(24).
- Stop Loss:
- Buy Order: Place at the bottom of the sweep candle.
- Sell Order: Place at the top of the sweep candle.
---
Note:
This strategy is designed to help traders identify profitable trading opportunities based on trends. However, no strategy is 100% guaranteed to be successful. Please test it thoroughly on a demo account before using it.
Scalping Support Resistance StrategyScalping strategy for BTC using one line: Support Resistance.
The strategy draws a line based on the minimum value of the average of High, Low, and Close for a given bar. The entries are carried out on the breakdown of this line. Exits are managed by the specified in the script's inputs take-profit and stop-loss percentages.
From Stream:
www.tradingview.com

Scalping with Bill Williams AlligatorScalping strategy based on Bill Williams Alligator technique but calculated with heikin ashi candles.
This strategy has to be applied to standard candles and low time frames (1min to 5min)
Thanks to all pinescripters mentined in the code for their snippets.
It could be improved with stop loss based on ATR etc.
I have also a study with alerts.
Please use comment section for any feedback or contact me if you need support.

SCALPING & WOLFEBold line name is TRENDLINE.
Thin line name is SCALPINGLINE.
Chronosphere line time changeable scalpingline. And ninja line fast line. Experience to use.
When TRENDLINE is 100 or TRENDLINE color green and SCALPINGLINE is 0 , this is a buying opportunity.
When TRENDLINE is 0 or TRENDLINE color red and SCALPINGLINE is the opportunity of selling when it is between 80 and 100.
When when the vertical green bar shows this is bullish wolfe formation occurs and check the scalping black and blue indicator position goes to upward the you will see the trend is up and so when the vertical red bar shows this is bearish wolfe pattern.
For access indicator use link on may profile or message me.
Enjoy:)

Scalping Strategy with SL and TP activation settingsThis strategy can be used on pretty much every timeframe that gives you a satisfying performance and will give you entries with a high probability of a winning trade.
Recommended are lower timeframes, because after all this is a scalping strategy and with that your chart wont be cluttered.
How to use this script?
Currently you can setup your positions SL and TP, because the markets vary in volatility it could improve the performance of the strategy.
You will simply get your signals and can decide to act upon them.
Stop loss: Simply your stop loss order which will trigger when price moves a given % away from your entry.
TP-Activation: When price reaches your % target it will trigger a stop limit order. So if price turns against your position after reaching your target it will close your position in profit and if it runs in your favoured direction it will trigger at a later stage.
Trailing-Offset-%: After reaching your % target it will trigger the TP order with an offset. So if you set your trailing offset to 0.1%, your TP order will be set behind 0.1 %. This can be used to test if the strategy would perform as well
if you leave more room for trades to play out.
Will this script make me profitable?
No strategy is a silver bullet and it depends mostly on you.
Trading is not easy and most people fail, because their risk management skills arent solid or they cant control their emotions.
This script will give you statistically often good entries, so even if you hit a losing streak your SL will protect you from losing more than necessary until you get a winning streak.
Patience and consistency is key to be profitable in the long run.
Does the script repaint?
Although you will get a notification when setting an alarm that the indicator may repaint, no security function is used and the signals will stay on the chart, because the signal is calculated based on the last candle close and will trigger with the next candle.
I am still looking into why that notification pops up.
You are free to try the indicator for a limited time to be sure.
My experience with the strategy
The overall statistical advantage is great. The strategy can be used simply as it is, but becomes better if you already have some experience with trading. Sometimes it will give you a good entry, reaches your target and the price still goes in your preferred direction. So your trading returns and experience could be improved with confluence, but it is totally fine as it is and if used right will help you get going.
Disclaimer: This is no financial advice. This is a tool and I am not responsible for your actions.
If you are interested in the indicator feel free to dm me on TradingView.

Scalping Strategy Signal v2 by [INFINITYTRADER]Overview
This Pine Script (v6) implements a scalping strategy that uses higher timeframe data (default: 4H) to generate entry and exit signals, originally designed for the 15-minute timeframe with an option for 30-minute charts. The "Scalping Strategy Signal v2 by " integrates moving averages, RSI, volume, ATR, and candlestick patterns to identify trading opportunities. It features adjustable risk management with ATR-based stop-loss, take-profit, and trailing stops, plus dynamic position sizing based on user-set capital. Trades trigger only on the higher timeframe candle close (e.g., 4H) to limit activity within the same period. This closed-source script offers a structured scalping approach, blending multiple entry methods and risk controls for adaptability across market conditions.
What Makes It Unique
Unlike typical scalping scripts relying on single-indicator triggers (e.g., RSI alone or basic MA crossovers), this strategy combines four distinct entry methods—standard MA crossovers, RSI-based momentum shifts, trend-following shorts, and candlestick pattern logic—evaluated on a 4H timeframe for confirmation. This multi-layered design, paired with re-entry logic after losses and a mix of manual, ATR-based, and trailing exits, aims to balance trade frequency and reliability. The higher timeframe filter adds precision not commonly found in simpler scalping tools, while the 30-minute option enhances consistency by reducing noise.
How It Works
Timeframe Logic
Runs on a base timeframe (designed for 15-minute charts, with a 30-minute option) while pulling data from a user-chosen higher timeframe (default: 4H) for signal accuracy.
Limits entries to the close of each 4H candle, ensuring one trade per period to avoid over-trading in volatile conditions.
Indicators and Data
Moving Averages : Employs 21-period and 50-period simple moving averages on the higher timeframe to detect trends and signal entries/exits.
Volume : Requires volume to exceed 70% of its 20-period average on the higher timeframe for momentum confirmation.
RSI : Uses a 14-period RSI for overbought/oversold filtering and a 6-period RSI for precise entry timing.
ATR : Applies a 14-period Average True Range on the higher timeframe to set adaptive stop-loss and take-profit levels.
Candlestick Patterns : Analyzes consecutive green or red 4H bars for trend continuation signals.
Why These Indicators
The blend of moving averages, RSI, volume, ATR, and candlestick patterns forms a robust scalping framework. Moving averages establish trend context, RSI filters momentum and avoids extremes, volume confirms market activity, ATR adjusts risk to volatility, and candlestick patterns enhance entry timing with price action insights. Together, they target small, frequent moves in flat or trending markets, with the 4H filter reducing false signals common in lower-timeframe scalping.
Entry Conditions
Four entry methods are evaluated at the 4H candle close:
Standard Long Entry: Price crosses above the 21-period moving average, volume exceeds 70% of its 20-period average, and the 1H 14-period RSI is below 70—confirms uptrend momentum.
Special Long Entry: The 6-period RSI crosses above 23, price is more than 1.5 times the ATR from the 21-period moving average, and price exceeds its prior close—targets oversold bounces with a stop-loss at the 4H candle’s low.
Short Entries:
- RSI-Based: The 6-period RSI crosses below 68 with volume support—catches overbought pullbacks.
- Trend-Based: Price crosses below the 21-period moving average, volume is above 70% of its average, and the 1H 14-period RSI is above 30—confirms downtrends.
Red/Green Bar Logic: Two consecutive green 4H bars for longs or red 4H bars for shorts—uses candlestick patterns for continuation, with a tight stop-loss from the base timeframe candle.
Re-Entry Logic
Long : After a losing special long, triggers when the 6-period RSI crosses 27 and price crosses the 21-period moving average.
Short : After a losing short, triggers when the 6-period RSI crosses 50 and price crosses below the 21-period moving average.
Purpose: Offers recovery opportunities with stricter conditions.
Exit Conditions
Manual Exits: Longs close if the 21-period MA crosses below the 50-period MA or the 1H 14-period RSI exceeds 68; shorts close if the 21-period MA crosses above the 50-period MA or RSI drops below 25.
ATR-Based TP/SL: Stop-loss is entry price ± ATR × 1.5 (default); take-profit is ± ATR × 4 (default), checked at 4H close.
Trailing Stop: Adjusts ±6x ATR from peak/trough, closing if price retraces within 1x ATR.
Special/Tight SL: Special longs exit if price opens below the 4H candle’s low; 4th method entries use the base timeframe candle’s low/high, checked every bar.
Position Sizing
Bases trade value on user-set capital (default: 100 USDT), dividing by the higher timeframe close price for dynamic sizing.
Visualization
Displays a table at the bottom-right with current/previous signals, TP/SL levels, equity, trading pair, and trade size—color-coded for clarity (green for buy, red for sell).
Inputs
Initial Capital (USDT): Sets trade value (default: 100, min: 1).
ATR Stop-Loss Multiplier: Adjusts SL distance (default: 1.5, min: 1).
ATR Take-Profit Multiplier: Adjusts TP distance (default: 4, min: 1).
Higher Timeframe: Selects analysis timeframe (options: 1m, 5m, 15m, 30m, 1H, 4H, D, W; default: 4H).
Usage Notes
Intended Timeframe: Designed for 15-minute charts with 4H confirmation for precision and frequency; 30-minute charts improve consistency by reducing noise.
Backtesting: Adjust ATR multipliers and capital to match your asset’s volatility and risk tolerance.
Risk Management: Combines manual, ATR, and trailing exits—monitor to avoid overexposure.
Limitations: 4H candle-close dependency may delay entries in fast markets; RSI/volume filters can reduce trades in low-momentum periods.
Backtest Observations
Tested on BTC/USDT (4H higher timeframe, default settings: Initial Capital: 100 USDT, ATR SL: 1.5x, ATR TP: 4x) across market conditions, comparing 15-minute and 30-minute charts:
Bull Market (Jul 2023 - Dec 2023):
15-Minute: 277 long, 219 short; Win Rate: 42.74%; P&L: 108%; Drawdown: 1.99%; Profit Factor: 3.074.
30-Minute: 257 long, 215 short; Win Rate: 49.58%; P&L: 116.85%; Drawdown: 2.34%; Profit Factor: 3.14.
Notes: Moving average crossovers and green bar patterns suited this bullish phase; 30-minute improved win rate and P&L by filtering weaker signals.
Bear Market (Jan 2022 - Jun 2022):
15-Minute: 262 long, 211 short; Win Rate: 44.4%; P&L: 239.80%; Drawdown: 3.74%; Profit Factor: 3.419.
30-Minute: 250 long, 200 short; Win Rate: 52.22%; P&L: 258.77%; Drawdown: 5.34%; Profit Factor: 3.461.
Notes: Red bar patterns and RSI shorts thrived in the downtrend; 30-minute cut choppy reversals for better consistency.
Flat Market (Jan 2021 - Jun 2021):
15-Minute: 280 long, 208 short; Win Rate: 51.84%; P&L: 340.33%; Drawdown: 9.59%; Profit Factor: 2.924.
30-Minute: 270 long, 209 short; Win Rate: 55.11%; P&L: 315.42%; Drawdown: 7.21%; Profit Factor: 2.598.
Notes: High trade frequency and P&L showed strength in ranges; 30-minute lowered drawdown for better risk control.
Results reflect historical performance on BTC/USDT with default settings—users should test on their assets and timeframes. Past performance does not guarantee future results and is shared only to illustrate the strategy’s behavior.
Why It Works Well in Flat Markets
A "flat market" lacks strong directional trends, with price oscillating around moving averages, as in Jan 2021 - Jun 2021 for BTC/USDT. This strategy excels here because its crossover-based entries trigger frequently in tight ranges. In trending markets, an exit might not be followed by a new entry without a pullback, but flat markets produce multiple crossovers, enabling more trades. ATR-based TP/SL and trailing stops capture these small swings, while RSI and volume filters ensure momentum, driving high P&L and win rates.
Technical Details
Built in Pine Script v6 for TradingView compatibility.
Prevents overlapping trades with long/short checks.
Handles edge cases like zero division and auto-detects the trading pair’s base currency (e.g., BTC from BTCUSDT).
This strategy suits scalpers seeking structured entries and risk management. Test on 15-minute or 30-minute charts to match your style and market conditions.

Scalping Grid at Pivot Point FibonacciThis strategy sets a grid of stop orders once price touch one Fibonacci weekly pivots.
This works very well for scalping as the price touch a pivot level.
Take care when you work with grids because drawdown could be very high.
Study with alarms is available at request.
Please use comment section for any feedback.
Next improvement (only to whom is interested to this script and follows me): study with alerts on multiple tickers all at one. Leave a comment if you want to have access to study.
********************************** IMPORTANT*******************************
I have developed an expert advisor for metatrader4 (MT4) and for jforex platform: results of expert advisor form 2015-01-01 to 2018-11-25 are very good with low drawdown and good profit.
********************************************************************************

Scalping with Williams %R, MACD, and SMA (1m)Overview:
This trading strategy is designed for scalping in the 1-minute timeframe. It uses a combination of the Williams %R, MACD, and SMA indicators to generate buy and sell signals. It also includes alert functionalities to notify users when trades are executed or closed.
Indicators Used:
Williams %R : A momentum indicator that measures overbought and oversold conditions. The Williams %R values range from -100 to 0.
Length: 140 bars (i.e., 140-period).
MACD (Moving Average Convergence Divergence) : A trend-following momentum indicator that shows the relationship between two moving averages of a security's price.
Fast Length: 24 bars
Slow Length: 52 bars
MACD Length: 9 bars (signal line)
SMA (Simple Moving Average) : A trend-following indicator that smooths out price data to create a trend-following indicator.
Length: 7 bars
Conditions and Logic:
Timeframe Check :
The strategy is designed specifically for the 1-minute timeframe. If the current chart is not on the 1-minute timeframe, a warning label is displayed on the chart instructing the user to switch to the 1-minute timeframe.
Williams %R Conditions :
Buy Condition: The strategy looks for a crossover of Williams %R from below -94 to above -94. This indicates a potential buying opportunity when the market is moving out of an oversold condition.
Sell Condition: The strategy looks for a crossunder of Williams %R from above -6 to below -6. This indicates a potential selling opportunity when the market is moving out of an overbought condition.
Deactivate Buy: If Williams %R crosses above -40, the buy signal is deactivated, suggesting that the buying condition is no longer valid.
Deactivate Sell: If Williams %R crosses below -60, the sell signal is deactivated, suggesting that the selling condition is no longer valid.
MACD Conditions :
MACD Histogram: Used to identify the momentum and the direction of the trend.
Long Entry: The strategy initiates a buy order if the MACD histogram shows a positive bar after a negative bar while a buy condition is active and Williams %R is above -94.
Long Exit: The strategy exits the buy position if the MACD histogram turns negative and is below the previous histogram bar.
Short Entry: The strategy initiates a sell order if the MACD histogram shows a negative bar after a positive bar while a sell condition is active and Williams %R is below -6.
Short Exit: The strategy exits the sell position if the MACD histogram turns positive and is above the previous histogram bar.
Trend Confirmation (Using SMA) :
Bullish Trend: The strategy considers a bullish trend if the current price is above the 7-bar SMA. A buy signal is only considered if this condition is met.
Bearish Trend: The strategy considers a bearish trend if the current price is below the 7-bar SMA. A sell signal is only considered if this condition is met.
Alerts:
Long Entry Alert: An alert is triggered when a buy order is executed.
Long Exit Alert: An alert is triggered when the buy order is closed.
Short Entry Alert: An alert is triggered when a sell order is executed.
Short Exit Alert: An alert is triggered when the sell order is closed.
Summary:
Buy Signal: Activated when Williams %R crosses above -94 and the price is above the 7-bar SMA. A buy order is placed if the MACD histogram shows a positive bar after a negative bar. The buy order is closed when the MACD histogram turns negative and is below the previous histogram bar.
Sell Signal: Activated when Williams %R crosses below -6 and the price is below the 7-bar SMA. A sell order is placed if the MACD histogram shows a negative bar after a positive bar. The sell order is closed when the MACD histogram turns positive and is above the previous histogram bar.
This strategy combines momentum (Williams %R), trend-following (MACD), and trend confirmation (SMA) to identify trading opportunities in the 1-minute timeframe. It is designed for short-term trading or scalping.


Scalping The BullNome: Scalping The Bull (Indicatore)
Categoria: Scalping, Trend Following, Mean Reversion.
Timeframe: 1M, 5M, 30M, 1D, secondo la conformazione specifica.
(follow description in english)
Analisi tecnica: l’indicatore supporta le operatività descritte nei video di YouTube del canale “Scalping The Bull”. Di norma si basa su price action e medie mobili esponenziali.
Le varie tecniche che possono essere usate insieme all’indicatore sono sintetizzate nei settaggi dell’indicatore e si può fare riferimento ai video specifici per la spiegazione completa.
Utilizzo consigliato: Altcoin che presentano forti trend per scalping e operazioni intra-day.
Configurazione: È possibile configurare lo strumento in maniera semplice e completa.
Medie:
Medie per mercato: e’ possibile utilizzare le medie mobili esponenziali (EMA) esclusivamente per il mercato Crypto (5/10/60/223).
Media addizionale: e’ possibile visualizzare una media aggiuntiva, e.g. a 20 periodi.
Elementi del grafico:
Sfondo: segnala con lo sfondo del grafico in verde una situazione di uptrend ( EMA 60 > EMA 223) e in rosso sfondo rosso una situazione di downtrend (EMA 60 < EMA 223).
Separatori di sessioni: indica l’inizio della sessione corrente.
Punti Trigger:
Massimi e minimi di oggi: disegna sul grafico il prezzo di apertura della candela daily e i massimi e i minimi di giornata.
Massimi minimi di ieri: disegna sul grafico il prezzo di apertura della candela daily, i massimi e i minimi del giorno prima.
(English description)
Name: Scalping The Bull (Indicator)
Category: Scalping, Trend Following, Mean Reversion.
Timeframe: 1M, 5M, 30M, 1D depending on the specific signal.
Technical Analysis: The indicator supports the operations described in the YouTube videos of the channel "Scalping The Bull". Usually it is based on price action and exponential moving averages.
The various techniques that can be used in conjunction with the indicator are summarized in the indicator settings and you can refer to the specific videos for the full explanation.
Suggested usage: Altcoin showing strong trends for scalping and intra-day trades.
Configuration:
Exponential Moving Averages
Per market: you can display averages exclusively for the Crypto market (5/10/60/223).
Additional Average: You can display an additional average, e.g. 20-period average.
Chart elements:
Session Separators: indicates the beginning of the current session.
Background: signals with the background in green an uptrend situation ( 60 > 223) and in red background a downtrend situation (60 < 223).
Trigger points:
Today's highs and lows: draw on the chart the opening price of the daily candle and the highs and lows of the day.
Yesterday's highs and lows: draw on the chart the opening price of the daily candle, the highs and lows of the previous day.

Scalping The Bull PRO IndicatorName : Scalping The Bull PRO Indicator
Category : Scalping, Trend Following, Mean Reversion .
Timeframe : 1M, 5M, 30M, 1D depending on the specific technique.
Technical Analysis : The indicator supports the operations of the trader named "Scalping The Bull" who uses price action and exponential moving averages.
Suggested usage : Crypto Market only , on Altcoins showing strong trends for scalping and intra-day trades. Trigger points are used as entry and exit points and to be used to understand when a signal has more power.
Scalping The Bull PRO Indicator can identify automatically the following conformations with labels on the charts and/or custom alerts.
Shimano : look at the price records of a consecutive series of closings between the EMA 60 and the EMA 223 when a certain threshold is reached. Use the trigger points as price structures to identify entry and exit zones (e.g. breakout of the yesterday high as for entry point).
Bomb : look at the price registers a percentage variation in a single candle, greater than a threshold such as 2%, in particular on shorter timeframes and around the trigger points.
Viagra : look when there is a consecutive series of closes below the EMA 10, a breakout of the EMA should be an important sign of the change of the trend. Viagra can be used with either a Trend-following or Counter-trend approach, so it can be observed when EMA 60 is lower than EMA 223, or when EMA 60 is higher than EMA 223.
Downward fake : look when, after a cross under (Death Cross), the price returns above the EMA 223 using the yesterday high as a trigger point.
Emergence : look at the EMA 60 is about to cross over the EMA 223.
Anti-crossing : look at, after an important price rise and a subsequent retracement, the EMA 60 is about to cross under the EMA 223 but a bullish impulse brings the price back above the EMAs.
For Sales : look at two types of situations: 1) when the price falls by more than 10% from the opening price and around yesterday's low or 2) when the price falls and then reaches, in the last 5 days, a bigger percentage and then breaks a trigger point.
Colour change : look at the opening price of the session - indicated as a trigger point.
Third touch of EMA 60 : look for 3 touches below the EMA 60, and enter when there is a close above the EMA 60.
Third touch of EMA 223 : look for 3 touches below the EMA 223, and enter when there is a close above the EMA 223.
Bud : look at price when it crosses upwards the average 10 and subsequently at least 2 "rest" candles are between the maximum and minimum of the breaking candle.
Fake on EMA 10 : look for the open of a candle higher than the EMA 10, the minimum of the candle lower and the closing price returns above the EMA 10.
For Stop Loss and Profit Targets consider a proper R/R depending on Risk Management, using price structures such as the low of the entering candle and a quick Position Management moving quickly the Stop-Loss at Break-Even.
Configuration :
Graphical Configuration :
Additional EMA : You can display an additional average, e.g. 20-period average.
Session Separators : indicates the beginning of the current session (in blue) .
Background : signals with the background in green an uptrend situation ( 60 > 223) and in red background a downtrend situation (60 < 223).
Labels of Trigger Points .
Take Profit Levels with a display offset .
Label size .
Trigger points :
Today's highs and lows : draw on the chart the opening price of the daily candle and the highs and lows of the day (high in purple, low in red and open in green). An alert can be activated with % offset.
Yesterday's highs and lows : draw on the chart the opening price of the daily candle, the highs and lows of the previous day (high in yellow, low in red). An alert can be activated with % offset.
Colour Change : an alert can be activated with % offset.
EMA Conformations :
Shimano : a label and/or an alert can be activated with a configurable threshold of candles.
Emersion : a label and/or an alert can be activated.
Anti-crossing : a label and/or an alert can be activated.
Fake on EMA : a label and/or an alert can be activated with a configurable threshold of candles.
Price-EMA Conformations :
Viagra : a label and/or an alert can be activated for specific EMA situations, with a configurable threshold of candles.
Third Touch on EMA : a label and/or an alert can be activated for a specific EMA bounce.
Bud : a label and/or an alert can be activated on all timeframes except 1m.
Fake on EMA 10 : a label and/or an alert can be activated on all timeframes except 1m.
Bud + Fake : a label and/or an alert can be activated on all timeframes except 1m.
Price Conformations :
Bomb : a label and/or an alert can be activated with a configurable threshold %.
For Sales : a label and/or an alert can be activated with a configurable threshold %.
Activate all alerts : you can activate all alerts clicking on Alerts, then on Condition “PRO Scalping the Bull” and then selecting “Any alert() function”.
N.B. It is also possible to creates alerts on price-EMA crossing.

Scalping BerkinAlex 1
--------Inglés---------
Updated to Pine Script v4. 👌
Added labels (indicators) of Purchase and Sale according to moving averages for scalping and intraday. 🤑
Fusion of the "Scalping BerkinAlex 3" indicator with the "Scalping BerkinAlex 1", so as not to occupy a slot of indicators unnecessarily if you have a free account. 😜
Alert system designed, now you can create an alert in free mode according to the possibility of buying or selling an asset.🔔
Errors found fixed.💪
---------Español---------
Actualizado a Pine Script v4. 👌
Añadidas etiquetas (indicadores) de Compra y Venta según medias móviles para scalping e intradía. 🤑
Fusión del indicador "Scalping BerkinAlex 3" con el "Scalping BerkinAlex 1", para así no ocupar un slot de indicadores innecesariamente en caso de disponer cuenta gratuita. 😜
Sistema de alertas diseñado, ahora podrás crear una alerta en modo gratuito según exista la posibilidad de comprar o vender un activo.🔔
Errores encontrados solucionados.💪

Scalping The Bull - BullBot for Stock and ForexName : Scalping The Bull - BullBot for Stock and Forex.
Category : Scalping tool for the Stock and Forex market, optimized for trend following and mean reversal operations.
Timeframe : Recommended to be used on timeframe 1m, 5m, 30m, 1h, 1D, depending on the specific technique.
Technical Analysis : The indicator implements the trading techniques of Scalping The Bull. Even if the techniques are exquisitely discretionary, we have written the indicator with our interpretation of the them to identify the patterns automatically. We also codified a the process described below, giving the possibility to trade mechanically. The indicator is designed for a short-term (intraday or scalping) trend-following approach, where the entry is made on the breakout of significant price levels. Entry setups are calculated by price action analysis using 5-10-50-200 EMAs as reference. According to the interaction of price action with the EMAs, patterns are generated, and the indicator finds them independently.
Suggested use :
The process follows:
1. Selection of the instrument to trade on
Given the short duration of the trades, there must be sufficient volatility and liquidity. You can add the different instruments to a TradingView watch list and then make a first skim, considering the daily percentage change. Once an instrument has been selected, the indicator allows you to check at a glance things like the Rate of Change (ROC) and the detection of opening gaps.
2. Identification of the main trend
Once in the instrument, the main trend of the underlying is identified through the 50-200 EMAs: if the fast EMA is greater than the slow one, we have a bullish trend, otherwise a bearish trend on a higher timeframe than the one in which the trade is executed. The rule is to trade in favor of the main trend. For this reason, the indicator prints to chart reference averages. It is also recommended to check the daily timeframe, always using the averages, preferring those instruments where the price follows an average without touching it too often.
3. Identification of breakout levels
Breakout levels favoring the trend are identified near the daily high/minimum, the previous day's high/minimum, or the weekly high/minimum. The indicator prints such levels on the chart with lines.
4. Identification of secondary trends and entry levels
Patterns can be divided into three categories. Trend-based ones have the function of identifying the secondary trend and then confirming the trade. Breakout patterns are used to find entry levels.
a. Trend Continuation Patterns (Price/EMA) : are used to get confirmation that the minor trend is in agreement with the major trend (i.e., Shimano, Dive, Dip, Anti-crossing).
b. Trend Change Patterns (Price/EMA) : are used to get confirmation that a minor trend in the opposite direction of the main trend is ending and therefore are used to get further confirmation of the trade (i.e., Bounce, Viagra, Return to Highs/Minimums).
c. Breakout Patterns : identify the optimal price levels for trade entry (i.e., Third Touch, Bud, Maxi Bud, Color Change).
Details on how the specific patterns are computed can be found below in the description of this indicator.
5. Definition of Stop Loss and Take Profit
Once the entry price is calculated, different types of Stop Loss (e.g., relative minimum of Tot candles, first or second average below price, price levels) and Take Profit (relative maximum of Tot candles, first or second average above price, price levels) can be considered. A risk/reward ratio of at least 1.2 should always be considered, depending on one's risk appetite.
6. Define the position management strategy
Normally, when a mock breakout is executed, the advice is to exit the trade as soon as possible or at least to bring the stop-loss to break even. A trailing stop on relative lows or the nearest average is also possible.
7. Enter the position
Usually, with a stop order, follow the rules defined in the previous steps.
Configuration :
Graphical configuration :
Show ROC filter : turns the background green when the asset has enough volatility to activate patterns.
Show Legend : enables the description on the lines of the trigger points.
Show Table : displays the volatility table where the GAP and ROC (Rate of Change) information is present.
Show Take Profit % - Automatic : shows the percentage scale that automatically adjusts to the volatility of the chart to identify the Take Profit and Stop Loss at a glance.
Label color : adjusts the color of the labels.
Trigger Point Colors : Adjust the colors of the trigger points.
Trigger Points
Today's highs and lows : draw on the chart the closing price of Yesterday, the opening price of the daily candlestick, and the highs and lows of the day (high in purple, low in red, Yesterday's close in green, and open in orange).
Yesterday's highs and lows : draw on the chart the highs and lows of the previous day (high in yellow, low in red). An alert can be activated with a % offset.
Weekly highs and lows : draw the highs and lows of the previous week on the chart (high in white, low in red). An alert can be activated with a % offset.
Price Patterns :
Gap : a label and an alert can be activated.
Pay..!! : a label and an alert can be activated.
Third Touch and Third Touch on EMA : a label and an alert can be activated.
Return to Highs : a label and an alarm can be activated.
Return to Lows : a label and an alarm can be activated.
Long and Short Color Change : a label and an alert can be activated.
EMA Patterns :
Viagra long and short : a label and an alert can be activated for the specific market and EMA situations.
Shimano : a label and an alert can be activated with a configurable candlestick threshold.
Emergence - Dive : a label and an alert can be activated.
Anti-crossing - Anti-crossing short : a label and an alarm can be activated.
Bounce on EMA long and short : a label and an alert can be activated with a configurable tick tolerance.
Bud - Maxi Bud - Bud Short : a label and an alert can be activated on all timeframes.
Alerts :
Activate all alerts : you can activate alerts by clicking on Alerts, then on the condition "BullBot" and then on "Any alert() function.". So that you know, creating alerts on the price-EMA crossing is also possible.
Patterns :
The list of patterns that are automatically recognized by the indicator follows.
Gap : indicates when a Gap Up or Gap Down occurs at the opening of a session, particularly useful in the equity markets.
Pay : signals when the stock has risen by a sufficient percentage to be tradable, adjusts the triggering of many bounce and breakout patterns.
Viagra : signaled for both a long and short setup, indicates an overbought or oversold situation by the appearance of gaps and a series of consecutive candles contained by the fast EMAs (5 -10) depending on the market of reference.
Third touch and third touch EMA : signals a breakout conformation, indicated when three touches occur at the same price level or below one of the slow EMAs (50 - 200).
Shimano : detects lateralization between Ema 50 and Ema 200, indicating that we are in a retracement phase and that a new impulsive move may soon develop.
Emergence - Dive : these are the main patterns for identifying the trend. The indicator signals when the EMA 50 and 200 are approaching to anticipate their crossing to the top or bottom.
Anti-crossing long - Anti-crossing short : occurs when the price, after an important impulse, makes a retracement to the EMA 200, bringing the EMA 50 to approach it without ever touching it, but before the cross, an opposite impulse determines the end of the retracement and the resumption of the trend in place.
Rebound : signals in the first rebound on the EMA 50 and EMA 200 after an impulse that recorded new highs or lows.
Return to the Highs - Return to the Lows : this pattern is closely related to rebounds. It indicates that the price is approaching the highs or lows again after a rebound on a slow EMA.
Change Color : is based on the previous session's closing price. It indicates when the price is approaching either from above or below this level, which determines the Color of the daily candlestick.
Bud - Maxi Bud - Bud Short : Bud occurs when the price breaks above EMA 10, and there are at least two consecutive candles between the high and low of the breakout impulse. Maxi Bud signals near the day's highs when this situation occurs, and Bud Short signals the breakout levels for a short trade.

Scalping The Bull - BTC Chart for Trend AnalysisName: BTC Chart for Trend Analysis
Category: Scalping, Trend Analysis .
Timeframe: 1M, 5M, 30M, 1D depending on the specific technique.
Technical Analysis: The indicator supports the operations of the trader named "Scalping The Bull" who uses BTC as an Index for Crypto trading.
Suggested usage: When trading on altcoins, to check whether or not they are trending with Bitcoin and whether those anticipate its movements.
It is therefore possible to see Bitcoin specifically if it makes red or green candles and how it is positioned with respect to the EMA 5, 10, 60, 223, however configurable from the panel.
Used in conjunction with Scalping The Bull Indicator or PRO Indicator, on the main panel.
Configuration:
EMA Length:
- EMA 1: by default 5, configurable
- EMA 2: by default 10, configurable
- EMA 3: by default 60, configurable
- EMA 4: by default 223, configurable
Colors can be modified from "Settings" > "Style"
Designed to be used with the following the indicator:

Scalping The Bull IndicatorName: Scalping The Bull Indicator
Category: Scalping, Trend Following, Mean Reversion.
Timeframe: 1M, 5M, 30M, 1D depending on the specific technique.
Technical Analysis: The indicator supports the operations of the trader named "Scalping The Bull" which uses price action and exponential moving averages.
Suggested usage: Altcoin showing strong trends for scalping and intra-day trades. Trigger points are used as entry and exit points and to be used to understand when a signal has more power.
It is possible to identify the following conformations:
Shimano: look at the price records of a consecutive series of closings between the EMA 60 and the EMA 223 when a certain threshold is reached. Use the trigger points as price structures to identify entry and exit zones (e.g. breakout of the yesterday high as for entry point) .
Bomb: look at the price registers a percentage variation in a single candle, greater than a threshold such as 2%, in particular on shorter timeframes and around the trigger points.
Viagra: look at there is a consecutive series of closes below the EMA 10.
Downward fake: look when, after a cross under (Death Cross), the price returns above the EMA 223 using the yesterday high as a trigger point.
Emergence: look at the EMA 60 is about to cross over the EMA 223.
Anti-crossing: look at, after an important price rise and a subsequent retracement, the EMA 60 is about to cross under the EMA 223 but a bullish impulse brings the price back above the EMAs.
For Sales: look at two types of situations: 1) when the price falls by more than 10% from the opening price and around the yesterday’s low or 2) when the price falls and then reaches, in the last 5 days, a bigger percentage and then breaks a trigger point.
Colour change: look at the opening price of the session - indicated as a trigger point.
Third touch of EMA 60: look for 3 touches below the EMA 60, and enter when there is a close above the EMA 60.
Third touch of EMA 223: look for 3 touches when there are 3 touches below the EMA 223, and enter when there is a close above the EMA 60.
Bud: look at price when it crosses upwards the average 10 and subsequently at least 2 "rest" candles are between the maximum and minimum of the breaking candle.
Fake on EMA 10: look for the open of a candle higher than the EMA 10, the minimum of the candle lower and the closing price returns above the EMA 10..
For Stop Loss and Profit Targets consider a proper R/R depending on Risk Management, using price structures such as the low of the entering candle and a quick Position Management moving quickly the Stop-Loss at Break-Even.
Configuration:
Market
EMA: The indicator automatically configure itself on market it knows (Binance, Piazza Affari and NASDAQ) otherwise it can be configured manually fo Crypto market (5/10/60/223) or Stock Market (5/10/50/200).
Additional Average: You can display an additional average, e.g. 20-period average.
Chart elements:
Session Separators: indicates the beginning of the current session (in blue)
Background: signals with the background in green an uptrend situation ( 60 > 223) and in red background a downtrend situation (60 < 223).
Trigger points:
Today's highs and lows: draw on the chart the opening price of the daily candle and the highs and lows of the day (high in purple, low in red and open in green)
Yesterday's highs and lows: draw on the chart the opening price of the daily candle, the highs and lows of the previous day (high in yellow, low in red).
Credits
Massimo : for refactoring and suggestions.

Scalping rubicointThe scalping strategy is very common in currency trading, since Forex is a market that generally presents very clear trends in very short periods of time. There are different indicators for scalping, such as the RSI (relative strength) or the investment volume, the important thing is to choose one and apply it correctly. An example of a one-minute scalping strategy is buying 20,000 euros in EUR / USD when the currency pair is trending upwards (such as + 0.33%). Since it is relatively rare for the trend to reverse in one minute, the trader following this Forex scalping trend would sell them after one minute. Typically at the end of the sale of the currency is that the investor will earn a margin close to + 0.33% for the total value of the investment.

Scalping long-shortThe Scalping long-short indicator is a comprehensive system for analyzing candle patterns and trading volume, designed for use in a scalping strategy. The main purpose of the indicator is to identify the key points of changing market sentiment and provide the trader with accurate signals for entering a trade.
The main components of the indicator:
1. Candle Pattern Analysis:
The indicator analyzes four main candle patterns:
-A Bullish Hammer is a candle with a small body and a long lower tail, which indicates the possible completion of a downward movement and the beginning of an uptrend.
-Bearish Hanging Man is a candle similar to a bullish hammer, but it appears after an upward movement, signaling the possible beginning of a downtrend.
-Bullish Engulfing is a candle with a large body that completely covers the body of the previous candle, showing strong buyer interest.
-Bearish Engulfing is the reverse situation, when a large bearish candle absorbs the previous bullish candle, indicating the predominance of sellers.
-Doji is a candle with almost identical opening and closing prices, indicating market indecision.
For each of these patterns, the indicator sets certain threshold values that the user can adjust to their preferences and features of the trading instrument.
2. Volume analysis:
The volume is an important confirmation of the strength of the signal. The indicator compares the current volume with the average value for the user-selected period (length parameter) multiplied by the volumeMultiplier coefficient. If the current volume exceeds this indicator, the signal is considered confirmed.
3. Visual indication:
Graphical elements corresponding to each type of signal are displayed on the price chart.:
-The green triangle down is a buy signal (bullish hammer or bullish takeover).
-The red triangle up is a sell signal (bearish hanging or bearish engulfing).
-The yellow diamond is a neutral state (doji).
These visual cues help you quickly assess the current market situation without having to analyze each candle manually in depth.
4. Alerts:
The indicator supports setting alerts that can be sent via the TradingView platform or other supporting systems. This allows the trader to receive notifications about the occurrence of new signals even outside the workplace.
Settings:
The user can change the following settings:
-Length is the period for calculating the average volume.
-Multiplier is a multiplier for the thresholds of candle patterns.
-HammerThreshold, HangingManThreshold, EngulfingThreshold, DojiThreshold are Thresholds for recognizing specific candlestick patterns.
-VolumeMultiplier is a coefficient for comparing the current volume with the average value.
These parameters allow you to adapt the indicator to various trading instruments and time intervals, making it a universal tool for a wide range of traders.
Conclusion:
The Scalping long-short indicator combines powerful analytical tools to identify key points in the market, providing the trader with clear and timely signals for making trading decisions. Its flexibility and fine-tuning capability make it useful for both beginners and experienced market participants.

Scalping PullBack Tool R1 by JustUncleLDescription
This study project is a Scalping Pullback trading Tool that incorporates the majority of the indicators needed to analyse and scalp Trends for Pull Backs and reversals on 1min, 5min or 15min charts. The set up utilies Heikin Ashi candle charts. Incorporated within this tool are the following indicators:
1. Major industry (Banks) recognised important EMAs in an EMA Ribbon:
Green = EMA89
Blue = EMA200
Black = EMA633
2. The 36EMA (default) High/Low+Close Price Action Channel (PAC).
3. Fractals
4. HH, LH, LL, HL finder to help with drawing Trend lines and mini Trend Lines.
5. Coloured coded Bar high lighting based on the PAC:
blue = bar closed above PAC
red = bar closed below PAC
gray = bar closed inside PAC
red line = EMA36 of bar close
Setup and hints:
Set the chart to Heikin Ashi Candles.
Add "Sweetspot Gold10" indicator to the chart as well to help with support and resistance finding and shows where the important "00" and "0" lines are.
When price is above the PAC(blue bars) we are only looking to buy as price comes back to the PAC
When price is below the PAC(red bars), we are only looking to sell when price comes back to the PAC
What we’re looking for when price comes back into the PAC we draw mini Trendlines utilising the Fractals and HH/LL points to guide your TL drawing.
Now look for the trend to pull back and break the drawn TL. That's is when we place the scalp trade.
So we are looking for continuation signals in terms of a strong, momentum driven pullbacks (normally short term 10-20 pips) of the EMA36.
The other EMAs are there to check for other Pullbacks when EMA36 is broken.
Other than the SweetSpot Gold10 indicator, you should not need any other indicator to scalp the pullbacks.
References:
Fractals V8 by RicardoSantos
Price Action Trading System v0.3 by JustUncleL
SweetSpot Gold10 R1 by JustUncleL
www.swing-trade-stocks.com
www.forexstrategiesresources.com

Scalping Alice 3/5INTRO
Scalping Alice is a work in progress. I made it to help with my Scalping Long strategy as a helper for entrances.
This instance of the indicator is for 3min and 5min chart analysis only.
It still needs to further adopt and calibrate multi-frame data, but for the moment it takes from the Daily, the Hourly and the 15min.
It is meant to be used WITHOUT candles. This is because, one of the goals I'm trying to achieve is to compress data and leave out unwanted noise.
The 3min and 5min candles are very dynamic (specially in the crypto market), so I don't need to know the whole OHLC, but I do need a range.
COMPONENTS
Small Blob
The first component is the current time-frame Price Blob. The top line is the candle Highs and the bottom line is the candle Lows.
The Price Blob's Color changes according to a Double RSI which you can modify the values for.
The default is 13 for the Fast RSI and 34 for the Slow RSI.
When the Fast RSI is on top it turns Green. When the Slow RSI is on top it turns Red.
Big Blob
The Outer Blob is the same as the inner blob, but in the 15min time-frame. It changes color the exact same way, but with 15min values.
WMA Line
The closest line to the blob is the WMA line. You can change the default value, which is 21.
The color changes according to a complex modifier, that I will try to explain, but most likely fail.
It takes a sort of Tenkan (see Ichimoku Cloud if you don't know what a Tenkan is) value from the 15min chart and the Hourly chart.
It then compares the difference from these Tenkans and adds it to the 15min mid price.
And finally tries to find a fast Trend of the movement of the price for the last 3 candles.
The Tenkan value can be changed from it's default 3. Be wary, this changes the Tenkans for all the timeframes.
Blue Tenkan
The slower line is an Hourly Tenkan but with a value of 9.
Saturation Clouds
The last piece are the orange Saturation Clouds. These appear in bigger price movements and work weirdly.
They are differences between Hourly Tenkan and current frame Tenkan, along added to the mid point of the price and a little bit of Bollinger math.
Again, hard to explain, but they are very useful. Maybe one of the most useful parts of Alice.
BULL AND BEAR
Bullish :
- Green Small Blob
- Green Big Blob
- Green WMA
- Small Price Blob Above WMA
- Small Price Blob Above Blue Tenkan
- Small Price Blob Inside Upper Saturation Cloud
- Lower Saturation Cloud appears but DOES NOT touch Small Price Blob
Bearish
- Red Small Blob
- Red Big Blob
- Red WMA
- Small Price Blob Below WMA
- Small Price Blob Below Blue Tenkan
- Small Price Blob Inside Lower Saturation Cloud
- Upper Saturation Cloud appears but DOES NOT touch Small Price Blob
SMALL TIPS
Saturation Clouds
When the Saturation Clouds appear, it is an indication of strong price decision.
If it appears but it is far from the Small Blob then this indicates Price Reversal.
Most likely a nice moment to enter an opposite trend trade.
If the cloud appears touching the Small Blob and the Small Blob enters the cloud, this is Trend Confirmation.
The price is going to go strongly towards the Trend is is on.
Most likely a nice moment to enter an accompanying trend trade.
Price Bounce
The Small Blob bounces inside the Big Blob. This is very useful for numerous short plays.
You have better chances opening longs when the price is on the Lower parts of the Blobs.
The same goes for shorts on the Upper Parts.
Slow and Fast
The color of the WMA is a very fast indicator, it's the least reliable one.
Then comes the Small Blob color, then comes the WMA itself.
Following that you have the Big Blob color, then the blue Tenkan.
And finally the Saturation Clouds are the most reliable part.
FINAL THOUGHTS
This is a publishable version of this strategy. I hope to keep working on these types of strategies, maybe even upgrading this one.
Enjoy, share and leave comments!

Scalping IchimokuBased on the Ichimoku Cloud indicator, the Scalping Ichimoku is a strategy applied in a simple form.
How the strategy works?
The indicator will watch two filters from the Ichimoku Cloud indicator. The first one is when the price crosses the cloud (over or under). The second filter is when the conversion line crosses the baseline (over or under). When both filters happen, no matter the order or when the indicator will print an arrow signal.
Buy Signal
A buy signal, or arrow up, will appear when the price crosses over the cloud and when the conversion line crosses over the baseline.
Sell Signal
A sell signal, or arrow down, will appear when the price crosses under the cloud and the conversion line crosses under the baseline.
Exit Points
Show Exit Spots enabled. The indicator will print possible exit spots for the last entry, based on the cross from conversion with baseline. In case the cross is against the latest entry signal, it will show an "X"
One Signal At Time
The indicator will print only one signal in a single direction. It will never print the same signal as the last signal
Exit and Entry Spot At The Same Candle
In the chart, when the entry spot and an exit spot appear in the same candle, the exit spot will appear with a different color. This means that the entry spot is more accurate.
This strategy was designed for scalping, no matter the time frame or market, but it may work for swing traders as well.
