BBD+1. BBD+ can be used on equities, futures, forex and crypto and also on different time frame (daily, weekly and hourly) as well, we advise only look for hourly chart or longer time frame.
2. Consist of fundflow candle, moving average line and triangle signal.
3. The indicator is easy to use and interpret the direction and strength of smart money.
4. Fundflow candle :-
− GREEN candle = smart money inflow > smart money outflow
Green candle above 0 value = opportunity ;
Green candle below 0 value = monitor/hold/rebound
− RED candle = smart money inflow < smart money outflow
Red candle above 0 value = monitor/hold/retracement ;
Red candle below 0 value = risk
− The longer candle indicate higher volume of smart money
5. Moving average line :-
− GREEN line = 5-days moving average (m5)
− BLUE line = 10-days moving average (m10)
− RED line = 20-days moving average (m20)
6. Triangle signal :-
− Arrow-UP triangle = Fundflow candle cross up GREEN line (5-days moving average)
− Arrow-DOWN triangle = Fundflow candle cross down GREEN line (5-days moving average)
7. Five (5) alert conditions are set to notify when desired condition was triggered, i.e.
(1) BBD+ cross-up m5
(2) BBD+ turn GREEN
(3) BBD+ turn RED
(4) BBD+ cross-up ZERO-axis
(5) BBD+ cross-down ZERO-axis
8. Background color indicate the color of smart money candle.
9. BBD+ is not advised to be used solely for the purpose of buy/sell, work best together with indicator TrendX+, DDX+ and MCDX+.
Search in scripts for "smart"

Support and Resistance Based Off Indicators V2Theory Behind It"
There have been hundreds of trading methods and theories that have been proposed by the trading community, each with a unique perspective on trading. One of the most popular theories is known as the Dow theory which was one of the first theories to theorise the concept known today as trends. Now the majority of today's trading strategies are based off the single concept known as "trends."
These concepts and theories have shaped many traders strategies and trading plans to this day. And with a new era of easy access trading, in which nearly anyone with a wifi connection, and computer, or smartphone an trade hundreds of markets brings a light to traders known as retail traders. Which according to Credit Suisse, have accounted for a third of all stock market activity in the United States at points this year. This means that Retail traders are now a community of “market players” that are knowledgeable investors who seek to learn and incorporate their own trading strategies into the market.
This newfound significance of retail traders in the market prompted me to consider a new concept, which I've dubbed the "retail theory." This theory combines the theory that intraday traders move market prices, and if we can figure out what the majority of these retail traders are doing, we can trade based on other traders rather than the actual financial instrument. This notion may be difficult to grasp, so let's break it down.
Let's say there are ten people who can pick any color from a bag. Out of the ten people, Yellow is the favorite colour of two people, blue is the favourite colour of one person, and red is the favourite colour of seven people. Let's pretend we had to bet on which colour the majority of those ten people would choose. While it's evident that we'd all bet on red to win because it's the most popular color, but how does this apply to the markets?
While traders, as we all know, use a variety of indicators to determine where to buy and sell. Some of the most popular indicators that majority of traders use are the moving averages, exponential moving averages, bollinger bands, fib levels, pivot points, vwap, etc. Now tt's impossible to say which indicators are preferred by the majority of traders, but if the majority of indicators align at a certain level, we may infer that the majority of traders will be looking to buy or sell at that level. This is where the indicators-based support and resistance indicator (I know, bad name, but I'm not that creative) comes into play. We can get a good indication of where the bulk of traders will be looking to add or sell by looking at the top indicators on the market and seeing if they are within range of each other. When this is combined with the basic theory of trends, we are able to gain a competitive advantage in the market that few traders have, known as an edge.
If you have any questions based on this theory let me know, but as I said before this theory is based on the concept that we are trading based off majority of what other traders think or are trading off of, not what we think
How It Works:
This indicator checks to see if other types of support and resistance indicators, such as the EMA, VWAP, FIb levels, and so on, are within range of one another. Simply put, when two indicators are within range of each other, a box will appear indicating where they are matching. The color of the box is determined by the number of indicators that line up within the same range, which can be adjusted with user input.
The user also has free range to change all input settings
How To Use:
This is a form of resistance and support indicator that should be used in conjunction with other technical tools. Each box color shows the number of indicators that are aligned with one another. A yellow box, for example, indicates that six or more indicators are within range of each other, but a white box indicates that only two indicators are within range of each other.
These boxes that appear should just be used as a type of support and resistance, but again you can see the strength of the support and resistance by the color.
Notes:
I came out with the concept version about a month ago, and since then it has been nothing but prefect for me. I found with 5 or more indicators line up within each other, then that area tends to be a key "dip buy" area for me. Also acts as a extremely powerful support or resistance if the indicator lines up with trendlines, or horizontal daily supports

Quansium Series A BacktestThis comes with preconfigured setups or strategies. Simply choose one from our list based on the timeframe it was made for. Leverage can be changed; to keep trading safe, a maximum of 2 is allowed. In our findings, this was able to trade crypto (specifically BTC ), MES (Micro E-mini S&P 500 Index Futures ), and stocks. It is important to know that setups A, B, C, and D use variable position sizing, and dynamic stop loss/trailing stop/take profit, these parameters are provided through the alerts. The rest of the strategies were created with a simpler approach in mind, just plainly entry/exits signals.
Quansium as a framework:
Price reformat: we take the price source (Open, Close, High, Low) and remove any noise that affects the accuracy of our signals.
Time awareness: we take several time periods of the data on the chart such as start, end, and whole. We use this to add more depth to our signals.
Position size: our backtest tries to recreate as much as the real world trades as possible so our position is determined by the current equity. We also use the volatility of the market to increase or decrease our exposure or risk.
Risk awareness: stop loss, take profit, trailing stop are the risk exits we use to provide our users some peace of mind. These parameters are totally dynamic and follow the same behavior of the market.
Signals filtering: to make almost non-existent any errors and increase the quality of our trades, our indicators go through multiple phases, this avoid double entries or early exits, and help maintain a record of what has transpired and what’s currently taking place.
Indicators: whenever we can we use custom code or our own functions instead of the defaults ones provided. This gives us total control of what we’re trying to achieve. In many cases we tend to combine several indicators’ logic into one creating a more personalized take on it.
Easiness: since we started our main goal has been to provide the easiest and fastest way to alerts’ creation. It has taken us years to reach this level where now we already provide a list of preset strategies so the user doesn’t have to spend much time tinkering with scripts and more on other matters, because we know life is more than just trading.
Raw signals: we provide the option to turn off as much of our advanced features such as stop loss, take profit, trailing stop, dynamic sizing, etc, etc for a simple approach. Trade signals still go through the signals filtering method mentioned above,
Timeframe pairing: we take trading very seriously, by no way we’ll want the user to lose money (although such thing is expected because past results aren’t an indicative of futures ones), through years of experience we have found what are usually common mistakes the user makes, this feature allows us to only activate the strategy if the right timeframe is chosen.
Trend filters: through the years we have improved the arts of the trend. We like to keep things simple but yet powerful. We observe the macro and micro trend of the security. This helps confirm we are entering at the desirable timing. We also incorporate volume and volatility into decision making, we simply programmed it to trade when these are increasing and higher than the average values observed in both the short and long term. Finally we take into account the strength of the pair to make our final choice of whether to enter or wait, and if anything flashes contrary movement then we cancel the upcoming signal and stop monitoring until the next one comes along.
Full automated risk: stop loss, take profit, and trailing stops usually are set in percentages, and optimized even more using the current market behavior to become more adaptive. But always remains some sort of fixation, so the user must choose a value somewhere. This is where our framework shines the most, as previously mentioned before when we take time into our calculations, we use several periods to observe performance and get values that keep our risk exits natural and closest to the flow of the market itself.
Setups:
A: Centered oscillator with the difference of several moving averages with more sensitive settings. Momentum focused.
B: Centered oscillator using simple moving averages. Trend-Following focused.
C: Centered oscillator using smoothed data with the help of faster moving averages. Trend-Following focused.
D: Centered oscillator with the difference of several moving averages with less sensitive settings. Trend-Following focused.
E: Centered oscillator with the difference of moving averages where the standard deviation is applied first. It uses less sensitive settings. Trend-Following focused.
F: Finds the relationship between multiple readings of the price’s relative strength to better pin-point downs and ups. Trend-Following focused.
G: Centered oscillator with the difference of moving averages where the standard deviation is applied first. It uses more sensitive settings. Momentum focused.
H: Multiple centered oscillators using various moving averages. Trend-Following focused.
I: Centered oscillator using simple moving averages. Momentum focused.
Note: The framework is composed of almost 1000 lines of code as compared to each indicator that makes up the setup which is around 10. The power from Quansium doesn't come from the strategies themselves but rather the overall system that turns simple signals into complex and advanced trades.
Strategy Tester:
Initial Capital: chosen value is $20,000, as an approximate to Bitcoin’s ATH (All-Time High). In previous iterations we noticed some trades won’t go through if the capital was less than the ATH.
Order Size: 100% of equity (although the script controls this, and this is of no regards to the results).
Pyramiding: 1, system doesn’t place multiple entries in a row, only one at a time.
Commission: This simulates order execution with custom trading fees. Commissions are turned off by default because this script works in various markets and each operates differently. In order to reach results that are close to real world conditions, it is imperative the user fills this based upon their broker or exchange data.
When we started, we were focused on finding the best indicator, or creating it ourselves. After years we came to realize that the secret is not in which indicator you use but the framework behind it. All strategies have bad, good, best, worst performance periods. The key of a good system is to help keep you safe when it’s down and maximize your potential when it’s up. We hope this material at the very minimum inspires you to keep going and not lose faith, because it is not the smartest who win but those who persevere.

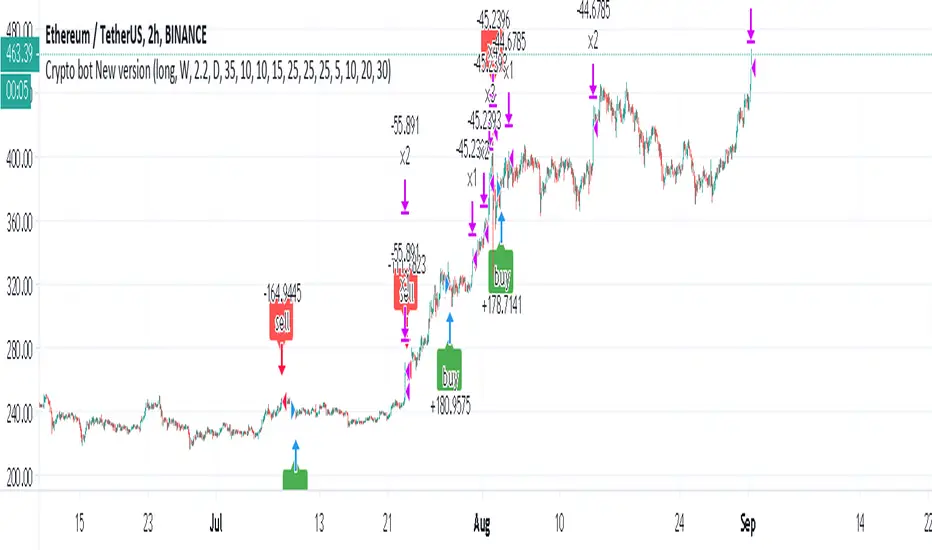
Crypto bot New versionOk this strategy is for those who want to take risks but to do it smartly
based on a modified version of as buy entry
the exit is mix of highest of pivot and fib level (similar to pivot bot that i put early but with my improve setup)
this bot is non repaint one as no security attach to it
set to 10% of lot and 10X levrage
it very good for longs (quite shity for shorts:)
the exit control by high time frame and the factor (set to 2.2)
the buy is control bu HTF
this is my setting for Ethereum
the take profit is set to take at each point 25% and then to move forward with it (5,10,20,30%)
in a bullish market as we are now this is logical setting. in bearish one you need to set your target lower
there is no repaint here
as you see the strategy start from 2018 when ether was around 1300 and despite what happen in the market it was making very decent profit
Risk management is key for winning so if you use my strategy be aware that this strategy is a very slow one but in long term seems to be very good
try to find the settings that suite you
use the factor to see if it make the exit better or worse
the strategy can work on other assets not just crypto but you need to find the best settings for it
LuxAlgo® - Signals & Overlays™Signals & Overlays™ is an all-in-one toolkit made up of more than 20+ features primarily focused on generating useful signals & overlays to fulfill any trader's technical analysis needs with relevant data.
Created directly with TradingView Pine Script Wizard, alexgrover - this is a first of its kind comprehensive script made fully from the ground-up to provide an all-in-one solution for traders.
Signals & Overlays™ can be used alongside other forms of technical analysis, however, it was also designed to be used as a stand-alone toolkit that can fit any trading style. Every feature included considers how not all technical indicators fit every market condition.
The ideal way to utilize this indicator is to explore through all of the features over time, pick & choose 2-3 features best suit your style of trading, and stick with those to create your own unique LuxAlgo trading strategy.
Providing Endless Possibilities Catering To All Trading Styles
Signals & Overlays™ works in any market for discretionary analysis & includes many features:
Beginner-friendly Presets to enable multiple features at once within one-click (locks other settings when enabled).
Confirmation Signals: Normal & Strong signals to help traders confirm trends (not to be followed blindly).
Contrarian Signals: Normal & Strong to help traders spot reversals (also not to be followed blindly).
Exit Signals: "x" marks that apply for both Confirmation Signals & Contrarian Signals to suggest potential take-profit areas during signals.
Signal Optimization Methods: Sensitivity / Agility, optimal sensitvity parameter displayed on dashboard, and Autopilot (dynamic setting).
Candle Coloring: Purple/Green/Red to visualize trends developing between 'normal' & 'strong'.
6+ Indicator Overlays that helps traders visualize trends, find reversal points, and get dynamic areas of support & resistance.
Filters within "Presets / Filters" to allow users to filter Confirmation Signals with Indicator Overlays & other metrics within LuxAlgo Premium.
A complete dashboard with highly actionable metrics such as Trend Strength, current volatility, volume analysis, etc.
Advanced Settings to display customizable TP/SL points, further enhance signal optimizations, & customize dashboard size/location.
Full Any Alert() Function Call Conditions included
Highly useful Filtered Alert Creator section to generate custom filtered signal alerts with Indicator Overlays & other metrics.
+ more. (Check the changelog below for current features)
🔶 USAGE
Basic Signals & Candle Coloring Demonstration
In the image below we can see a basic example of how these 2 core components function within Signals & Overlays™.
As explained earlier, the Confirmation Signals can generate normal labels as well as strong labels marked by the "+" symbol. These signals are directly correlated to the candle coloring in order to see the development of trends & navigate through different market conditions as best as possible.
The candle coloring comes especially in handy when using signals, whereas a positive sign for an uptrend to occur rather than a fake-out is to see candles consistently hold as green. This indicates the market is strong & is likely to continue an uptrend. Vice versa for sell signals & the candles holding as red.
Normal Confirmation Signals often occur with smaller trends, retracements within larger trends, or just as signals a user may not want to trust as much directly. In order to enhance your ability to trust signals more & find more actionable use cases out of LuxAlgo Premium, we recommend going to the settings menu of the indicator & activating some indicator overlays. These are covered in the next section.
🔶 INDICATOR OVERLAYS W/ SIGNALS
In the image below we have enabled the "Smart Trail" & "Reversal Zones" indicator overlays from within the settings of Signals & Overlays™. By using these overlays alongside the signals & candle coloring, users can find more confluence to create trading strategies or plans.
The Smart Trail provides an excellent area of dynamic support/resistance for traders, as well as an additional confluence for general trend following purposes alongside the Confirmation Signals.
The Reversal Zones are particularly useful for areas to immediately take profit on trades, however, during strong trends price may continue rising or falling through the Reversal Zones which makes a good use case of waiting for price to first exit the Reversal Zones before considering the next move in the market.
In the next image below we can see the market is generally ranging, making it more complicated for the standard Confirmation signals to perform greatly as they are meant to excel for finding developing trends. This image displays the Contrarian Signal Mode, Contrarian Gradient candle coloring, as well as the Trend Catcher Indicator Overlay to help us trade these market conditions specifically.
Paired with the Contrarian based candle coloring, these signals can be helpful to a trader looking to find confluent reversals. You can also see the Trend Catcher indicator overlay gives a hybrid approach to analyzing the underlying trend within this price action.
Some traders naturally are Contrarian in nature, so this signal mode may be of primary interest to them, however, most of the use cases will come from the standard Confirmation sigals paired with other overlays or regular technical analysis.
🔶 SIGNALS WITH AI CLASSIFICATION
Our toolkit is able to classify generated signals using a simple machine learning algorithm into four levels. These levels indicate if a signal will most likely indicate a trend continuation (level 3/4) or a reversal/retracement (1/2).
Users are able to filter out certain signals depending on their classification, only keeping signals of interest and potential filtering out false signals.
🔶 FILTERS
In the next image below we can see after resetting the Signals & Overlays™ indicator to it's defaults, we have simply enabled the "Smart Trail Filter" from within the Presets / Filters section at the top of the settings.
By doing this, we can filter out signals that are not aligned with the Smart Trail indicator overlay, which gives direct confluence in every signal that generates on the chart.
Applying filters to signals do not necessarily make them instantly "better" than using the indicator without them. Between every technical indicator, there are trade-offs. So while we can now use Confirmation signals & retests of the Smart Trail as great optimal entry points, at times the indicator may miss signals or retests of the Smart Trail.
The same is seen below with another one of the Filters within Signals & Overlays™; Trend Strength Filter.
We can see the indicator is using the Trend Strength metric to only generate Confirmation Signals that align with a trending market which can clean up a lot of noise during retracements as well as ranging markets.
However, the trade-off present now with this filter enabled is that at times the indicator will miss trends, in which we'd still need to be aware of the price action, candle coloring, or other forms of analysis to give us indications the market may start a new trend opposed to just relying on signals directly.
🔶 CONCLUSION
We believe that success lies in the association of the user with the indicator, opposed to many traders who have the perspective that the indicator itself can make them become profitable. The reality is much more complicated than that.
The aim is to provide an indicator comprehensive, customizable, and intuitive enough that any trader can be led to understand this truth and develop an actionable perspective of technical indicators as support tools for decision making.
You can see the Author's instructions below to get instant access to this indicator & our LuxAlgo Premium indicator suite.
🔶 RISK DISCLAIMER
Trading is risky & most day traders lose money. All content, tools, scripts, articles, & education provided by LuxAlgo are purely for informational & educational purposes only. Past performance does not guarantee future results.

Price alertThis indicator is an indicator for setting alerts.
Set alerts after adding them to the chart.
By setting an alert, you can notify the closing price to your smartphone or smartwatch.

DH: (Strategy) Super SmartSuper Trend: Backtest VersionSUPER SMART SUPERTREND (Strategy Version w/ Backtesting)
Across all time frames and assets I've tested, this indicator gives me better results... Better entries, better exits and well defined trends. In comparison with a STANDARD Supertrend, it is not radically different, but when it does differ "Super Smart SuperTrend" is almost always better.
This is the STRATEGY version of "Super Smart SuperTrend" ready for your backtesting. There is also a STUDY version with ALERTS which might be better for live trading if you want Alerts.
STUDY VERSION WITH ALERTS IS HERE
##################################
##################################
ABOUT THIS INDICATOR
As the name suggests, 'Supertrend' is a trend-following indicator that is notably popular here on Tradingview and elsewhere. It does a remarkably great job of recognizing a trend (in progress) and it will signal you to initiate a position when the trend is clear. Perhaps the greater value of Supertrend is that it helps keep you in your position until that trend is over.
WHAT'S THE BEST ATR PERIOD AND MULTIPLIER?
There are two important data points we must enter for Supertrend to work, namely the 'period (ATR number of candles or days)' and the 'multiplier (value by which ATR is multiplied)' BTW, in case you don't know, ATR signals the degree of price volatility. A common default setting is 10 for the ATR period and 3 for the multiplier.
SORRY, BUT THE MOVIE STARTED HALF HOUR AGO...
Unfortunately Supertrend has a couple of big weaknesses. Generally, it fails in a sideways-moving market and when it does detect a trend, the signal to get in (or out) comes rather late. It's like someone telling you about a great movie they're watching, but by the time you start watching, one-third of the movie is over... bummer, right?
HOW TO IMPROVE SUPERTREND
One solution is to combine Supertrend with other indicators such as MACD, Parabolic SAR, RSI, etc. And another solution is to experiment (backtest) with the Period and Multiplier settings for the asset and timeframe you are considering for trade.
For the STANDARD SETTINGS in this "Super Smart SuperTrend" indicator, I have set 9 for the ATR and 2.2 for the multiplier as default after backtesting on Bitcoin and other crypto (mostly in the 15 minute to 6 HOUR timeframe). Of course you can change this easily to any ATR period and Multiplier you like.
BUT... WHY NOT GET SMART?
I started thinking, it might be best if we let the market determine candle-by-candle what the settings should be. If everyone says that Supertrend works best in conjunction with other indicators, why not do our "conjuncting" programmatically (ie: automatically) sorta like artificial intelligence!
HOW IT WORKS
So here's what I did. Using data from other indicators I came up with a SMART SUPERTREND that auto-adjusts as the market changes. It still has settings so you can fine tune it for specific assets and timeframes, but once the settings are entered, it auto-adjusts as the market and prices evolve.
With "Super Smart SuperTrend" there is no ATR period setting (that is determined programmatically) and now there are TWO multipliers you can experiment with... (a lower one set at 1.7 default and a higher one at 2.5). These multiplier settings create a multiplier range that can be used programmatically to adjust the multiplier as the market and prices evolve.
THE RESULTS
Across all time frames and assets I've tested, I generally get better results. Better entries, better exits and well defined trends. In comparison with a STANDARD Supertrend, it is not radically different, but when it does differ "Super Smart SuperTrend: is almost always better. All this is substantiated by backtesting of course.
SAMPLE BACKTEST RESULTS (BTC/USD)
*Using Indicator Defaults*
TIMEFRAME STANDARD RESULTS SUPER SMART RESULTS
% Profitable | Profit Factor % Profitable | Profit Factor
DAY 58.33% 9.38 75.00% 10.77
4 HOUR 78.43% 18.22 80.95% 21.78
1 HOUR 74.11% 8.98 70.13% 9.34
15 MIN 58.10% 6.10 71.43% 9.48
Keep in mind that "Profit Factor" is key. It basically tells you what you'd make for every ONE DOLLAR invested by consistently trading with the backtested parameters.
SUPER SMART SUPERTREND FEATURES
• There is a STUDY VERSION w/Alerts
• There is a STRATEGY VERSION for Backtesting
• Standard 'Current Time Frame' SuperTrend Line
• Standard 'Higher Time Frame' SuperTrend Line
• Auto-Adjusting Dynamic Optimized SuperTrend Line
> Most Signals Are Same or Better than Standard
> Refine Results w/Sensitivity Inputs (2 Multipliers)
> Impressive Comparison Backtests
• Both Standard and Smart Signals and Alerts
• Toggle Any Line/Signal (On/Off)
• Toggle Backtest
> Standard vs. "Smart Auto-Adjust"
> Backtest Higher Timeframe Only
WHAT MORE COULD YOU ASK FOR?
So glad you asked. Actually, there is more... Super Smart SuperTrend is incorporated into my premier indicator set called: STONEHENGE PLUS: SUPERTREND TRADING TOOLKIT.
By combining Super Smart SuperTrend with dozens of other indicators plus the predictive "Stones" of Stonehenge, you'll be in Trader's Heaven.
That's it. Get "SMART" Today!
STONEHENGE PLUS:
The Complete SuperTrend Trading Toolkit
#################################
#################################
SUPER SMART SUPERTREND ALSO WORKS WITH:
STONEHENGE BASIC: Double Stone Version (Study w/Alerts):
PLEASE HIT THE LIKE BUTTON (and follow me... lots of great stuff in the works!)
As always, I appreciate your support. Please share with others.
ENJOY!
Dan Hollings
Master Crypto Grid Trader
Stonehenge Master Mason
Host of the "High Leverage Lounge"
Please Explore My Other Indicators, Scripts, Grids and Educational Ideas.
@DanHollings on Tradingview.
Additional Links Below...

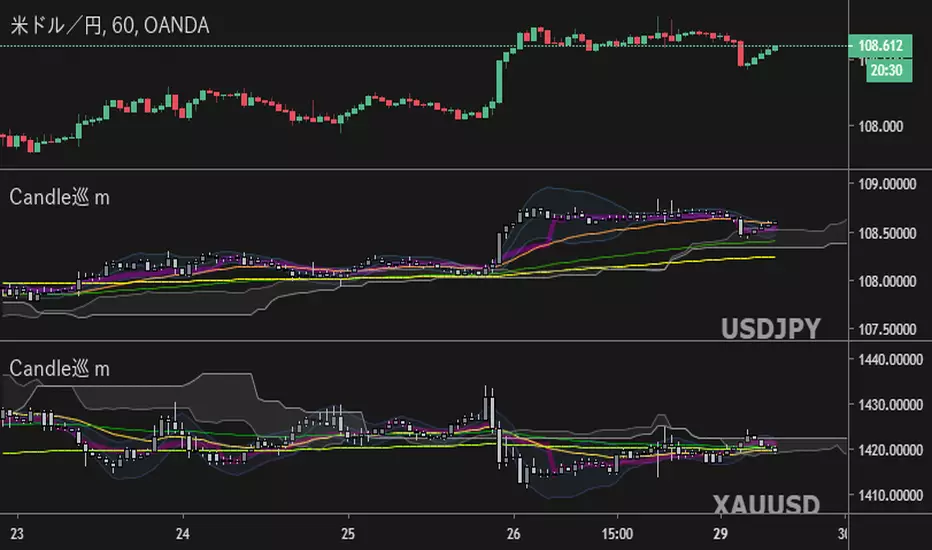
Candles [Meguru] MobileMulti-currency Indication For mobile "Candles[Meguru]Mobile"
The display of exchanges and major currencies has been made selective. (I thought about the use with a smartphone etc. and made it possible to omit the trouble of character input. It is also possible to enter manually.)
モバイル向け多通貨表示インジ『Candles[Meguru]Mobile』
取引所やメジャーな通貨の表示を選択式にしました。(移動時・スマホなどでの利用を考え、文字入力の手間を省略できるよう作成しました。手入力での設定も利用できます。)
反転チャート・時足の固定も可能です。
複数表示することで、多通貨を同時に表示・監視することもできます。
詳細、購入などはこちらにて
note.mu
XT AI Trading System for XBTUSD (BitMEX)- Features:
+ XT-AI-TRADE System with special built-in XT-AI Trend line, trend cloud indicator for XBTUSD (BitMEX) with the best performance.
+ Full backtesting from April 2018 with results as below:
Time frame / Net profit / Percent profitable / Profit factor
H1: 450% / 80% / 74.187
H2: 445% / 100% / Max
H3: 778% / 80% / 17.264
H4: 624% / 85.71% / 119.905
D1: 169% / 100% / Max
+ Separately optimized AI trading algorithm for different time frames: H1/H2/H3/H4/D1 (including Margin and Exchange Trading).
+ Trustworthy backtesting accuracy result with 100% non-repainting, no difference between backtesting and live trading.
+ Real-time push notification system: Email / Telegram... to your PC and Smartphone => Enjoy trading life.
+ 24/7 business operation.
*** Sign up for a trial here : goo.gl

Explosive Signals Version 2.0 Power - Features:
+ Optimized trading methods for multiple time frames 5M 15M 1H 4H (including Margin and Exchange Trading).
+ EST_V2 can be used to track all financial markets (Crypto, Stock, Forex, ...)
+ EST_V2 can be used to track all altcoins trading pairs
+ The tool is based on the average formula, combined with trend-changing signal processing algorithms with calibrated parameters of the experienced team.
+ Real-time push alert system + Email + Popup on your desktop, laptop, tablet and smartphone => have time to enjoy trading live.
+ Our system runs 24/7.

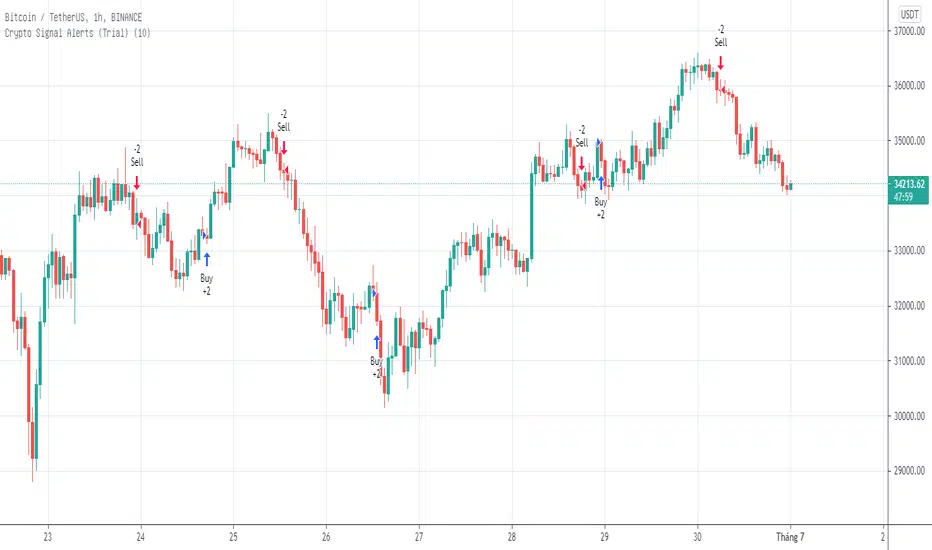
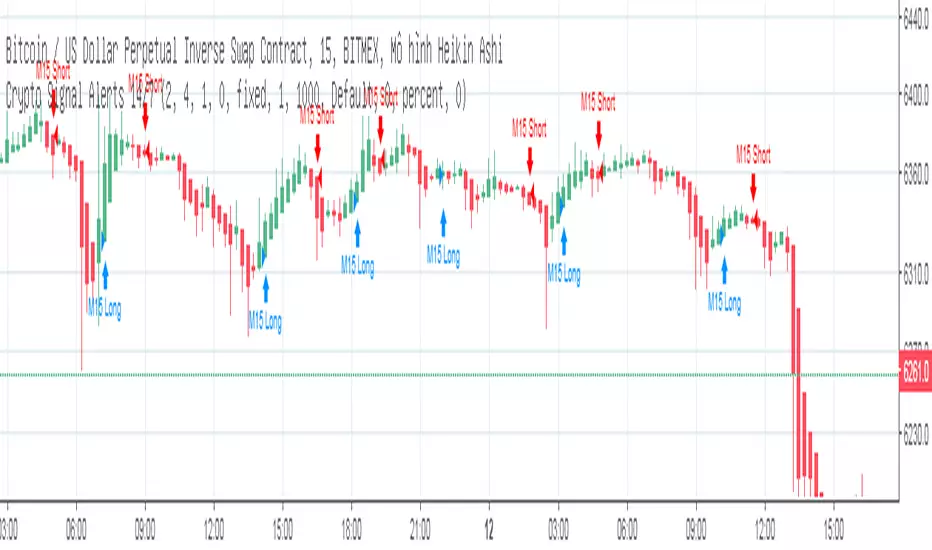
Crypto Signal Alerts ( Trial )- Features:
+ Optimized trading methods for multiple time frames 5M 15M 1H 4H (including Margin and Exchange Trading).
+ Build the rule of Stoploss / Takeprofit according to the risk management method according to the trader's strategy.
+ Real-time push alert system + Email + Popup on your desktop, laptop, tablet and smartphone => have time to enjoy trading live.
+ Our system runs 24/7.
*** Sign up for a 3-day trial here : goo.gl
Crypto Signal Warnings ( Margin/Exchange )Crypto Signal Alert is an intuitive and easy-to-use graphing buying tool that helps traders save time and maximize profits ^$$$^
- Features:
+ Optimized trading methods for multiple time frames 5M 15M 1H 4H (including Margin and Exchange Trading).
+ Build the rule of Stoploss / Takeprofit according to the risk management method according to the trader's strategy.
+ Real-time push alert system + Email + Popup on your desktop, laptop, tablet and smartphone => have time to enjoy trading live.
+ Our system runs 24/7.
*** Sign up for a 3-day trial here : goo.gl

Crypto Signal Alerts ( Margin/Exchange )Crypto Signal Alert is an intuitive and easy-to-use graphing buying tool that helps traders save time and maximize profits ^$$$^
- Features:
+ Optimized trading methods for multiple time frames 5M 15M 1H 4H (including Margin and Exchange Trading).
+ Build the rule of Stoploss / Takeprofit according to the risk management method according to the trader's strategy.
+ Real-time push alert system + Email + Popup on your desktop, laptop, tablet and smartphone => have time to enjoy trading live.
+ Our system runs 24/7.
*** Sign up for a 3-day trial here : goo.gl
Lot Size Panel Lite Multi (@JP7FX)Lot Size Panel Lite Multi is a fast, no-nonsense risk and position sizing tool built for active traders who need answers immediately.
This indicator removes all chart clutter and focuses on one thing only. Correct lot size based on your stop loss and risk.
It is designed for scalpers, day traders, and funded account traders who do not want complex menus or slow workflows.
What it does
Calculates precise lot size from stop loss and risk
Supports percentage risk or fixed cash risk
Works across Forex, Gold, Crypto, Index/CFD, and Stocks
Displays results in a clean on-chart panel
Supports multiple accounts at once
Key features
Risk first layout. Stop loss and risk inputs are at the top
Multi account support with A1 enabled by default
Per account currency handling with automatic FX conversion
Manual FX fallback option when TradingView rates are unavailable
Customisable panel colours and layout
Movable panel with multiple screen positions
How to use
Select your Asset Type
Enter your Stop Loss in pips
Choose Risk mode
Percent uses account balance
Cash risks a fixed amount
Set your account balance and currency
Read the calculated lot size instantly
Index and CFD users
For Index and Stock instruments, set the “value per pip per 1 lot” to match your broker.
Example:
If 1 lot equals $10 per point, enter 10
Who this is for
Traders who execute fast and want zero friction
Prop firm traders managing multiple accounts
Traders who want correct risk every trade without thinking
This is the Lite version of the JP7FX lot sizing tools.
It strips everything back to speed, clarity, and accuracy.
Trade smart.
JP7FX

GHOST SNIPERGHOST SNIPER™ – BB Reversal Engine + Smart Entry / Exit Structure Core
MNQ / MES / Stocks / ETFs / Crypto / FX
BB Reversals · Breakouts · PD Structure · Liquidity Sweeps · Displacement · Smart Targets · Quick SL & TP Logic
________________________________________
Summary
Ghost Sniper™ is a high-precision reversal and breakout engine designed for intraday scalping on MNQ/MES, while remaining highly effective across equities, ETFs, crypto, and FX.
It blends a custom Bollinger Reversal Framework (BB Bottom / BB Top Sniper) with an internal ICT-style structure core to filter noise and isolate only high-quality turning points.
The system reads stretch and failure conditions, detects band breakouts, and identifies Bollinger Band failures to anticipate sharp reversals. It includes a Quick TP (QTP) and Quick SL (SL-Q) module for micro-scalps, along with full ICT-style structural targets (TP1, TP2, TP3) for extended runs.
All TP levels and SL placement are derived from smart structural logic, designed to reduce premature stop-outs and improve fill reliability during volatility.
Real-time intrabar logic ensures entries trigger the moment structure confirms — no repainting.
________________________________________
BUY / SELL Signal Activation & Checklist HUD
Ghost Sniper™ uses a rule-based BUY / SELL triggering system driven by real-time structural confirmation — not delayed indicators or hindsight logic.
Entries only activate when a multi-condition internal checklist aligns, combining:
• Bollinger stretch, failure, or breakout behavior
• Liquidity sweep or rejection context
• Micro structure confirmation (BOS / displacement)
• Premium / Discount positioning
• Momentum and reversal candle confirmation
A built-in Checklist Activation HUD visually displays when conditions are forming, aligning, or fully confirmed, allowing traders to see why a signal is valid — not just that it fired.
BUY / SELL signals trigger only when checklist confirmation is reached, filtering low-probability setups and maintaining clean, high-quality entries.
All logic operates intrabar and in real time, with no repainting.
________________________________________
Market Structure & Context Awareness
Ghost Sniper™ incorporates a streamlined ICT-inspired framework, including:
• Liquidity sweep awareness (stop-runs and grabs)
• Micro BOS confirmation
• Premium / Discount context
• Impulse and displacement reads
• Reversal candle assist
• Optional PD / HTF alignment gates
To support institutional-grade context without visual clutter, Ghost Sniper™ also includes a comprehensive set of fully optional, user-selectable tools, allowing traders to tailor the chart to their workflow:
• VWAP
• Up to 5 configurable moving averages
• Bollinger Bands
• Automatic liquidity sweep level detection
• Opening Range Breakout (ORB)
• Midnight Open
• 9:30 AM New York Open
• Previous Day High / Low (PDH / PDL)
• Previous Week High / Low (PWH / PWL)
• Current Week High / Low (CWH / CWL)
• Monthly High / Low
• Previous Month High / Low (PMH / PML)
• Global session tracking, including:
o Asia Session
o London Session
o New York Session
All levels and context tools are individually selectable, designed to provide structure and bias awareness while keeping charts clean and focused.
________________________________________
Execution & Risk Logic
Ghost Sniper™ automatically prints clean, minimal BUY / SELL signals, intelligent stop placement, and progressive target logic:
QTP → TP1 → TP2 → TP3
A built-in Break-Even engine, structural invalidation logic, and one-trade-at-a-time control help maintain disciplined execution and consistent risk management.
Designed for traders who want a fast, decisive, and high-probability entry engine without visual noise or unnecessary complexity.
________________________________________
Disclaimer
This tool is for educational and research purposes only and is not financial advice.
Always test thoroughly in replay or paper trading before using in live markets.

The Physics Engine [@Ash_TheTrader]🏛️ Welcome to the Physics of Finance
By @Ash_TheTrader
Traditional technical analysis often relies on "lagging" indicators. Tools like the RSI or moving averages tell you where price has been. While useful, they are like driving a car looking only in the rearview mirror.
The Kinematic Impulse Engine (KIE) is different. It is designed to be a leading indicator of momentum shifts.
It doesn't just look at price; it treats price action like a physical object moving through space to measure its Velocity (Speed), Acceleration (G-Force), and Mass (Volume). By understanding the physics behind a move, we can determine if a trend is a powerful impulse or an exhausted drift waiting to reverse.
⚛️ The Core Concept: Trading with G-Force
If you step on the gas pedal in a car, you feel pushed back into your seat. That is acceleration (positive G-Force). When you slam on the brakes, you are thrown forward. That is deceleration (negative G-Force).
The market works the same way.
Standard momentum indicators only measure speed. The KIE measures how fast that speed is changing.
The Problem with Standard Indicators: Price can be moving higher (high speed), but the rate at which it is moving higher is slowing down (deceleration). A standard indicator will still look bullish right up until the reversal happens.
The KIE Solution: The KIE detects that deceleration instantly, warning you that the "G-Force" pushing the price up has vanished, often before the price peaks.
🎨 Visual Decoder: Reading the Heatmap
We have eliminated the need to stare at complex oscillator lines below your chart. The KIE paints the candles directly based on their "Kinetic Energy."
1. Neon Cyan : The Impulse (High G-Force) 🚀
Physics State: High Velocity + Positive Acceleration.
Meaning: The market has "pedal to the metal." Buyers are aggressive, and the move is speeding up. This is where you want to be in a trade.
Signal: Look for the small triangles (🚀) marking the start of these impulse moves out of the noise.
2. Deep Purple : Exhaustion (Braking) 🛑
Physics State: High Velocity + Negative Acceleration (Deceleration).
Meaning: The car is still moving forward fast, but the driver has taken their foot off the gas or hit the brakes.
Signal: This is a massive warning sign. If you are long and candles turn purple, the trend is running on fumes. Expect consolidation or a reversal soon.
3. Dark Gray : Equilibrium (Chop) 💤
Physics State: Low Velocity.
Meaning: No significant energy present. The market is chopping sideways.
Signal: Stay out of the market or use range-bound strategies.
⚠️ Unique Feature: Gravity Divergence Detection
This is the most powerful feature of the Kinematic Impulse Engine. It detects when price action is defying the laws of physics.
Imagine throwing a ball into the air. As it reaches the very peak of its arc, it is still moving upward, but gravity is decelerating it rapidly just before it falls back down.
The KIE detects this exact moment in the market:
Gravity Sell Signal: Price makes a new high, but Acceleration (G-Force) crashes rapidly. The market is fighting gravity and will likely snap back.
If you see a "GRAVITY" label pop up on a Deep Purple candle at a high, take notice.
🧠 The Engine Room (Under the Hood)
For the technical traders, here is how @Ash_TheTrader designed the engine:
Relative Velocity: Price changes are normalized against Average True Range (ATR) volatility. A $10 move in Bitcoin is not the same as a $10 move in a penny stock; the KIE adjusts for this automatically.
Mass Integration (Volume Weighting): In physics, Force = Mass x Acceleration. The KIE optionally uses relative Volume as "Mass." A move backed by high volume has more "weight" and is harder to stop than a low-volume move.
The HUD: The on-screen dashboard gives you real-time readings of the current Velocity and raw G-Force metrics, along with an instant trend status summary.
🛡️ How to Use This in Your Trading
The Breakout Trader: Wait for gray candles (chop). Enter when the first Neon Cyan candle appears, ideally accompanied by an Impulse Triangle (🚀). Ride the cyan until it turns purple.
The Reversal Trader: Wait for an extended run of cyan candles. When the candles turn Deep Purple and you see a "GRAVITY" warning label, look for shorting opportunities as the momentum is exhausted.
Trade smart. Trade with physics.
Developed by @Ash_TheTrader
