Smart Money Support/Resistance - LiteSmart Money Support/Resistance — Lite
Overview & Methodology
This indicator identifies support and resistance as zones derived from concentrated buying and selling pressure, rather than relying solely on traditional swing highs/lows. Its design focuses on transparency: how data is sourced, how zones are computed, and how the on‑chart display should be interpreted.
Lower‑Timeframe (LTF) Data
The script requests Up Volume, Down Volume, and Volume Delta from a lower timeframe to expose intrabar order‑flow structure that the chart’s native timeframe cannot show. In practical terms, this lets you see where buyers or sellers briefly dominated inside the body of a higher‑timeframe bar.
bool use_custom_tf_input = input.bool(true, title="Use custom lower timeframe", tooltip="Override the automatically chosen lower timeframe for volume calculations.", group=grpVolume)
string custom_tf_input = input. Timeframe("1", title="Lower timeframe", tooltip="Lower timeframe used for up/down volume calculations (default 5 seconds).", group=grpVolume)
import TradingView/ta/10 as tvta
resolve_lower_tf(useCustom, customTF) =>
useCustom ? customTF :
timeframe.isseconds ? "1S" :
timeframe.isintraday ? "1" :
timeframe.isdaily ? "5" : "60"
get_up_down_volume(lowerTf) =>
= tvta.requestUpAndDownVolume(lowerTf)
var float upVolume = na
var float downVolume = na
var float deltaVolume = na
string lower_tf = resolve_lower_tf(use_custom_tf_input, custom_tf_input)
= get_up_down_volume(lower_tf)
upVolume := u_tmp
downVolume := d_tmp
deltaVolume := dl_tmp
• Data source: TradingView’s ta.requestUpAndDownVolume(lowerTf) via the official TA library.
• Plan capabilities: higher‑tier subscriptions unlock seconds‑based charts and allow more historical bars per chart. This expands both the temporal depth of LTF data and the precision of short‑horizon analysis, while base tiers provide minute‑level data suitable for day/short‑swing studies.
• Coverage clarity: a small on‑chart Coverage Panel reports the active lower timeframe, the number of bars covered, and the latest computed support/resistance ranges so you always know the bounds of valid LTF input.
Core Method
1) Data acquisition (LTF)
The script retrieves three series from the chosen lower timeframe:
– Up Volume (buyers)
– Down Volume (sellers)
– Delta (Up – Down)
2) Rolling window & extrema
Over a user‑defined lookback (Global Volume Period), the algorithm builds rolling arrays of completed bars and scans for extrema:
– Buyers_max / Buyers_min from Up Volume
– Sellers_max / Sellers_min from Down Volume
Only completed bars are considered; the current bar is excluded for stability.
3) Price mapping
The extrema are mapped back to their source candles to obtain price bounds:
– For “maximum” roles the algorithm uses the relevant candle highs.
– For “minimum” roles it uses the relevant candle lows.
These pairs define candidate resistance (max‑based) and support (min‑based) zones or vice versa.
4) Zone construction & minimum width
To ensure practicality on all symbols, zones enforce a minimum vertical thickness of two ticks. This prevents visually invisible or overly thin ranges on instruments with tight ticks.
5) Vertical role resolution
When both max‑ and min‑based zones exist, the script compares their midpoints. If, due to local price structure, the min‑based zone sits above the max‑based zone, display roles are swapped so the higher zone is labeled Resistance and the lower zone Support. Colors/widths are updated accordingly to keep the visual legend consistent.
6) Rendering & panel
Two horizontal lines and a filled box represent each active zone. The Coverage Panel (bottom‑right by default) prints:
– Lower‑timeframe in use
– Number of bars covered by LTF data
– Current Support and Resistance ranges
If the two zones overlap, an additional “Range Market” note is shown.
Key Inputs
• Global Volume Period: shared lookback window for the extrema search.
• Lower timeframe: user‑selectable override of the automatically resolved lower timeframe.
• Visualization toggles: independent show/hide controls and colors for maximum (resistance) and minimum (support) zones.
• Coverage Panel: enable/disable the single‑cell table and its readout.
Operational Notes
• The algorithm aligns all lookups to completed bars (no peeking). Price references are shifted appropriately to avoid using the still‑forming bar in calculations.
• Second‑based lower timeframes improve granularity for scalping and very short‑term entries. Minute‑based lower timeframes provide broader coverage for intraday and short‑swing contexts.
• Use the Coverage Panel to confirm the true extent of available LTF history on your symbol/plan before drawing conclusions from very deep lookbacks.
Visual Walkthrough
A step‑by‑step image sequence accompanies this description. Each figure demonstrates how the indicator reads LTF volume, locates extrema, builds price‑mapped zones, and updates labels/colors when vertical order requires it.
Chart Interpretation
This chart illustrates two distinct perspectives of the Smart Money Support/Resistance — Lite indicator, each derived from different lookback horizons and lower-timeframe (LTF) resolutions.
1- Short-term view (43 bars, 10-second LTF)
Using the most recent 43 completed bars with 10-second intrabar data, the algorithm detects that both maximum and minimum volume extrema fall within a narrow range. The result is a clearly identified range market: resistance between 178.15–184.55 and support between 175.02–179.38.
The Coverage Panel (bottom-right) confirms the scope of valid input: the lower timeframe used, number of bars covered, and the resulting zones. This short-term scan highlights how the indicator adapts to limited data depth, flagging sideways structure where neither side dominates.
2 - Long-term view (120 bars, 30-second LTF)
Over a wider 120-bar lookback with higher-granularity 30-second data, broader supply and demand zones emerge.
– The long-term resistance zone captures the concentration of buyers and sellers at the upper boundary of recent price history.
– The long-term support zone anchors to the opposite side of the distribution, derived from maxima and minima of both buying and selling pressure.
These zones reflect deeper structural levels where market participants previously committed significant volume.
Combined Perspective
By aligning the short-term and long-term outputs, the chart shows how the indicator distinguishes immediate consolidation (range market) from more durable support and resistance levels derived from extended history. This dual resolution approach makes clear that support and resistance are not static lines but dynamic zones, dependent on both timeframe depth and the resolution of intrabar volume data.
Search in scripts for "smart"

Smart Money LITE — Daily Sweep → HQ Signals (VWAP • FVG • CHoCH) 🔗 PRO VERSION (VWAP + FVG + CHoCH — full confirmations, all timeframes):
chartedgepro.gumroad.com/l/rmnbhw
Daily liquidity sweep → confluence signals with VWAP, FVG & CHoCH. Works on all timeframes & markets (Indices, Forex, Crypto).
WHAT IT DOES
Smart Money LITE+ highlights high-quality LONG/SHORT signals only after daily liquidity is swept (previous day high/low) with confluence from VWAP, FVG and structure (BOS/CHoCH).
Works on all timeframes and across markets: indices, forex, crypto.
KEY FEATURES (Lite)
• Daily sweep logic (PDH/PDL) + previous day zones
• VWAP + deviation bands (optional) and proximity filter
• 3-bar FVG boxes (visual) with adjustable extension
• ATR/volatility filter, optional HTF trend filter
• Anti-spam cooldown, clean LONG/SHORT labels
• Alerts: HQ LONG / HQ SHORT
HOW TO USE
1. Wait for price to sweep PDH/PDL → indicator opens “signal window”.
2. Look for confluence: VWAP touch/proximity + CHoCH or BOS in direction.
3. Enter with proper risk management (stop beyond swing/zone, partials).
SETTINGS TIPS
• Enable “Require VWAP Confluence?” for strictest setups.
• Use “HTF Trend Filter?” to align with higher-timeframe EMA trend.
• Adjust “After sweep (bars)” to define signal validity window.
• FVGs are visual in Lite — advanced filtering and confirmation are in Pro.
WHO IT'S FOR
Scalpers, intraday, and swing traders looking for objective, visual signals based on liquidity sweeps and VWAP/FVG confluence.
PRO VERSION (full confirmations)
Adds advanced FVG/iFVG logic, more confluence filters, dynamic risk tools and extended alert packages — optimized for all timeframes.
👉 chartedgepro.gumroad.com/l/rmnbhw
NOTES
• For educational purposes only. No financial advice.
• “Lite” is open-source; redistribution of code follows TradingView rules.

Smart Money Breakout Channels [AlgoAlpha]🟠 OVERVIEW
This script draws breakout detection zones called “Smart Money Breakout Channels” based on volatility-normalized price movement and visualizes them as dynamic boxes with volume overlays. It identifies temporary accumulation or distribution ranges using a custom normalized volatility metric and tracks when price breaks out of those zones—either upward or downward. Each channel represents a structured range where smart money may be active, helping traders anticipate key breakouts with added context from volume delta, up/down volume, and a visual gradient gauge for momentum bias.
🟠 CONCEPTS
The script calculates normalized price volatility by measuring the standard deviation of price mapped to a scale using the highest and lowest prices over a set lookback period. When normalized volatility reaches a local low and flips upward, a boxed channel is drawn between the highest and lowest prices in that zone. These boxes persist until price breaks out, either with a strong candle close (configurable) or by touching the boundary. Volume analysis enhances interpretation by rendering delta bars inside the box, showing volume distribution during the channel. Additionally, a real-time visual “gauge” shows where volume delta sits within the channel range, helping users spot pressure imbalances.
🟠 FEATURES
Automatic detection and drawing of breakout channels based on volatility-normalized price pivots.
Optional nested channels to allow multiple simultaneous zones or a clean single-zone view.
Gradient-filled volume gauge with dynamic pointer to show current delta pressure within the box.
Three volume visualization modes: raw volume, comparative up/down volume, and delta.
Alerts for new channel creation and confirmed bullish or bearish breakouts.
🟠 USAGE
Apply the indicator to any chart. Wait for a new breakout box to form—this occurs when volatility behavior shifts and a stable range emerges. Once a box appears, monitor price relative to its boundaries. A breakout above suggests bullish continuation, below suggests bearish continuation; signals are stronger when “Strong Closes Only” is enabled.
Watch the internal volume candles to understand where buy/sell pressure is concentrated during the box. Use the gauge on the right to interpret whether net pressure is building upward or downward before breakout to anticipate the direction.
Use alerts to catch breakout events without needing to monitor the chart constantly 🚨.

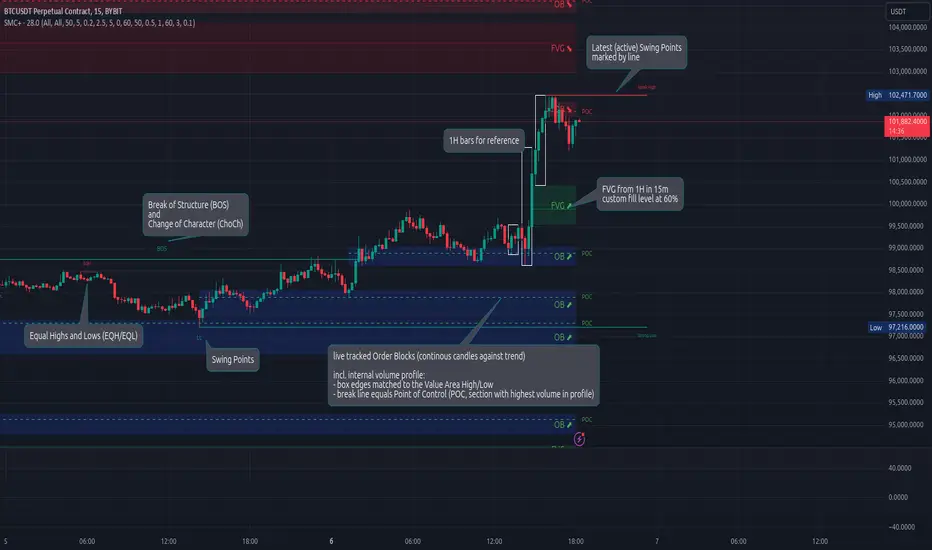
Smart Money Concepts (Advanced)Inspired and initially based on LuxAlgo's Smart Money Concepts Indicator I created a library lib_smc that started to convert every function and return objects. This allowed certain customizations like tracking the current fill level of FVGs or tracking the creation of Order Blocks, by monitoring consecutive bars against the current trend.
This indicator is provided as is, based on, but probably not always be up to date with my lib_smc that I am using for my projects.
WARNING: This indicator shows EXPERIMENTAL Order Blocks that are tracked LIVE. Unlike usual Order Blocks these are not just based on the last confirmed Swing Point (formed 50 bars before) but on consecutive candles opposing an unconfirmed trend. Blocks are confirmed by price movements relative to the unconfirmed block and unconfirmed swing points. This means that some Order Blocks will appear on pullbacks, as well as reversals.
Features
Swing Points (HH / LH / HL / LL), indicating support / resistance zones price might reject off of or want to push through
Market Structure (BOS / ChoCh), indicates confirmation for a continued / changing trend
live Order Blocks (OB), see warning above.
Fair Value Gaps (FVG), optional from higher timeframes
Equal Highs / Lows (EQH/EQL), indicates strong support / resistance zones, especially when the bars forming it have long wicks toward that zone
using my lib_no_delay all moving averages are working from bar 0, so it can be used on charts with limited bars
Smart Money Breakouts [iskess 01-02 11:05]This is an big update to the excellent Smart Money Breakout Script published in Oct 2023 by ChartPrime who, to my knowledge, was the original author.
FULL CREDIT GOES TO CHARTPRIME FOR THIS ORIGINAL WORK.
Per the moderator's rules, you will find below a meaningful, detailed self-contained description that does not rely on delegation to the open source code or links to other content. You will find in the description details on what the script does, how it does that, how to use it, and how it is original.
The "Smart Money Breakouts" indicator is designed to identify breakouts based on changes in character (CHOCH) or breaks of structure (BOS) patterns, facilitating automated trading with user-defined Take Profit (TP) level.
The indicator incorporates essential elements such as volume analysis and a data table to assist traders in optimizing their strategies.
🔸Breakout Detection:
The indicator scans price movements for "Change in Character" (CHOCH) and "Break of Structure" (BOS) patterns, signaling potential breakout opportunities in the market.
🔸User-Defined TP/SL :
Traders can customize the Take Profit (TP) and Stop Loss (SL) through the indicator settings, with these levels dynamically calculated based on the Average True Range (ATR). This allows for precise risk management and profit targets that adapt to market volatility. Traders can also select the lookback period for the TP/SL calculations.
🔸Volume Analysis and Trade Direction Specific Analysis:
The indicator includes a volume checker that provides valuable insights into the strength of the breakout, taking into account trade direction.
🔸If the volume label is red and the trade is long, it suggests a higher likelihood of hitting the Stop Loss (SL).
🔸If the volume label is green and the trade is long, it indicates a higher probability of hitting the Take Profit (TP).
🔸For short trades, a red volume label suggests a higher likelihood of hitting TP, while a green label suggests a higher likelihood of hitting SL.
🔸A yellow volume label suggests that the volume is inconclusive, neither favoring bullish nor bearish movements.
🔸Data Table:
The indicator features a data table that keeps track of the number of winning and losing trades for specific timeframes or configurations. It also shows the percentage of profits vs losses, and the overall profit/loss for the selected lookback period.
This table serves as a valuable tool for traders to analyze performance and discover optimal settings and timeframes.
The "Smart Money Breakouts" indicator provides traders with a comprehensive solution for breakout trading, combining technical analysis of changes in character and breaks of structure, volume insights, and performance tracking while dynamically adjusting TP and SL levels based on market volatility through the ATR.
This version of the script is a "significant improvement" from Chart Prime's original work in the following ways:
- A selectable range of candles for the profit/loss calculations to look back on.
- An updated table that includes the percentage of wins/losses, and and overall P&L during the selected lookback range.
- The user can now select only Long trades, Short trades, or both.
- The percentage gain/loss is now indicated for every trade on the chart.
- The user can now select a different multiplier for Stop Loss or Take Profit thresholds.

Smart Money Setup 03 [TradingFinder] Minor OB & Trend Proof🔵 Introduction
The "Smart Money Concept" transcends mere technical trading strategies; it embodies a comprehensive philosophy elucidating market dynamics. Central to this concept is the acknowledgment that influential market participants manipulate price actions, presenting challenges for retail traders.
As a "retail trader", aligning your strategy with the behavior of "Smart Money," primarily market makers, is paramount. Understanding their trading patterns, which revolve around supply, demand, and market structure, forms the cornerstone of your approach. Consequently, decisions to enter trades should be informed by these considerations.
🟣 Important Note
In this setup, pattern formation revolves around the robustness of the "Stop Hunt" targeting retail traders.
When this stop hunt occurs, if the price tests below the minor pivot or above the minor pivot, a "Minor Order Block" is formed.
Similarly, if the price tests below the major pivot or above the major pivot, a "Major Order Block" is formed.
Since the price hasn't successfully broken the major pivots before breaking the Top or Bottom, it can be inferred that the minor pivots formed within a leg of price movement exhibit a "Range" structure.
For a deeper comprehension of this setup, refer to the accompanying visual aids below.
Bullish Setup Details :
Bearish Setup Details :
🔵 How to Use
Upon integrating the indicator into your chart, exercise patience as you await the evolution of the trading setup.
Experiment with different trading positions by adjusting both the "Time Frame" and "Pivot Period". Typically, setups materializing over longer "Time Frames" and "Pivot Periods" carry heightened validity.
Bullish Setup Details on Chart :
Bearish Setup Details on Chart :
Within the settings, you possess the flexibility to modify the "Pivot Period" input to tailor the indicator to your preferences.

Smart Money Breakouts [ChartPrime]The " Smart Money Breakouts " indicator is designed to identify breakouts based on changes in character (CHOCH) or breaks of structure (BOS) patterns, facilitating automated trading with user-defined Take Profit (TP) level.
the indicator incorporates essential elements such as volume analysis and a data table to assist traders in optimizing their strategies.
🔸 Breakout Detection:
The indicator scans price movements for "Change in Character" (CHOCH) and "Break of Structure" (BOS) patterns, signaling potential breakout opportunities in the market.
🔸User-Defined TP :
Traders can customize the Take Profit (TP) through the indicator settings, with these levels dynamically calculated based on the Average True Range (ATR). This allows for precise risk management and profit targets that adapt to market volatility.
🔸 Volume Analysis and Trade Direction Specific Analysis:
The indicator includes a volume checker that provides valuable insights into the strength of the breakout, taking into account trade direction.
🔸If the volume label is red and the trade is long, it suggests a higher likelihood of hitting the Stop Loss (SL).
🔸If the volume label is green and the trade is long, it indicates a higher probability of hitting the Take Profit (TP).
🔸For short trades, a red volume label suggests a higher likelihood of hitting TP, while a green label suggests a higher likelihood of hitting SL.
🔸A yellow volume label suggests that the volume is inconclusive, neither favoring bullish nor bearish movements.
🔸Data Table:
The indicator features a data table that keeps track of the number of winning and losing trades for specific timeframes or configurations.
This table serves as a valuable tool for traders to analyze performance and discover optimal settings and timeframes.
The "Smart Money Breakouts" indicator provides traders with a comprehensive solution for breakout trading, combining technical analysis of changes in character and breaks of structure, volume insights, and performance tracking while dynamically adjusting TP and SL levels based on market volatility through the ATR.

Smart Money Range [ChartPrime]The Smart Money Range indicator is designed to provide traders with a holistic view of market structure, emphasizing potential key support and resistance levels within a predefined range. This indicator is not just a visually pleasing, but also a comprehensive guide to understanding the market’s dynamics at a given level.
Key Features:
Defined Range: The indicator demarcates a clear range, highlighting support and resistance levels within it. This aids in identifying potential areas of buying and selling pressure. These are derived from highly significant areas that have been touched many times before.
Touches Counter: Underneath the support and resistance lines, there are numerical values that show the number of times price has interacted with these levels. This can provide insights into the strength or weakness of a particular level.
Zig-Zag Projections: Within the range, there's a zig-zag pattern indicating possible future touches, helping traders anticipate future price movements.
Double-Sided Profile: To the right of the range, a dual-profile is showcased. One side of the profile displays the volume traded at specific price levels, giving insights into where significant buying or selling has occurred. On the other side, it reflects the number of touches at that given price level, reinforcing the importance of particular price points.
Customizability: Users have the option to adjust the period setting, allowing them to cater the indicator to their specific trading style and configuration. Additionally, with volume levels settings, traders can adjust the number of bins in the profile for a tailored view.

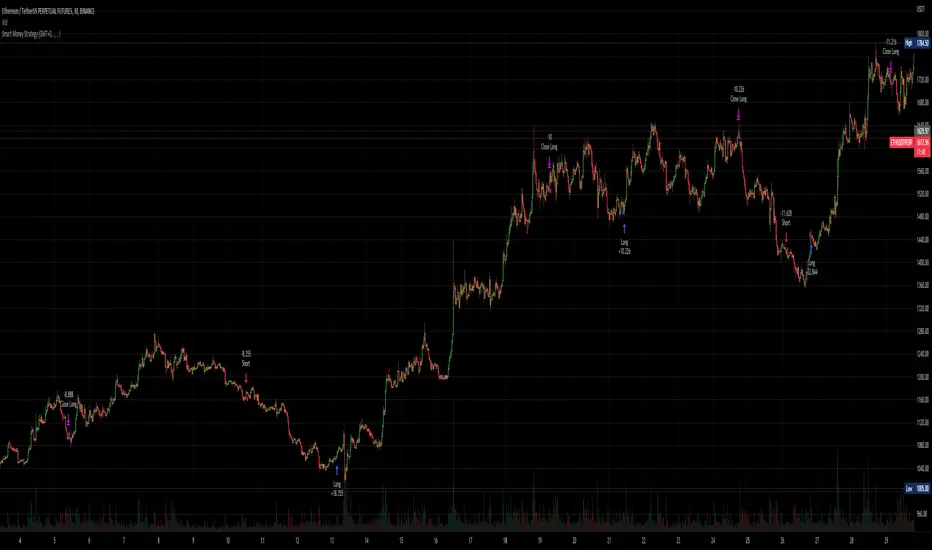
Smart Money - Oscillator and Volume StrategyOverview
This is a no-repaint strategy that is highly optimized for BINANCE:ETHUSDTPERP 30m, normal candles. It is a long/short strategy that is based on CMF, ADX/DMI, Keltner Channels, and other oscillators to identify smart money.
The overall idea of the strategy is to effectively capture the beginnings and ends of trends in price action, and go long/short accordingly. To achieve this, potential entry points are identified with various oscillators and these are then filtered using a variety of moving averages and strength/momentum indicators.
Short and sell inflections are found when ADX, DMI, and/or CMF oscillate below a specified threshold, and Keltner Channels are also used to indicate potential trades.
The indicator will continue to be updated and optimized for current and future market conditions.
If purchased, access to the indicator will be available within 24 hours.
Backtest Results
Parameters:
- 2021-01-01 to present (19 months)
- 100% equity order size
- 0.04% commission fees
- No leverage
17,089% net profit through 296 trades with 60.47% of trades being profitable.
Profit factor of 2.862, Sharpe Ratio of 1.158
Parameters:
- 2021-01-01 to present (19 months)
- $1,000 initial capital
- $1,000 order size
- 0.04% commission fees
- No leverage
584% net profit through 296 trades with 60.47% of trades being profitable.
Parameters:
- 2021-01-01 to present (19 months)
- 500% equity order size
- 0.04% commission fees
- 5x leverage
8,587,557% net profit through 299 trades with 59.87% of trades being profitable.
Smart Money OscillatorSmart Money Oscillator
Class : oscillator
Purpose : intraday
Period : 15 min – 1 hour
Idea of the Indicator
Smart Money Oscillator is the next step in evolution of oscillators. It uses regression analysis technics to calculate the theoretical price of the asset and compare it with the actual price. This price difference is used to define whether current prices are overbought or oversold.
“Smart Money Oscillator” is very volatile and provide much more signals than traditional oscillators like RSI or Stochastic. It can be used for active trading in volatile assets like Nasdaq index.
Structure of the Indicator
Indicator consists of two oscillatory lines: main (blue colored) and signal (red colored). Overbought and oversold zones are indicated with black dotted horizontal lines.
Rules of trading
Rules of trading are typical for oscillators.
• When the oscillatory line enters the overbought zone – long positions should be closed and after line reversal short position should be opened.
• When the oscillatory line enters the oversold zone – short positions should be closed and after line reversal long position should be opened.
Signal line is used to reduce the level of noise in the oscillatory line dynamics.
Access to the indicator
Please address all questions about this indicator (including access to it) in private messages.

Smarter MACD BandThe Smarter MACD displayed as a band instead of an oscillator. A classic MACD with average peak and dip lines. The lighter green and red horizontal lines are the average peak and dip of the entire span, respectively. The second, bolder of the two lines are the averages of the peaks and dips above and below the overall peak and dip averages. The filled in color is to help visualize these averages and possible trade setups.

LVN Smart Liquidity📊 LVN SMART LIQUIDITY
═════════════════════════════════════════════════════════════
─────────────────────────────────────────────────────────────
🎯 OVERVIEW
LVN Smart Liquidity is an advanced Market Profile-based indicator that automatically identifies Low Volume Nodes (LVN) across multiple timeframes. Unlike traditional volume-based indicators, this tool uses TPO (Time Price Opportunity) calculations to detect price levels where minimal trading activity occurred, revealing potential breakout zones and rapid price movement areas.
These LVN zones often behave similarly to Fair Value Gaps (FVG) in Smart Money Concepts, representing "thin air" areas where price tends to move quickly with minimal resistance. The indicator provides dynamic zone management with an immunity period system to prevent premature zone closure.
─────────────────────────────────────────────────────────────
🔬 HOW IT WORKS
MARKET PROFILE TPO METHODOLOGY:
The indicator analyzes each higher timeframe period by:
1. Dividing the price range into 20 equal levels
2. Counting how many bars touched each level (TPO count)
3. Identifying levels with TPO counts below the threshold (default 30% of maximum)
4. Creating horizontal zones that extend until price touches them
MULTI-TIMEFRAME ANALYSIS:
• Supports up to 5 independent timeframes simultaneously
• Each timeframe generates its own LVN zones with unique colors
• Auto-timeframe mode adapts to your chart period
• Zones project from historical sessions onto current price action
SMART ZONE MANAGEMENT:
• Immunity Period: New zones are protected for N bars after creation (default 20)
• This prevents zones from disappearing immediately when price is already within them
• Zones extend right until price touches them, then stop extending
• Historical zones remain visible for reference (optional)
─────────────────────────────────────────────────────────────
💡 WHY LVN ZONES MATTER
Low Volume Nodes represent price levels where:
✓ Price spent minimal time (rejection zones)
✓ Few market participants were active
✓ Inefficient price discovery occurred
✓ Similar to Fair Value Gaps in ICT/SMC methodology
TRADING APPLICATIONS:
• Breakout Acceleration: Price moves rapidly through LVN zones
• Profit Targets: Place targets beyond LVN zones where momentum slows
• Stop Loss Placement: Avoid placing stops inside LVN zones (price likely to continue)
• Confluence with FVG: LVN zones often align with Fair Value Gaps
• Retest Opportunities: When price revisits LVN, expect quick moves
─────────────────────────────────────────────────────────────
⚙️ KEY FEATURES
TIMEFRAME FLEXIBILITY:
• 5 independent timeframe slots with enable/disable toggles
• Auto-mode intelligently selects higher timeframes
• Preset options: 5m, 15m, 30m, 1H, 2H, 4H, D, W, 2W, M, 3M, 6M, 12M
VISUAL CUSTOMIZATION:
• Individual color settings for each timeframe
• Adjustable box transparency and border width
• Toggle timeframe labels and period dates on/off
• Four text size options: tiny, small, normal, large
ADVANCED CONTROLS:
• LVN Threshold: 0-50% (default 30%) - lower = fewer, stronger zones
• Immunity Period: 0-50 bars (default 20) - prevents premature closure
• Show/Hide old boxes for clean chart appearance
• Maximum 500 boxes supported per timeframe
PROFESSIONAL DISPLAY:
• Zones show timeframe label (5m, 1H, D, etc.)
• Optional period dates (dd.MM-dd.MM format)
• Boxes extend right dynamically until price touch
• Clean visual hierarchy with bordered zones
─────────────────────────────────────────────────────────────
📈 HOW TO USE
SETUP:
1. Add indicator to chart
2. Enable desired timeframes (TF1, TF2, etc.)
3. Adjust LVN threshold based on your trading style:
• 20-25% = Very selective (only thinnest zones)
• 30-35% = Balanced (recommended for most markets)
• 40-50% = More zones (higher sensitivity)
INTERPRETATION:
• RED/DARK ZONES = Low trading activity occurred here
• Price tends to move THROUGH these zones quickly
• Similar behavior to Fair Value Gaps (FVG) in Smart Money theory
• Expect acceleration when price enters LVN zones
TRADING STRATEGIES:
1. BREAKOUT TRADING:
- Wait for price to approach LVN zone
- Enter when price breaks into the zone
- Expect rapid movement through the zone
- Target next support/resistance beyond LVN
2. CONFLUENCE ANALYSIS:
- Combine with other SMC concepts (Order Blocks, FVG, Liquidity)
- LVN + FVG overlap = high-probability acceleration zone
- Use higher timeframe LVN as directional bias
3. MULTI-TIMEFRAME:
- Daily LVN = major breakout zones
- 4H LVN = intraday momentum areas
- 15m LVN = scalping opportunities
─────────────────────────────────────────────────────────────
⚠️ IMPORTANT NOTES
WHAT THIS INDICATOR IS:
✓ Market Profile TPO-based LVN detector
✓ Multi-timeframe zone identification tool
✓ Visual representation of low trading activity areas
✓ Complementary to Smart Money Concepts (SMC/ICT)
WHAT THIS INDICATOR IS NOT:
✗ Not a standalone trading system
✗ Not a guaranteed profit generator
✗ Not financial advice
✗ Requires confirmation from price action and other tools
LIMITATIONS:
• Works best on liquid markets with reliable data
• Lower timeframes may produce excessive zones
• Requires understanding of Market Profile concepts
• Performance depends on proper threshold calibration
BEST PRACTICES:
• Start with 1-2 timeframes, add more as needed
• Use higher timeframes for swing trading
• Combine with support/resistance, trendlines, order blocks
• Backtest on your specific instrument before live trading
• Adjust immunity period based on market volatility
─────────────────────────────────────────────────────────────
🔧 SETTINGS GUIDE
TIMEFRAME GROUPS (1-5):
Each group contains:
• Enable toggle - Turn timeframe on/off
• Timeframe selector - Choose period or Auto
• Box color - Zone fill color
• Border color - Zone outline color
GENERAL SETTINGS:
• LVN Threshold (%) - Percentage of max TPO to qualify as LVN
• Show Old LVN Boxes - Keep historical zones visible
• Box Border Width - Visual thickness (1-4)
• Immunity Period - Protection bars for new zones
• Show Timeframe - Display TF label in boxes
• Show Period - Display date range in boxes
• Text Size - Label size adjustment
─────────────────────────────────────────────────────────────
📊 ORIGINALITY & UNIQUENESS
This indicator is original because:
1. TPO-BASED CALCULATION: Uses Market Profile Time-Price-Opportunity methodology instead of traditional volume analysis, making it work on all markets including those without real volume data (Forex, some indices).
2. IMMUNITY SYSTEM: Unique protection mechanism prevents zones from disappearing immediately when price is already within zone boundaries at creation time.
3. TRUE MULTI-TIMEFRAME: Independent calculation for each timeframe with separate zone management, not simple higher timeframe projection.
4. SMART ZONE LIFECYCLE: Zones dynamically extend until price touch, then become static historical references.
5. FVG-LIKE BEHAVIOR: Bridges traditional Market Profile analysis with modern Smart Money Concepts by identifying zones that behave similarly to Fair Value Gaps.
Unlike existing LVN indicators that rely on volume data, this tool uses time-based analysis, making it universal across all market types and compatible with brokers that don't provide accurate volume information.
─────────────────────────────────────────────────────────────
📚 TECHNICAL BACKGROUND
MARKET PROFILE THEORY:
Developed by J. Peter Steidlmayer in the 1980s, Market Profile analyzes market behavior by examining price and time relationships. Low Volume Nodes in traditional profile represent areas where market participants showed minimal interest.
TPO (TIME PRICE OPPORTUNITY):
Instead of counting volume, TPO counts how many time periods (bars) touched each price level. This approach:
• Works on all markets regardless of volume data quality
• Reflects actual time-based market acceptance/rejection
• Reveals psychological price levels through time distribution
CONNECTION TO SMART MONEY CONCEPTS:
Fair Value Gaps (FVG) in ICT methodology represent similar inefficiencies:
• Areas where price moved too quickly
• Imbalances in buying/selling pressure
• Zones that price may revisit or accelerate through
• LVN zones often overlap with FVG locations
─────────────────────────────────────────────────────────────
🎓 RECOMMENDED RESOURCES
To maximize this indicator's effectiveness, study:
• Market Profile fundamentals (TPO, POC, Value Area)
• Smart Money Concepts (FVG, Order Blocks, Liquidity)
• Multi-timeframe analysis techniques
• Volume Profile comparison (understand the difference)
COMPANION INDICATOR:
Consider using "HVN Smart Liquidity" (opposite concept) to identify both high and low volume zones for complete Market Profile analysis.
─────────────────────────────────────────────────────────────
💬 SUPPORT & FEEDBACK
Questions or suggestions? Feel free to comment below or send a private message.
If you find this indicator useful, please boost and share with other traders!
⚠️ DISCLAIMER: This indicator is for educational purposes only. Trading involves risk. Always do your own research and use proper risk management.

HVN Smart Liquidity📊 What the Indicator Does
HVN Smart Liquidity is a professional tool for identifying institutional liquidity zones based on Market Profile analysis and High Volume Nodes (HVN). The indicator visualizes dynamic zones where the greatest trading activity is concentrated, using TPO (Time Price Opportunity) methodology to reveal levels where major market participants place their positions.
🎯 Originality and Advantages
Unlike standard volume indicators or static support/resistance levels, HVN Smart Liquidity offers a unique combination of features:
Multi-timeframe analysis: simultaneous calculation of HVN zones across 4 different timeframes with automatic adaptation to the current chart
Dynamic zone behavior: boxes automatically contract when price moves inside the zone and are deleted upon complete breakout, reflecting real institutional liquidity dynamics
Precise TPO calculation: instead of simple volume counting, uses Market Profile methodology with range division into 20 price channels
Intelligent filtering: adjustable HVN threshold (default 70% of maximum TPO) filters out insignificant zones and shows only critically important levels
⚙️ How the Indicator Works
1. Market Profile Data Collection
The indicator tracks bar formation on selected timeframes. For each completed period:
High-Low range is recorded
Number of bars on current chart timeframe is counted
Range is divided into 20 equal price channels
2. TPO (Time Price Opportunity) Calculation
For each of the 20 channels, the indicator counts how many bars touched that price range. This provides distribution of trading activity by price — the foundation of Market Profile methodology. The get_tpo() function checks the intersection of each bar's Low-High range with channel boundaries.
3. HVN Zone Identification
The algorithm identifies High Volume Nodes — areas where TPO exceeds the specified threshold (default 70% of maximum value). Adjacent channels exceeding the threshold are merged into a single liquidity zone. This creates visual boxes showing where price spent maximum time and where large positions are concentrated.
4. Dynamic Zone Management
After creation, HVN zones begin their own lifecycle:
Contraction on touch: when price enters the zone, the box contracts from the side nearest to current price, showing partial liquidity absorption
Deletion on breakout: if price breaks through upper or lower boundary, or passes through the zone in one bar, the box is completely deleted — liquidity is exhausted
Current TF projection: zones extend right (extend.right), showing level relevance
🔧 How to Use
Basic Setup:
Timeframe selection: enable desired timeframes (TF1-TF4) via checkboxes. Recommended to use 2-3 timeframes for different trading styles
Auto mode: when selecting 'Auto', the indicator automatically chooses higher timeframe depending on current chart (e.g., on M5 → selects H2, on H1 → selects D)
Color differentiation: configure different colors for each timeframe to distinguish short-term and long-term liquidity zones
Trading Strategies:
Strategy 1: HVN Bounce
Look for entry points when price approaches an HVN zone from a higher timeframe. If the zone begins to contract (price inside) but isn't broken — high probability of bounce. Use lower timeframe zones for precise entry timing.
Strategy 2: Breakout and Retest
After complete HVN zone breakout (box disappeared), wait for price to return to the level of the former zone. Boundaries of deleted zones often become strong support/resistance levels for retests.
Strategy 3: Timeframe Confluence
The strongest signals occur when HVN zones from different timeframes coincide or are close to each other. This shows consistency of institutional levels across different time scales.
Parameter Optimization:
HVN Threshold (70%): increasing to 80-90% gives fewer but more significant zones; decreasing to 50-60% shows more potential levels
Show Old Boxes: disable for clean chart (only last 50 zones shown), enable for historical analysis
Border Width: increase border width for better visibility on busy charts
💡 Smart Money Concept
The indicator is based on understanding that institutional participants (Smart Money) leave traces of their activity in volume distribution across price levels. High Volume Nodes represent zones where:
Market makers place limit orders to provide liquidity
Institutional traders accumulate or distribute large positions
Fair Value prices form after volatile movements
By tracking the dynamics of these zones, traders can "see" the intentions of major players and trade alongside institutional flow.
📈 Applicability
The indicator is universal and works on all market types:
Cryptocurrency: Bitcoin, Ethereum, altcoins
Forex: major and cross pairs
Stocks: equities, indices
Futures: commodity and financial futures
Timeframes: from M1 to Monthly. Optimal results on M5-H4 for intraday and H4-D for swing trading.
⚠️ Important Notes
The indicator requires history accumulation — give it time on first bars of new periods
On low-liquidity instruments or exotic pairs, HVN zone quality may be lower
Use the indicator in combination with other analysis methods (price action, support/resistance, trends)
Maximum box count limited to 500 — during extended operation, old zones are automatically deleted
🔬 Technical Details
Pine Script version: v5
Type: overlay indicator
Computational complexity: medium (uses loops for TPO calculations)
Repainting: minimal, only when new zones form on higher TF
📚 Recommended Reading
For deep understanding of concepts underlying the indicator:
J. Peter Steidlmayer — "Markets and Market Logic" (Market Profile fundamentals)
James Dalton — "Mind Over Markets" (TPO and Value Area)
Smart Money Concepts (SMC) and institutional trading methodologies

MA SMART Angle
### 📊 WHAT IS MA SMART ANGLE?
**MA SMART Angle** is an advanced momentum and trend detection indicator that analyzes the angles (slopes) of multiple moving averages to generate clear, non-repainting BUY and SELL signals.
**Original Concept Credit:** This indicator builds upon the "MA Angles" concept originally created by **JD** (also known as Duyck). The core angle calculation methodology and Jurik Moving Average (JMA) implementation by **Everget** are preserved from the original open-source work. The angle calculation formula was contributed by **KyJ**. This enhanced version is published with respect to the open-source nature of the original indicator.
Original indicator reference: "ma angles - JD" by Duyck
---
## 🎯 ORIGINALITY & VALUE PROPOSITION
### **What Makes This Different from the Original:**
While the original "MA Angles" by **JD** provided excellent angle visualization, it lacked actionable entry signals. **MA SMART Angle** addresses this by adding:
**1. Clear Entry/Exit Signals**
- Explicit BUY/SELL arrows based on angle crossovers, momentum confirmation, and MA alignment
- No guessing when to enter trades - the indicator tells you exactly when conditions align
**2. Non-Repainting Logic**
- All signals use confirmed historical data (shifted by 2 bars minimum)
- Critical for backtesting reliability and live trading confidence
- Original indicator could repaint signals on current bar
**3. Dual Signal System**
- **Simple Mode:** More frequent signals based on angle crossovers + momentum (for active traders)
- **Strict Mode:** Requires full multi-MA alignment + momentum confirmation (for conservative traders)
- Adaptable to different trading styles and risk tolerances
**4. Smart Signal Filtering**
- **Anti-spam cooldown:** Prevents duplicate signals within configurable bar count
- **No-trade zone detection:** Filters out low-conviction sideways markets automatically
- **Multi-timeframe MA alignment:** Ensures all moving averages agree on direction before signaling
**5. Enhanced Visualization**
- Large, clear BUY/SELL arrows with descriptive labels
- Color-coded backgrounds for market states (trending vs. ranging)
- Momentum histogram showing acceleration/deceleration in real-time
- Live status table displaying trend strength, angle value, momentum, and MA alignment
**6. Professional Alert System**
- Four distinct alert conditions: BUY Signal, SELL Signal, Strong BUY, Strong SELL
- Enables automated trade notifications and strategy integration
**7. Modified MA Periods**
- Original used EMA(27), EMA(83), EMA(278)
- Enhanced version uses faster EMA(3), EMA(8), EMA(13) for more responsive signals
- Better suited for modern volatile markets and shorter timeframes
---
## 📐 HOW IT WORKS - TECHNICAL EXPLANATION
### **Core Methodology:**
The indicator calculates angles (slopes) for five key moving averages:
- **JMA (Jurik Moving Average)** - Smooth, lag-reduced trend line (original implementation by **Everget**)
- **JMA Fast** - Responsive momentum indicator with higher power parameter
- **MA27 (EMA 3)** - Primary fast-moving average for signal generation
- **MA83 (EMA 8)** - Medium-term trend confirmation
- **MA278 (EMA 13)** - Slower trend filter
### **Angle Calculation Formula (by KyJ):**
```
angle = arctan((MA - MA ) / ATR(14)) × (180 / π)
```
**Why ATR normalization?**
- Makes angles comparable across different instruments (forex, stocks, crypto)
- Makes angles comparable across different timeframes
- Accounts for volatility - a 10-point move in different assets has different significance
**Angle Interpretation:**
- **> 15°** = Strong trend (momentum accelerating)
- **0° to 15°** = Weak trend (momentum present but moderate)
- **-2° to +2°** = No-trade zone (sideways/choppy market)
- **< -15°** = Strong downtrend
### **Signal Generation Logic:**
#### **BUY Signal Conditions:**
1. MA27 angle crosses above 0° (upward momentum initiates)
2. All three EMAs (3, 8, 13) pointing upward (trend alignment confirmed)
3. Momentum is positive for 2+ bars (acceleration, not deceleration)
4. Angle exceeds minimum threshold (not in no-trade zone)
5. Cooldown period passed (prevents signal spam)
#### **SELL Signal Conditions:**
1. MA27 angle crosses below 0° (downward momentum initiates)
2. All three EMAs pointing downward (downtrend alignment)
3. Momentum is negative for 2+ bars
4. Angle below negative threshold (not in no-trade zone)
5. Cooldown period passed
#### **Strong BUY+ / SELL+ Signals:**
Additional entry opportunities when JMA Fast crosses JMA Slow while maintaining strong directional angle - indicates momentum acceleration within established trend.
---
## 🔧 HOW TO USE
### **Recommended Settings by Trading Style:**
**Scalpers / Day Traders:**
- Signal Type: **Simple**
- Minimum Angle: **3-5°**
- Cooldown Bars: **3-5 bars**
- Timeframes: 1m, 5m, 15m
**Swing Traders:**
- Signal Type: **Strict**
- Minimum Angle: **7-10°**
- Cooldown Bars: **8-12 bars**
- Timeframes: 1H, 4H, Daily
**Position Traders:**
- Signal Type: **Strict**
- Minimum Angle: **10-15°**
- Cooldown Bars: **15-20 bars**
- Timeframes: Daily, Weekly
### **Parameter Descriptions:**
**1. Source** (default: OHLC4)
- Price data used for MA calculations
- OHLC4 provides smoothest angles
- Close is more responsive but noisier
**2. Threshold for No-Trade Zones** (default: 2°)
- Angles below this are considered sideways/ranging
- Increase for stricter filtering of choppy markets
- Decrease to allow signals in quieter trending periods
**3. Signal Type** (Simple vs. Strict)
- **Simple:** Angle crossover OR (trend + momentum)
- **Strict:** Angle crossover AND all MAs aligned AND momentum confirmed
- Start with Simple, switch to Strict if too many false signals
**4. Minimum Angle for Signal** (default: 5°)
- Only generate signals when angle exceeds this threshold
- Higher values = stronger trends required
- Lower values = more sensitive to momentum changes
**5. Cooldown Bars** (default: 5)
- Minimum bars between consecutive signals
- Prevents spam during volatile chop
- Scale with your timeframe (higher TF = more bars)
**6. Color Bars** (default: true)
- Colors chart bars based on signal state
- Green = bullish conditions, Red = bearish conditions
- Can disable if you prefer clean price bars
**7. Background Colors**
- **Yellow background** = No-trade zone (low angle, ranging market)
- **Green flash** = BUY signal generated
- **Red flash** = SELL signal generated
- All customizable or can be disabled
---
## 📊 INTERPRETING THE INDICATOR
### **Visual Elements:**
**Main Chart Window:**
- **Thick Lime/Fuchsia Line** = MA27 angle (primary signal line)
- **Medium Green/Red Line** = MA83 angle (trend confirmation)
- **Thin Green/Red Line** = MA278 angle (slow trend filter)
- **Aqua/Orange Line** = JMA Fast (momentum detector)
- **Green/Red Area** = JMA slope (overall trend context)
- **Blue/Purple Histogram** = Momentum (angle acceleration/deceleration)
**Signal Arrows:**
- **Large Green ▲ "BUY"** = Primary buy signal (all conditions met)
- **Small Green ▲ "BUY+"** = Strong momentum buy (JMA fast cross)
- **Large Red ▼ "SELL"** = Primary sell signal (all conditions met)
- **Small Red ▼ "SELL+"** = Strong momentum sell (JMA fast cross)
**Status Table (Top Right):**
- **Angle:** Current MA27 angle in degrees
- **Trend:** Classification (STRONG UP/DOWN, UP/DOWN, FLAT)
- **Momentum:** Acceleration state (ACCEL UP/DN, Up/Down)
- **MAs:** Alignment status (ALL UP/DOWN, Mixed)
- **Zone:** Trading zone status (ACTIVE vs. NO TRADE)
- **Last:** Bars since last signal
### **Trading Strategies:**
**Strategy 1: Pure Signal Following**
- Enter LONG on BUY signal
- Exit on SELL signal
- Use stop-loss at recent swing low/high
- Works best on trending instruments
**Strategy 2: Confirmation with Price Action**
- Wait for BUY signal + bullish candlestick pattern
- Wait for SELL signal + bearish candlestick pattern
- Increases win rate by filtering premature signals
- Recommended for beginners
**Strategy 3: Momentum Acceleration**
- Use BUY+/SELL+ signals for adding to positions
- Only take these in direction of primary signal
- Scalp quick moves during momentum spikes
- For experienced traders
**Strategy 4: Mean Reversion in No-Trade Zones**
- When status shows "NO TRADE", fade extremes
- Wait for angle to exit no-trade zone for reversal
- Contrarian approach for range-bound markets
- Requires tight stops
---
## ⚠️ LIMITATIONS & DISCLAIMERS
**What This Indicator DOES:**
✅ Measures momentum direction and strength via angle analysis
✅ Generates signals when multiple conditions align
✅ Filters out low-conviction sideways markets
✅ Provides visual clarity on trend state
**What This Indicator DOES NOT:**
❌ Predict future price movements with certainty
❌ Guarantee profitable trades (no indicator can)
❌ Work equally well on all instruments/timeframes
❌ Replace proper risk management and position sizing
**Known Limitations:**
- **Lagging Nature:** Like all moving averages, signals occur after momentum begins
- **Whipsaw Risk:** Can generate false signals in volatile, directionless markets
- **Optimization Required:** Parameters need adjustment for different assets
- **Not a Complete System:** Should be combined with risk management, position sizing, and other analysis
**Best Performance Conditions:**
- Strong trending markets (crypto bull runs, stock breakouts)
- Liquid instruments (major forex pairs, large-cap stocks)
- Appropriate timeframe selection (match to trading style)
- Used alongside support/resistance and volume analysis
---
## 🔔 ALERT SETUP
The indicator includes four alert conditions:
**1. BUY SIGNAL**
- Message: "MA SMART Angle: BUY SIGNAL! Angle crossed up with momentum"
- Use for: Primary long entries
**2. SELL SIGNAL**
- Message: "MA SMART Angle: SELL SIGNAL! Angle crossed down with momentum"
- Use for: Primary short entries or long exits
**3. Strong BUY**
- Message: "MA SMART Angle: Strong BUY momentum - JMA fast crossed up"
- Use for: Adding to longs or aggressive entries
**4. Strong SELL**
- Message: "MA SMART Angle: Strong SELL momentum - JMA fast crossed down"
- Use for: Adding to shorts or aggressive exits
**Setting Up Alerts:**
1. Right-click indicator → "Add Alert on MA SMART Angle"
2. Select desired condition from dropdown
3. Choose notification method (popup, email, webhook)
4. Set alert expiration (typically "Once Per Bar Close")
---
## 📚 EDUCATIONAL VALUE
This indicator serves as an excellent learning tool for understanding:
**1. Angle-Based Momentum Analysis**
- Traditional indicators show MA crossovers
- This shows the *rate of change* (velocity) of MAs
- Teaches traders to think in terms of momentum acceleration
**2. Multi-Timeframe Confirmation**
- Shows how fast, medium, and slow MAs interact
- Demonstrates importance of trend alignment
- Helps develop patience for high-probability setups
**3. Signal Quality vs. Quantity Tradeoff**
- Simple mode = more signals, more noise
- Strict mode = fewer signals, higher quality
- Teaches discretionary filtering skills
**4. Market State Recognition**
- Visual distinction between trending and ranging markets
- Helps traders avoid trading choppy conditions
- Develops "market context" awareness
---
## 🔄 DIFFERENCES FROM OTHER MA INDICATORS
**vs. Traditional MA Crossovers:**
- Measures momentum (angle) rather than just price crossing MA
- Provides earlier signals as angles change before price crosses
- Filters better for sideways markets using no-trade zones
**vs. MACD:**
- Uses multiple MAs instead of just two
- ATR normalization makes it universal across instruments
- Visual angle representation more intuitive than histogram
**vs. Supertrend:**
- Not based on ATR bands but on MA slope analysis
- Provides graduated strength indication (not just binary trend)
- Less prone to whipsaw in low volatility
**vs. Original "MA Angles" by JD:**
- Adds explicit entry/exit signals (original had none)
- Implements no-repaint logic for reliability
- Includes signal filtering and quality controls
- Provides dual signal systems (Simple/Strict)
- Enhanced visualization and status monitoring
- Uses faster MA periods (3/8/13 vs 27/83/278) for modern markets
---
## 📖 CODE STRUCTURE (for Pine Script learners)
This indicator demonstrates:
**Advanced Pine Script Techniques:**
- Custom function implementation (JMA, angle calculation)
- Var declarations for stateful tracking
- Table creation for HUD display
- Multi-condition signal logic
- Alert system integration
- Proper use of historical references for no-repaint
**Code Organization:**
- Modular function definitions (JMA, angle)
- Clear separation of concerns (inputs, calculations, plotting, alerts)
- Extensive commenting for maintainability
- Best practices for Pine Script v5
**Learning Resources:**
- Study the JMA function to understand adaptive smoothing
- Examine angle calculation for ATR normalization technique
- Review signal logic for multi-condition confirmation patterns
- Analyze anti-spam filtering for state management
The code is open-source - feel free to study, modify, and improve upon it!
---
## 🙏 CREDITS & ATTRIBUTION
**Original Concepts:**
- **"ma angles - JD" by JD (Duyck)** - Core angle calculation methodology and indicator concept
Original open-source indicator on TradingView Community Scripts
- **JMA (Jurik Moving Average) implementation by Everget** - Smooth, low-lag moving average function
Acknowledged in original JD indicator code
- **Angle Calculation formula by KyJ** - Mathematical formula for converting MA slope to degrees using ATR normalization
Acknowledged in original JD indicator code comments
**Enhancements in This Version:**
- Signal generation logic - Original implementation for this indicator
- No-repaint confirmation system - Original implementation
- Dual signal modes (Simple/Strict) - Original implementation
- Visual enhancements and status table - Original implementation
- Alert system and signal filtering - Original implementation
- Modified MA periods (3/8/13 instead of 27/83/278) - Optimization for modern markets
**Open Source Philosophy:**
This indicator follows the open-source spirit of TradingView and the Pine Script community. The original "ma angles - JD" by JD (Duyck) was published as open-source, enabling this enhanced version. Similarly, this code is published as open-source to allow further community improvements.
---
## ⚡ QUICK START GUIDE
**For New Users:**
1. Add indicator to chart
2. Start with default settings (Simple mode)
3. Wait for BUY signal (green arrow)
4. Observe how price behaves after signal
5. Check status table to understand market state
6. Adjust parameters based on your instrument/timeframe
**For Experienced Traders:**
1. Switch to Strict mode for higher quality signals
2. Increase cooldown bars to reduce frequency
3. Raise minimum angle threshold for stronger trends
4. Combine with your existing strategy for confirmation
5. Set up alerts for desired signal types
6. Backtest on your preferred instruments
---
## 🎓 RECOMMENDED COMBINATIONS
**Works Well With:**
- **Volume Analysis:** Confirm signals with volume spikes
- **Support/Resistance:** Take signals near key levels
- **RSI/Stochastic:** Avoid overbought/oversold extremes
- **ATR:** Size positions based on volatility
- **Price Action:** Wait for candlestick confirmation
**Complementary Indicators:**
- Order Flow / Footprint (for institutional confirmation)
- Volume Profile (for identifying value areas)
- VWAP (for intraday mean reversion reference)
- Fibonacci Retracements (for target setting)
---
## 📈 PERFORMANCE EXPECTATIONS
**Realistic Win Rates:**
- Simple Mode: 45-55% (higher frequency, moderate accuracy)
- Strict Mode: 55-65% (lower frequency, higher accuracy)
- Combined with price action: 60-70%
**Best Asset Classes:**
1. **Cryptocurrencies** (strong trends, clear signals)
2. **Forex Major Pairs** (smooth price action, good angles)
3. **Large-Cap Stocks** (trending behavior, liquid)
4. **Index Futures** (trending instruments)
**Challenging Conditions:**
- Low volatility consolidation periods
- News-driven erratic movements
- Thin/illiquid instruments
- Counter-trending markets
---
## 🛡️ RISK DISCLAIMER
**IMPORTANT LEGAL NOTICE:**
This indicator is for **educational and informational purposes only**. It is **NOT financial advice** and does not constitute a recommendation to buy or sell any financial instrument.
**Trading Risks:**
- Trading carries substantial risk of loss
- Past performance does not guarantee future results
- No indicator can predict market movements with certainty
- You can lose more than your initial investment (especially with leverage)
**User Responsibilities:**
- Conduct your own research and due diligence
- Understand the instruments you trade
- Never risk more than you can afford to lose
- Use proper position sizing and risk management
- Consider consulting a licensed financial advisor
**Indicator Limitations:**
- Signals are based on historical data only
- No guarantee of accuracy or profitability
- Parameters must be optimized for your specific use case
- Results vary significantly by market conditions
By using this indicator, you acknowledge and accept all trading risks. The author is not responsible for any financial losses incurred through use of this indicator.
---
## 📧 SUPPORT & FEEDBACK
**Found a bug?** Please report it in the comments with:
- Chart symbol and timeframe
- Parameter settings used
- Description of unexpected behavior
- Screenshot if possible
**Have suggestions?** Share your ideas for improvements!
**Enjoying the indicator?** Leave a like and follow for updates!

Smart Money Proxy IndexOverview
The Smart Money Proxy Index (SMPI) is an educational tool that attempts to identify potential institutional-style behavior patterns using publicly available market data. This comprehensive tool combines multiple institutional analysis techniques into a single, easy-to-read 0-100 oscillator.
Important Disclaimer
This is an educational proxy indicator that analyzes volume and price patterns. It cannot identify actual institutional trading activity and should not be interpreted as tracking real "smart money." Use for educational purposes and combine with other analysis methods.
Inspiration & Methodology
This indicator is inspired by MAPsignals' Big Money Index (BMI) methodology but uses publicly available price and volume data with original calculations. This is an independent educational interpretation designed to teach smart money concepts to retail traders.
What It Analyzes
SMPI tracks potential "smart money" activity by combining:
Block Trading Detection - Identifies unusual volume surges with significant price impact
Money Flow Analysis - Volume-weighted price pressure using Money Flow Index
Accumulation/Distribution Patterns - Modified On-Balance Volume signals
Institutional Control Proxy - End-of-day positioning and control analysis
Key Features
– Multi-Component Analysis - Combines 4 different institutional detection methods
– BMI-Style 0-100 Scale - Familiar oscillator range with clear extreme levels
– Professional Visualization - Dynamic colors, gradient fills, and clean data table
– Comprehensive Alerts - Buy/sell signals plus divergence detection
– Fully Customizable - Adjust all parameters, colors, and display options
– Non-Repainting Signals - All alerts use confirmed data for reliability
– Educational Focus - Designed to teach institutional flow concepts
How to Interpret
Above 80: Potential smart money distribution phase (bearish pressure)
Below 20: Potential smart money accumulation phase (bullish opportunity)
Signal Generation: Buy signals when crossing above 20, sell signals when crossing below 80
Divergences: Price vs SMPI divergences can signal potential trend changes
Volume Confirmation: Higher volume ratios strengthen signal reliability
Best Practices
Timeframes: Works best on higher timeframes for institutional behavior analysis
Confirmation: Combine with other technical analysis tools and market context
Volume: Pay attention to volume confirmation in the data table
Context: Consider overall market conditions and fundamental factors
Risk Management: Not recommended as standalone trading system
Customizable Parameters
Block Volume Threshold: Sensitivity for unusual volume detection (default: 2.5x average)
SMPI Smoothing Period: Index calculation smoothing (default: 25 bars)
Extreme Levels: Overbought/oversold thresholds (default: 80/20)
Money Flow Length: MFI calculation period (default: 14)
Visual Options: Colors, signals, and display preferences
Available Alerts
Buy Signal: SMPI crosses above oversold level (20)
Sell Signal: SMPI crosses below overbought level (80)
Extreme Levels: Alerts when reaching overbought/oversold zones
Divergence Detection: Bullish and bearish price vs SMPI divergences
Educational Purpose & Limitations
This indicator is designed as an educational proxy for understanding institutional flow concepts. It analyzes publicly available price and volume data to identify potential smart money behavior patterns.
Cannot access actual institutional transaction data
Signals may be slower than day-trading indicators (intentionally designed for institutional timeframes)
Should be used in conjunction with other analysis methods
Past performance does not guarantee future results
What Makes This Different
Unlike simple volume or momentum indicators, SMPI combines multiple institutional analysis techniques into one comprehensive tool. The multi-component approach provides a more robust view of potential smart money activity.

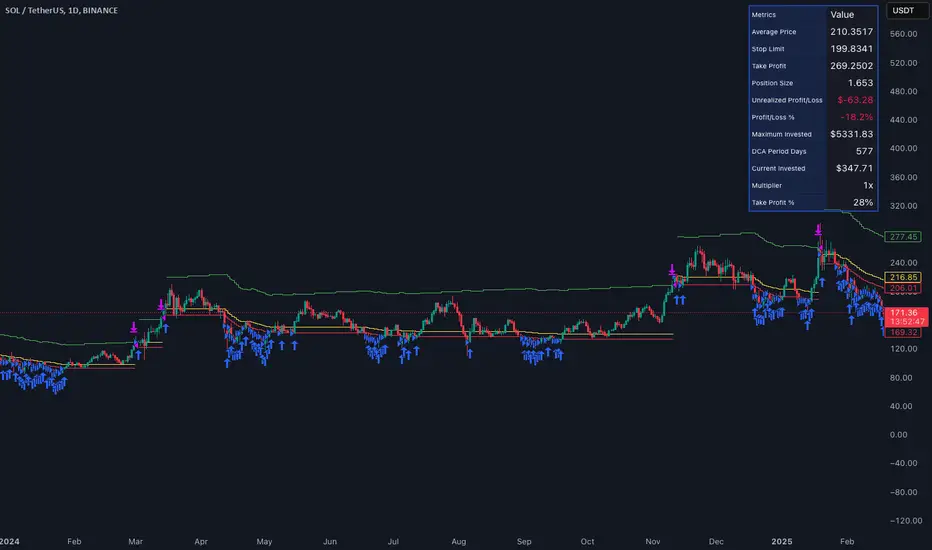
Smart DCA Invest LiteEnglish description:
📊 Smart DCA Invest – Features Overview
✅ Automated DCA strategy with dynamic profit targets, optimized risk management.
⚙️ Functionality:
🕒 Time Interval Settings
• 📅 Start Date and Time: The strategy activates only after the specified start time.
• 🔄 Auto Restart: Automatically restarts the strategy after a position is closed.
💵 Investment Amounts
• 🟢 Initial Investment Amount: The amount invested when the first position is opened.
• 🔄 Recurring Investment Amount: The amount invested periodically for subsequent purchases.
📊 Purchase Frequency
• ⏱ Interval Between Purchases: Specifies the minimum number of candles between two purchases to avoid overly frequent position expansions.
🛡️ Risk Management
• 📉 Loss Limit: The strategy halts additional purchases if the price does not drop below a predefined loss level, optimizing the average cost reduction.
• 🎯 Take Profit: A predefined profit target percentage, triggering position closure upon reaching it.
📈 Dynamic Take Profit (TP) Settings
• ⏳ TP Increase Frequency: The interval in days for dynamic TP growth.
• 📊 TP Growth Rate: The percentage by which the TP level increases at the end of each interval.
• ⚙️ Enable Dynamic TP: Allows the TP level to increase dynamically over time based on holding duration.
• 🧠 Smart Invest: Accumulates skipped purchases above the average entry or loss limit price and invests them when the price drops below the loss limit.
🎨 Visual Representation
• 📏 Average Price Line: Displays the average entry price in yellow.
• 🛑 Stop Limit Line: Displays the loss limit in red.
• ✅ Take Profit Line: Displays the dynamically updated profit target in green.
🎨 Visual Elements
• 📏 Average Price Line: Visualizes the average cost on the chart.
• 🛑 Stop Limit Line: Visualizes the loss limit level.
• ✅ Take Profit Line: Displays the TP level graphically.
• 📊 Statistics Table: Detailed data summary presented in a table at the end of the strategy.
📊 Statistics Table
• 📈 Average Price: The average entry price of the current position.
• 🛑 Stop Limit: The loss limit value.
• ✅ Take Profit: The profit target value.
• 📦 Position Size: The size of the current position.
• 💵 Max Invested Amount: The highest amount invested.
• ⏳ Longest DCA Period: The longest duration a DCA position was open.
• 💼 Current Investment: The amount currently invested.
• 🔄 Multiplier: Purchase multiplier value.
• 📊 Dynamically Adjusted TP %: The current dynamic Take Profit percentage.
- Recommended for retesting
Hungarian description:
📊 Smart DCA Invest – Funkciók Leírása
✅ Automatizált DCA stratégia dinamikus profitcélokkal, optimalizált kockázatkezeléssel.
⚙️ Működés:
🕒 Időintervallum Beállítások
• 📅 Kezdési dátum és idő: A stratégia csak a meghatározott kezdési időpont után aktiválódik.
• ⏳ Befejezési dátum és idő: A stratégia a meghatározott időpontig működik.
• 🔄 Automatikus újraindítás: Pozíciózárás után a stratégia automatikusan újraindulhat.
💵 Befektetési Összegek
• 🟢 Első befektetési összeg: Az első pozíció nyitásakor befektetett összeg.
• 🔄 Napi vásárlási összeg: Ismételt periódusonkénti vásárlások összege.
📊 Vásárlási Gyakoriság
• ⏱ Intervallum két vásárlás között: Meghatározza a minimális gyertya intervallumot két vásárlás között, elkerülve a túl gyakori pozícióbővítéseket.
🛡️ Kockázatkezelés
• 📉 Loss Limit: Ha az ár nem csökken egy meghatározott veszteségi szint alá, a stratégia nem vásárol tovább, hogy hatékonyabban csökkentse az átlagárat.
• 🎯 Take Profit: Előre meghatározott profitcél százalékos értéke, amely elérésekor a pozíció lezárul.
📈 Dinamikus Take Profit (TP) Beállítások
• ⏳ TP növelési gyakoriság: A dinamikus TP növekedésének időszaka napokban.
• 📊 TP növekedés mértéke: A TP szint százalékos növekedése az intervallum végén.
• ⚙️ Dinamikus TP engedélyezése: A TP szint dinamikusan növekszik a tartási idő függvényében.
• 🧠 Smart Invest: Kihagyott vásárlások felhalmozása (átlagos bekerülési vagy „Loss limit” feletti árfolyamnál), amelyek a „Loss limit” árszint alatt befektetésre kerülnek.
🎨 Vizuális Megjelenítés
• 📏 Átlagár vonal: Sárga színnel jelzi az átlagárat.
• 🛑 Stop Limit vonal: Piros színnel jelzi a veszteségi korlátot.
• ✅ Take Profit vonal: Zöld színnel jelzi a dinamikusan frissülő profitcélt.
🎨 Vizuális Elemek
• 📏 Átlagár vonal: Az átlagár megjelenítése a grafikonon.
• 🛑 Stop Limit vonal: A veszteségkorlátozási szint megjelenítése.
• ✅ Take Profit vonal: A Take Profit szint grafikai megjelenítése.
• 📊 Statisztikai táblázat megjelenítése: A stratégia végén részletes adatok jelennek meg egy táblázatban.
📊 Statisztikai Táblázat
• 📈 Átlagár: Az aktuális pozíció átlagos bekerülési ára.
• 🛑 Stop Limit: A veszteségkorlátozási szint értéke.
• ✅ Take Profit: A profitcél értéke.
• 📦 Pozícióméret: Az aktuális pozíció nagysága.
• 💵 Maximális befektetett összeg: A legnagyobb befektetett érték.
• ⏳ Leghosszabb DCA időszak: A leghosszabb időtartam, amíg egy DCA pozíció nyitva maradt.
• 💼 Aktuális befektetés: Az aktuálisan befektetett összeg.
• 🔄 Multiplikátor: Vásárlási szorzó érték.
• 📊 Dinamikusan beállított TP %: Az aktuálisan érvényes Take Profit százalékos értéke.
Smart Oscillator PremiumThe Smart Oscillator Premium indicator is a clever oscillator that helps you estimate the direction of trends. It is adaptive to a variety of markets and timeframes and provides rich and colorful visuals using a vibrant color scheme. Aiming to keep things simple, the oscillator only needs one parameter, the length of your base moving average, which defaults to 32.
Overview
As seen in the image above we provide key metrics to assist in choosing smart entry and exit points.
Key Features:
Get a better idea of the trend direction.
Spot divergences in price movements from your chosen moving average.
Using our Smart Candle technology better estimate tops and bottoms.
Using our Whale Sonar technology spot opportunities to enter and exit.
Smart Bollinger Bands using custom Fibonacci levels.
While we believe our default theme is attractive, we expose all style settings to the user to meet their preferences.
Alerts for divergences, with more coming soon.
Road Map:
While we believe this indicator should currently be used in a discretionary manner, we are currently working towards providing you with automated entry/exit signals. We also believe user feedback is a big part of the development process. You can leave us any suggestions or features you may want implemented via our Discord server.
Disclaimer:
By using this script you acknowledge past performance is not necessarily indicative of future results and there are many more factors that go into being a profitable trader.
Access:
See the authors instructions below to get access to our Premium Indicator suite.

Smart Money Concepts [Modern Neon V2]This is a visually overhauled version of the popular Smart Money Concepts (SMC) indicator, designed specifically for traders who prefer Dark Mode, High Contrast, and Maximum Visibility.
While the underlying logic preserves the robust structure detection of the original LuxAlgo script, the visual presentation has been completely modernized. The default "dull" colors have been replaced with a vibrant Cyberpunk Neon palette, and text labels have been significantly upscaled to ensure market structure is readable at a glance, even on high-resolution monitors.
🎨 Visual & Style Enhancements:
Neon Palette:
Bullish: Electric Cyan (#00F5FF)
Bearish: Neon Hot Pink (#FF007F)
Neutral/Levels: Bright Gold (#FFD700)
High Visibility Text: Market Structure labels (BOS, CHoCH, HH/LL) have been upgraded from "Tiny" to Normal size. Key Swing Points (Strong High/Low) are set to Large.
Modern "Solid" Blocks: Order Blocks and FVGs feature reduced transparency (60%) for a bolder, solid look that doesn't get washed out on dark backgrounds.
Decluttered: Removed unnecessary "Small" elements and dotted lines to focus on price action.
🛠 Key Features:
Real-Time Structure: Automatic detection of Internal and Swing structure (BOS & CHoCH) with trend coloring.
Order Blocks: Highlights Bullish and Bearish Order Blocks with new mitigation logic.
Fair Value Gaps (FVG): Auto-threshold detection for high-probability gaps.
Premium & Discount Zones: Automatically plots equilibrium zones for better entry targeting.
Multi-Timeframe Levels: Display Daily, Weekly, and Monthly highs/lows.
Trend Dashboard: (If you added the dashboard code) A clean panel displaying the current Internal and Swing trend bias.
CREDITS & LICENSE: This script is a modification of the "Smart Money Concepts " indicator.
Original Author: © LuxAlgo
License: Attribution-NonCommercial-ShareAlike 4.0 International (CC BY-NC-SA 4.0)
creativecommons.org

CVD Smart ReversalCVD Smart Reversal - Indicator Description
═══════════════════════════════════════════════════════════════
🎯 OVERVIEW
Advanced reversal detection system based on Cumulative Volume Delta (CVD) analysis with intelligent quality filtering. Each signal is rated 1-5 stars based on multiple confirmation factors.
═══════════════════════════════════════════════════════════════
🌟 KEY FEATURES
1. Quality Score System (⭐1-5)
• 5 independent criteria evaluate each signal
• Filter weak setups - show only 3+ star signals
• Higher scores = higher probability setups
2. Adaptive Thresholds
• Automatically adjusts to market volatility
• High volatility = stricter criteria
• Works across all market conditions
3. Volume Context Analysis
• Compares current vs historical volume
• Calculates buy/sell pressure (requires >60%)
• Filters reversals with weak volume
4. Multi-Timeframe Confirmation (Optional)
• Validates signals on higher timeframe
• Ensures trading with the trend
• Reduces counter-trend entries
5. Smart Signal Management
• Minimum 5-bar spacing between signals
• Automatic label cleanup (max 20)
• Clean chart, no clutter
═══════════════════════════════════════════════════════════════
📊 HOW IT WORKS
CVD Calculation:
Custom volume delta calculation using intrabar polarity estimation.
Signal Detection:
Combines CVD reversal, candlestick patterns (Hammer, Shooting Star, Engulfing, Pin Bar), and divergence analysis.
Quality Scoring:
Each signal scores 0-5 points based on:
• CVD strength (statistical deviation)
• Pattern quality (professional recognition)
• Divergence presence
• Volume context (ratio + pressure)
• Trend confirmation (MTF or acceleration)
═══════════════════════════════════════════════════════════════
🎮 USAGE MODES
Sniper Mode (High Quality):
• Min Score: 4-5 stars
• MTF: ON
• Result: 2-5 signals/day, highest win-rate
Active Mode (Balanced):
• Min Score: 3 stars
• MTF: OFF
• Result: 5-15 signals/day, good balance
Scalping Mode (High Frequency):
• Min Score: 2 stars
• Divergence: Weak
• Result: Many signals, fast execution needed
═══════════════════════════════════════════════════════════════
💡 BEST PRACTICES
• Use on liquid markets with reliable volume data
• Combine with key support/resistance levels
• Pay attention to quality scores - 4-5★ have significantly higher success
• Enable MTF confirmation for intraday trading
• Use stricter settings during high-impact news events
═══════════════════════════════════════════════════════════════
⚙️ DEFAULT SETTINGS
• Quality Filter: ON
• Minimum Score: 3 stars
• MTF Confirmation: OFF
• Volume Analysis: ON
• Divergence Strength: Medium
These settings provide 5-15 quality signals per day on active instruments.
═══════════════════════════════════════════════════════════════
🔔 ALERTS
Four alert types available:
• Strong Bullish Reversal (4-5★ only)
• Strong Bearish Reversal (4-5★ only)
• Regular Bullish Reversal (all qualified)
• Regular Bearish Reversal (all qualified)
═══════════════════════════════════════════════════════════════
⚠️ LIMITATIONS
• Requires volume data (not suitable for markets without volume)
• MTF confirmation adds lag by design
• Lower timeframes may need adjusted settings
• Quality filter reduces signal frequency by design
═══════════════════════════════════════════════════════════════
🎯 ORIGINALITY
This indicator combines multiple unique elements:
• Multi-factor quality scoring (not found in other CVD tools)
• Adaptive volatility-based thresholds
• Volume pressure calculation with directional filter
• Integrated MTF confirmation within scoring system
• Smart label management with automatic cleanup
The quality scoring system transforms CVD analysis from binary signals into a ranked opportunity system, allowing traders to prioritize setups based on confluence strength.
═══════════════════════════════════════════════════════════════
📈 DISPLAY ELEMENTS
• Background highlighting on signal bars
• Triangle markers at entry points
• Labels showing CVD, Delta, Divergence, Quality Score, Volume flag
• Real-time info panel with CVD metrics
• Clean visual presentation
═══════════════════════════════════════════════════════════════
✅ SUITABLE FOR
• Crypto (BTC, ETH, etc.)
• Stocks (AAPL, TSLA, SPY, etc.)
• Futures (ES, NQ, CL, etc.)
• Forex (brokers with volume data)
• All timeframes (1m to 1D)
═══════════════════════════════════════════════════════════════

Smart Structure Breaks & Order BlocksOverview (What it does)
The indicator “Smart Structure Breaks & Order Blocks” detects market structure using swing highs and lows, identifies Break of Structure (BOS) events, and automatically draws order blocks (OBs) from the origin candle. These zones extend to the right and change color/outline when mitigated or invalidated. By formalizing and automating part of discretionary analysis, it provides consistent zone recognition.
Main Components
Swing Detection: ta.pivothigh/ta.pivotlow identify confirmed swing points.
BOS Detection: Determines if the recent swing high/low is broken by close (strict mode) or crossover.
OB Creation: After a BOS, the opposite candle (bearish for bullish BOS, bullish for bearish BOS) is used to generate an order block zone.
Zone Management: Limits the number of zones, extends them to the right, and tracks tagged (mitigated) or invalidated states.
Input Parameters
Left/Right Pivot (default 6/6): Number of bars required on each side to confirm a swing. Higher values = smoother swings.
Max Zones (default 4): Maximum zones stored per direction (bull/bear). Oldest zones are overwritten.
Zone Confirmation Lookback (default 3): Ensures OB origin candle validity by checking recent highs/lows.
Show Swing Points (default ON): Displays triangles on swing highs/lows.
Require close for BOS? (default ON): Strict BOS (close required) vs loose BOS (line crossover).
Use candle body for zones (default OFF): Zones drawn from candle body (ON) or wick (OFF).
Signal Definition & Logic
Swing Updates: Latest confirmed pivots update lastHighLevel / lastLowLevel.
BOS (Break of Structure):
Bullish – close breaks last swing high.
Bearish – close breaks last swing low.
Only one valid BOS per swing (avoids duplicates).
OB Detection:
Bullish BOS → previous bearish candle with lowest low forms the OB.
Bearish BOS → previous bullish candle with highest high forms the OB.
Zones: Bull = green, Bear = red, semi-transparent, extended to the right.
Zone States:
Mitigated: Price touches the zone → border highlighted.
Invalidated:
Bull zone → close below → turns red.
Bear zone → close above → turns green.
Chart Appearance
Swing High: red triangle above bar
Swing Low: green triangle below bar
Bull OB: green zone (border highlighted on touch)
Bear OB: red zone (border highlighted on touch)
Invalid Zones: Bull zones turn reddish, Bear zones turn greenish
Practical Use (Trading Assistance)
Trend Following Entries: Buy pullbacks into green OBs in uptrends, sell rallies into red OBs in downtrends.
Focus on First Touch: First mitigation after BOS often has higher reaction probability.
Confluence: Combine with higher timeframe trend, volume, session levels, key price levels (previous highs/lows, VWAP, etc.).
Stops/Targets:
Bull – stop below zone, partial take profit at swing high or resistance.
Bear – stop above zone, partial take profit at swing low or support.
Parameter Tuning (per market/timeframe)
Pivot (6/6 → 4/4/8/8): Lower for scalping (3–5), medium for day trading (5–8), higher for swing trading (8–14). Increase to reduce noise.
Strict Break: ON to reduce false breaks in ranging markets; OFF for earlier signals.
Body Zones: ON for assets with long wicks, OFF for cleaner OBs in liquid instruments.
Zone Confirmation (default 3): Increase for stricter OB origin, fewer zones.
Max Zones (default 4 → 6–10): Increase for higher volatility, decrease to avoid clutter.
Strengths
Standardizes BOS and OB detection that is usually subjective.
Tracks mitigation and invalidation automatically.
Adaptable: allows body/wick zone switching for different instruments.
Limitations
Pivot-based: Signals appear only after pivots confirm (slight lag).
Zones reflect past balance: Can fail after new events (news, earnings, macro data).
Range-heavy markets: More false BOS; consider stricter settings.
Backtesting: This script is for drawing/visual aid; trading rules must be defined separately.
Workflow Example
Identify higher timeframe trend (4H/Daily).
On lower TF (15–60m), wait for BOS and new OB.
Enter on first mitigation with confirmation candle.
Stop beyond zone; targets based on R multiples and swing points.
FAQ
Q: Why are zones invalidated quickly?
A: Flow reversal after BOS. Adjust pivots higher, enable Strict mode, or switch to Body zones to reduce noise.
Q: What does “tagged” mean?
A: Price touched the zone once = mitigated. Implies some orders in that zone may have been filled.
Q: Body or Wick zones?
A: Wick zones are fine in clean markets. For volatile pairs with long wicks, body zones provide more realistic areas.
Customization Tips (Code perspective)
Zone storage: Currently ring buffer ((idx+1) % zoneLimit). Could prioritize keeping unmitigated zones.
Automated testing: Add strategy.entry/exit for rule-based backtests.
Multi-timeframe: Use request.security() for higher timeframe swings/BOS.
Visualization: Add labels for BOS bars, tag zones with IDs, count touches.
Summary
This indicator formalizes the cycle Swing → BOS → OB creation → Mitigation/Invalidation, providing consistent structure analysis and zone tracking. By tuning sensitivity and strictness, and combining with higher timeframe context, it enhances pullback/continuation trading setups. Always combine with proper risk management.

Smart Candle SizeIndicator Description: Smart Candle Size
The Smart Candle Size is a technical indicator designed for traders who seek to analyze market momentum and optimize their strategies based on candle size, trend direction, and risk management parameters. This indicator combines several analytical tools to offer a deeper understanding of price movements, facilitating the identification of potential trading opportunities.
What Does the Indicator Do?
The indicator analyzes each candle in relation to the previous one, evaluating whether the size and position of the current candle meet certain predefined criteria. By incorporating an Exponential Moving Average (EMA) as a trend filter and adjusting variables such as candle size proportion, maximum candle size, and minimum distance from the EMA, the indicator helps identify market conditions that may be favorable for entering or exiting a trade.
How Does the Indicator Work?
Candle Size Comparison:
Size Proportion: The indicator compares the size of the current candle to the previous one. If the current candle is proportionally larger based on the set value (e.g., 1.3 times larger), it is considered significant.
Trend Filter with EMA:
Exponential Moving Average (EMA): An adjustable-length EMA is used to determine the general market trend. Bullish signals are considered when the price is above the EMA, and bearish signals when it is below.
Additional Filters:
Maximum Candle Size: Limits the size of candles considered to avoid the influence of unusually large candles.
Minimum Distance from EMA: Ensures that the price is sufficiently away from the EMA to avoid signals in congested zones.
Calculation of Stop-Loss and Take-Profit Levels:
Based on the configured ticks, the indicator calculates and visually displays the SL and TP levels on the chart.
Visual Signals:
Candle Coloring: Candles that meet the criteria are dynamically colored (green for bullish and red for bearish).
Buy/Sell Labels: "W" labels are displayed for possible bullish opportunities and "X" for bearish ones.
EMA Visualization:
A shading is added around the EMA to provide an additional visual reference on the trend.
How to Use the Indicator?
Parameter Configuration:
Adjust the Size Proportion to set how much larger the current candle must be compared to the previous one.
Define the EMA Length according to your trading strategy.
Set the Maximum Candle Size and Minimum Distance from EMA to filter out unwanted signals.
Configure the SL and TP Ticks to automatically calculate the stop-loss and take-profit levels.
Signal Interpretation:
Green Candles (Bullish): Indicate possible buying opportunities if all criteria are met.
Red Candles (Bearish): Indicate possible short-selling opportunities.
Use the "W" and "X" labels as additional visual confirmation.
Trade Planning:
Use the SL and TP levels displayed on the chart to plan your orders and manage risk.
Visual Customization:
Select the Chart Mode (Light or Dark) to adapt the indicator to your visual preferences.
Example Configuration for AUDJPY
As an example, here is a configuration applied to the AUDJPY currency pair:
Size Proportion: 1.3
EMA Length: 27
Maximum Candle Size: 120
Minimum Distance from EMA: 141
SL Ticks: 100
TP Ticks: 300
This configuration can be used as a starting point and adjusted according to the specific characteristics of AUDJPY and the individual trader's preferences.
What Makes This Indicator Original?
Integration of Multiple Filters: Combines candle size comparison with trend and volatility filters to offer more refined signals.
Extensive Customization: Allows adjustment of multiple parameters to suit different assets and trading styles.
Intuitive Visualization: Provides clear visual signals and SL/TP levels directly on the chart, facilitating decision-making.
Built-in Risk Management: By calculating and displaying SL and TP levels, the indicator aids in planning and risk management for each trade.
Additional Considerations
Not a Standalone Indicator: It is recommended to use this indicator in conjunction with other technical and fundamental analyses for better decision-making.
Prior Testing: Before using it on a real account, it is advisable to test the indicator on a demo account to familiarize yourself with its functionality and adjust parameters as necessary.
Limitations: Like all technical indicators, it does not guarantee results and should be used as a support tool.
Conclusion
The Smart Candle Size is a versatile tool that offers a combination of price action analysis and risk management. By providing significant details on how it works and how it can be customized, traders can leverage its features to complement their trading strategies across different markets and time frames.
Compatible with TradingView and ready for immediate use, this indicator can be a valuable addition to your set of trading tools.

Smart Money Index (SMI)It came to my attention that one very common implementation of SMI was incorrect; rather than subtracting the first hour delta and adding the last hour delta it subtracts the whole day delta and adds the last 30m delta. While this indicator might have had some use, it is not what I understand to be the actual Smart Money Index and so I post this as a correction for use in other scripts.
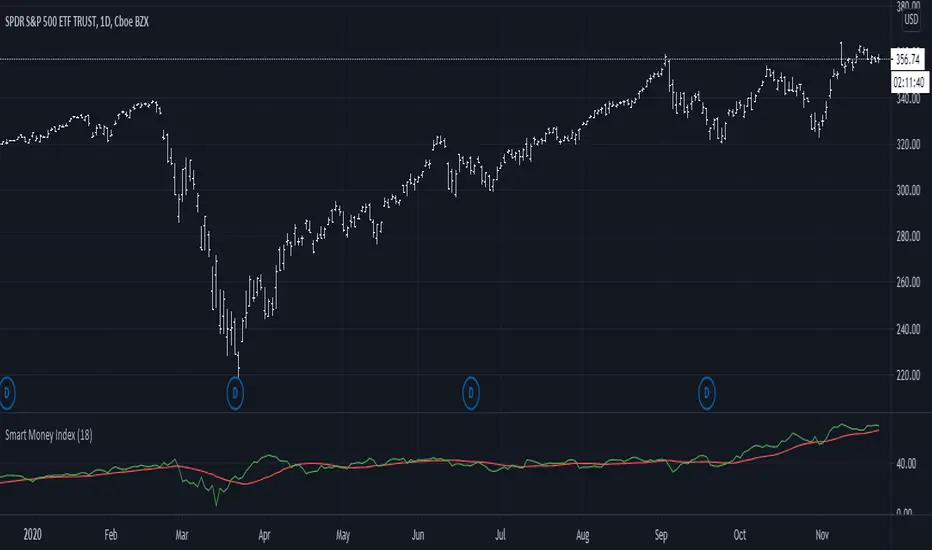
Smart labelling - Candlestick FunctionOftentimes a single look at the candlestick configuration happens to be enough to understand what is going on. The chandlestick function is an experiment in smart labelling that produces candles for various time frames, not only for the fixed 1m, 3m , 5m, 15m, etc. ones, and helps in decision-making when eye-balling the chart. This function generates up to 12 last candlesticks , which is generally more than enough.
Mind that since this is an experiment, the function does not cover all possible combinations. In some time frames the produced candles overlap. This is a todo item for those who are unterested. For instance, the current version covers the following TFs:
Chart - TF in the script
1m - 1-20,24,30,32
3m - 1-10
5m - 1-4,6,9,12,18,36
15m - 1-4,6,12
Tested chart TFs: 1m, 3m ,5m,15m. Tested securities: BTCUSD , EURUSD
