Easy TrendThis signal is completely based on analysis and transformation of a single simple moving average. As with all signals and indicators, it should be combined with others.
This is how the signal is built:
1. First it takes the SMA of the closing price.
2. It then takes the ROC of that SMA using a length of 1.
3. It takes an 8-period SMA and also a 64-period SMA of that ROC.
4. These are plotted as follows:
- the ROC is plotted in green when above 0 (trending up) and red when below 0 (trending down).
- the 8-period SMA is plotted as a thin white line within the ROC signal
- the 64-period SMA is plotted as a thick white line within the ROC signal
When the trendline is green, this is a bullish zone. When the trendline is red, this is a bearish zone.
Moving averages (all types of moving averages) are inherently lagging signals. To compensate for that, I am offsetting each SMA series by half of its period. This may be confusing to some, but the end result is a mathematically accurate SMA signal, centered on the signal that it is providing the moving average of. It doesn't stop the lag, but it directly and obviously shows how lagged each signal is, which I personally find better to trade against.
Symbols on the top and bottom of indicator:
Yellow triangle at bottom of indicator shows where a downward trend is starting to bottom out and a buy/long opening may be available soon.
Green triangle at bottom of indicator shows that a downward trend has switched to an upward trend. This indicates a good time to buy.
Yellow triangle at top of indicator shows where an upward trend is starting to plateau and a sell/short opening may be available soon.
Red triangle at top of indicator shows that an upward trend has switched to a downward trend. This indicates a good time to sell.
Note: You may see multiple yellow triangles before seeing a green or red triangle. This can happen when multiple trend accelerations or decelerations occur within an overall green or red zone.
In addition there is a dotted line connecting the end of the 64-period SMA to the end of the 8-period SMA. This indicates the direction the trend is moving towards. When the dotted line crosses the zero line, this portrays a rough estimate of where the trend may switch from a downtrend to an uptrend or vice versa. This is the "best" time to buy or sell, depending on your strategy.
I recommend placing a SMA on your candles set to the same window size as this indicator, and also to offset that SMA to the left by half its window size. For example, a 90-period SMA should be offset by -45 periods. That will cause it to be correctly aligned with this trend signal.
Signals


LTF Signal with KTS ConfirmationLTF Signal with Ichimoku KTS Confirmation
If you cant to learn more about ichimoku and KTS strategy from Forex Kei trader.
This indicator is based in multiple indicators. I will try to explain how it works.
Input
The only input is the major trend resolution. This is for Ichimoku and KTS trend confirmation
Signals
This script provide sell or buy signals provided on some condition explained just below
Mandatory conditions
Ichimoku KTS : kumo up, SSA or SSB up and kijun up or kumo down, SSA or SSB down and kijun down
RSI or Accumulation/Distribution should be rising or falling
Price should be moving up or down
Price should have break previous 6 candles high or low
2 optional conditions explained below
optional conditions
EMA 9 should have crossed EMA 21
Price should have crossed SMA 50
Stochastic 30 10 10 should have gold cross
Price should have cross vwap
The signals are triggered if all mandatory conditions are filled and at least 2 optional conditions

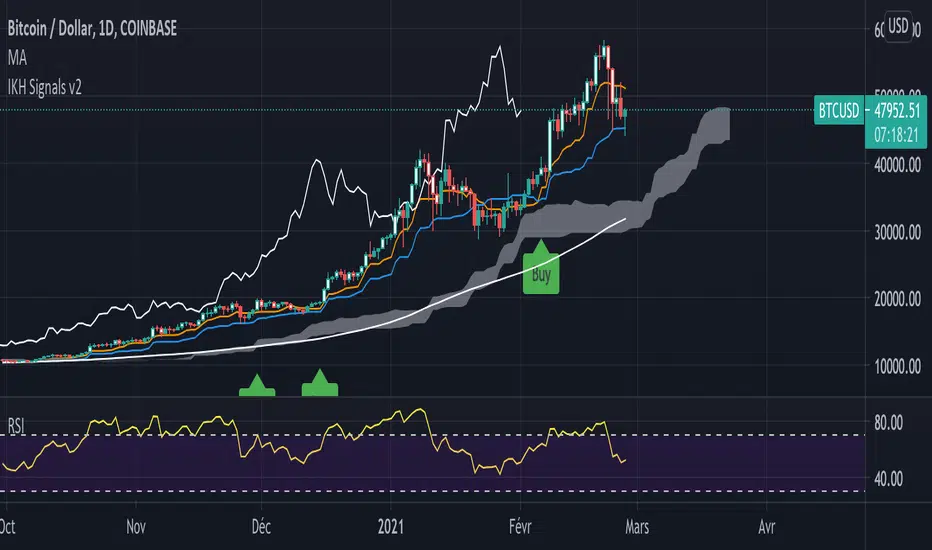
IKH Signals v2Ichimoku Kinko Hyo Signals
This script show signals based on my understanding in Ichimoku Kinko Hyo and is an evolution of this script
Instead of using my own functions, I use now the ones provided by pine script
/!\ Please do not follow signals blindly and always make your own analysis /!\
Signals explanation
Buy : Price above kumo, tenkan above kijun, chikou span above candles and kumo and price break previous 9 candles high
Strong Buy : Is a Sanyaku Kouten and can show a potential reverse in current tendance
Sell : Price below kumo, tenkan below kijun, chikou span below candles and kumo and price break previous 9 candles low
Strong Sell : Is a Sanyaku Gyakuten and can show a potential reverse in current tendance
Exit : Show a potential time to take profit based on previous Sell, Strong Sell, Buy, or Strong Buy signal
Buy Colored bard : bar a colored between a buy signal and an buy exit signal, based on this conditions : kumo up, SSA or SSB up and kijun up
Sell Colored bard : bar a colored between a sell signal and an sell exit signal, based on this conditions : kumo down, SSA or SSB down and kijun down
How to use it
When a signal is triggered
A signal ( strong or not ) show a new entry point. You can start looking for an entry in lower timeframe according to the signal direction.
A colored bar means that the price is pushing in a direction according to the previous signals, It's a good moment to look for an entry in lower timeframes.
Alerts
You can configure alerts for Strong buy, buy, Strong sell, sell and both exit signals
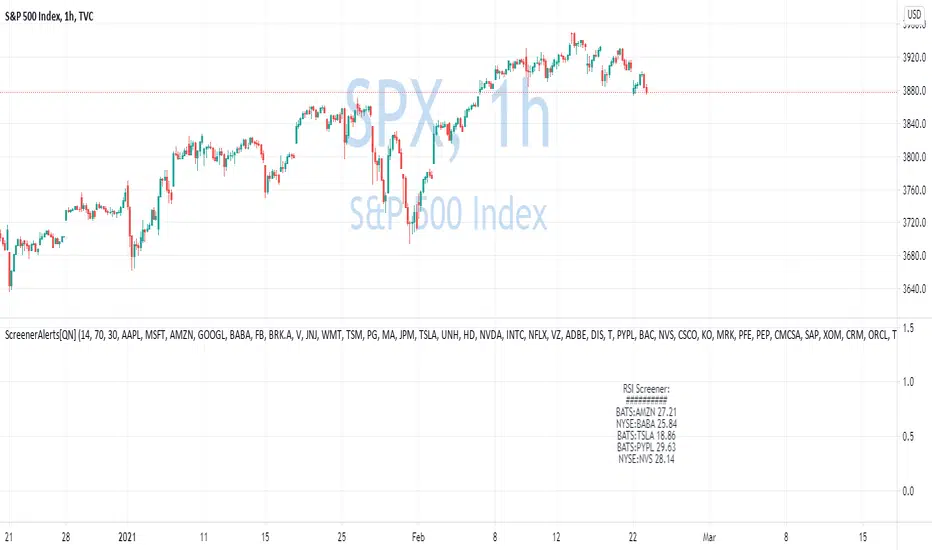
Custom Screener with Alerts V2 [QuantNomad]TradingView just recently announced the alert() function that allows you to create dynamic alerts from both strategies and studies.
So I decided to update custom screener I published before. It was based on alerts from orders in strategies, that was the only way to create dynamic alerts in PineScript at that point.
With the alert() function code become cleaner and more readable.
It works for up to 40 symbols at the same time.
You can create an alert from it easily by selecting screener name from the list and then selecting "Any alert() function call".
No additional configuration is required, message and alert on close I set up in the code.
I created as an example a screener that tracks both overbought (RSI > 70) and oversold stocks (RSI < 30).
To create your own screener you have to change only screenerFunc().
By design it should output 2 values:
cond - True/False Boolean variable. Should this instrument be displayed in the screener?
value - Additional numeric value you can display in your screener. I display RSI level for selected stocks for example.
Link to the old screener:
Disclaimer
Please remember that past performance may not be indicative of future results.
Due to various factors, including changing market conditions, the strategy may no longer perform as good as in historical backtesting.
This post and the script don’t provide any financial advice.
Binary Option Turbo M1 by MercalonaAuto risk
You are diving into a high-risk investment. We are not responsible for losses, the only certainty is that they will come, the most important thing is to manage them. Test this script on a demo account, and use the backtest. Make sure you are familiar with it before using real money. Use all your experience and other assistance for better accuracy. Do not risk more than 5% per day. Try to use a maximum of 1-2%.
Recommendations
It is highly recommended whenever trying to make entries in stronger areas
Try to make entries when the graph is in trend and with good movements. It is better to lose an entry than to lose money.
Check if the chart is already with good accuracy before making your entry. At least 65%.
Try to make entries when the payout is above 75%. This will help you with risk / return.
About the Script
This script was developed to identify good entry areas quickly and safely. We recommend using in binary option, where the next candle is successful. Although it can also be used in other markets, using a larger timeframe, such as 1h or 4h.
How it works?
This script is based on trends, up and down, where up trend, we look for "CAL" entries in retractions, and down trends, the entries will be "PUT". Always operate in favor of the trend for better accuracy. A session filter is also displayed. The Filter is based on the New York and London session. In these periods there is a greater market volatility, where it is recommended to operate and avoid losses. In addition, there is also a (no trend) filter. Where it shows whether the chart is volatile or not, even during open market sessions.
What is the final result?
This script will show good entries areas. These areas are represented with lines. The lines closest to the current price are thinner lines. And the lines far from price are thicker. The thick lines represent stronger areas and are resistant to price. This means that there is a greater possibility of reversal when prices touch these lines.
Settings (mode)
There are 2 configuration modes:
1. MODERATELY
2. AGGRESSIVE
Using the "MODERATELY" mode, the signals are rarer, here we expect the price to hit the best areas indicated. To place the entry. Here we expect greater accuracy.
In "AGGRESSIVE" mode, we don't expect good entries. Whenever the price hits entry areas it will be considered an entry. In this case, the accuracy is less, since the areas do not have a great potential for reversion.
Settings (Length)
Here the number of bars can be configured for the calculation of support and resistance areas. A low amount may not be enough to check for good areas. And a very large area can be confused with areas that really matter. Try to check the best quantity for the chart you want to trade.
Settings (Win Rate Limit)
Place the limit of analyzed signals in this field. It is restricted to the “Win Rate Max Bars” field, which will be explained below. If the configured limit is not reached, the cause is that there were not enough signals within the configured bar limit. ATTENTION: Understand that a high value will cause a slow calculation of the script.
Settings (Win Rate Max Bars)
This is information is used to limit the number of bars in the “Win Rate” calculation. ATTENTION: Understand that a high value will cause a slow calculation of the script.
Settings (Sessions)
There are 2 other configurations. New York session and London session. You can see how it works reading below.
Indicator “Stars of Recommendation”
The indicator has 3 stars of recommendation.
NO TRADE (There is no positive point to take chances)
In Session (At least 1 open market, this is a positive point to take chances)
In Trend (There is a good probability of assertiveness when it is on trend)
More than one identified area. (Generally, when there is more than one area, the more distant areas become stronger and stronger. This is a positive point when the price reaches them.)
Good luck ❤️
Please feedback us.
We hope this helps you!

BOSCILLATOR. A BOSS OSCILLATORI would like to first say I do not the indicator pieces. Would like to personally give thanks and credit to @MarkBench for coding this indicator and helping to get my vision for this system finally able to be published and used by anyone. I would also like the thank @lazy bear and @ChrisMoody for their bringing the Firefly oscillator and the SCHAFF TREND and the PPO price percentage oscillator to trading view. and @scilentor for his version of Godmode with LSMA . Thanks to @Shizaru for bringing Frama moving average (which we have adopted into the PPO as one of the base selections for the first time, as well as the ALMA ). Divergences have also been added. and components of the firefly have been removed such as the histogram. I have added two oscillators in the picture. The bottom is the standard settings. The above is how I prefer mine to look after tweaking the settings.
Before I get into explaining how its used. I want to say all the indicators are open and none privately owned or at least owned by indivduals who brought them to trading view. Any due permission is granted at my disclocsure. I also want to say this is not your typical mashup of indicators as the is a very clear way to view and use this specifically. Also I want to say original tools from their original scripts are also improved. For example the PPO being used we have added the FRAMA and ALMA moving average basis option which it did not have before. And now everything has clear divergences and some other minor changers. but here are the rules and examples.
THE BOSCILLATOR - A MULTI-LEVEL CONFLUENCE/CONFIRMATION FILTER VISUALIZATION
Some shorthand
(Main oscillator - firefly)
(background wave thing - PPO )
(the red vertical up and down line with red and green dots - STC )
(the blue, yellow and red dots - warning dots)
WHO IS THIS INDICATOR FOR? - This indicator itself is not meant to be a signal giver to buy or sell right now even though it could be and some of the original scripts are used as such. This indicator is actually meant to be a VISUAL CONFIRMATION & FILTER for trades taken in other methods outside of this indicator. What are some of those methods that may benefit from having this? Pivot point traders, FIB traders, Bollinger band traders, Moving average traders.. just to name a few. This indicator itself is meant to in a quick glance allow the trade to see the condition of many different elements outside of the main price and chart, and determine if that trade looks like it has too much risk, or if that trade looks suitable. It also provides a series of confirmations that could be used for adding to a position at different levels at the trade's discretion.
OPTIMAL CONDITIONS FOR CONSIDERING A SHORT = The PPO is orange/red + the STC is at the TOP + the Firefly is above the midline. The warning dots are being printed at the top. There is regular or hidden bearish divergence present.
OPTIMAL CONDITIONS FOR CONSIDERING A LONG = The PPO is light/dark green + the STC is at the BOTTOM + the Firefly is below the midline. The warning dots are being printed at the bottom. There is regular or hidden bullish divergence present.
Triggers for scaling/adding into your position = Keeping in mind that this oscillator on its own is not meant to be the sole reason for taking a trade, here are some triggers you will see for getting into position (preferably with the optimal conditions being met) The firefly flips from a green line into a red slide and vise versa. The firefly crosses the midline up or down. The STC begins going up/down and triggers a green or red dot while crossing one of the levels at 20 or 80. The warning dots being made begin to be printed lower/higher than the dot before last. The PPO shift from one color to the next in the favored direction of the trade you wish to make.
Signs for taking profit and protecting your trade = The Dots begin to print, the PPO changes colors at the top or bottom. the STC arrived are the top.
FILTER SITUATIONS TO AVOID TRADES = Wise to not take a trade if the PPO and the firefly do not agree. For example - if the PPO is showing green yet the firefly is still red may be an indication that it is getting a bit late for you to enter the trade. Same with opposing divergences and warning dots contradicting the trade you are looking at. The STC being already on the bottom or top may be a small indication that trade may already have been a little too ripe, but on its own is not always the case.
When selecting the PPO settings and moving average you are going to want it to be in favor of what you are trying to accomplish.IF you are one low time frames and trying to swing or scalp trade... chances are you want a reactive MA setting that iss responsive. Iwould recommend the HULL, ALMA, TEMA DEMA. For the Higher time frame the EMA or the T3 WDma can be wuite patient and helpful for a constant reminder of caution
Some notes - for the swing and scalp trading... in my experience the PPO moving average basis sees more responsive changes with the FRAMA , ALMA , HULL settings. for entering a trade, at least a couple of your triggers being present increases the success rate by a lot.
This chart illustrates the usefullness of having a Zero lag function for the firefly. The firefly should not be taken for signals or trades itself. However it is the most precise finder of divergences within the system. It is aways good to flip on and off zero lag just to take a quick look for divergences you might have mixed.
In this chart illustrates the general visual look and order of events to guide you along your way. Starts with the PPO turning green or red or orange which is potentially time to get out of your current trade. Then it switched colors when reversal begins and that is when you want to at the same time see the STC, the firefly, and lower caution dots coming in around the same area (highlighted in blue squares). Now near the end you see a red box. This is a filter aspect. The PPO is green, yet the others are saying down/short. This does not mean it must be a long, however it is great warning to maybe avoid getting to bearish for the downside in that time. You want the PPO and line up with the others and it should be visually apparent that they all want to go the same way.
Here is a list of some key elements (before changes this script made) of parts this oscillator includes. My original publication of my oscillation setup was blocked by the mods here.. this one however includes a large variety of items that have been altered from their original formats and a well-explained trading system to use it with.
// Firefly
Firefly Oscillator
// PPO
PPO PercentileRank Mkt Tops & Bottoms (@PuppyTherapy)
// Divergence
Divergence Indicator (any oscillator)
// Godmode
Godmode3.2+LSMA
// Schaff
Schaff Trend Cycle
// Frama
(FRAMA) Fractal Adaptive Moving Average

LordPepe Stochastic SignalsThis is the Lord Pepe. Howdy. Basic buy/sell indicator to accumulate along a downtrend and release your stack during the uptrend and oversold levels of the stochastic. The buys should be used to stack, and sells indicate levels of profit taking, they do not signal a long term reversal, only < 25% of stack should be released on "OB" signals.
OB - overbought (sell)
OS - oversold (buy)
MM Ultimate Hull CrossThe MM Ultimate Hull Cross Is based on the nnfx trading strategy
with a combination of a ribbon hull moving average, Vma, and Alma baseline for trend direction
the hull ma with generate buy/sell signals
the vma detects volume and will confirm your buy/sell signal buy turning red or green and grey for "hold"
the Alma acts as your baseline and changes from green to red to show up or downtrend .
has built in generated signals with entry, Atr calculated stop loss, and 3tp levels that can be turned off in the settings. every time a signal is generated.
has purple alerts when tp's are hit
Buy/Sell alerts
alma trend change alerts with background color
link below or PM us for access you this indicator Happy Trading

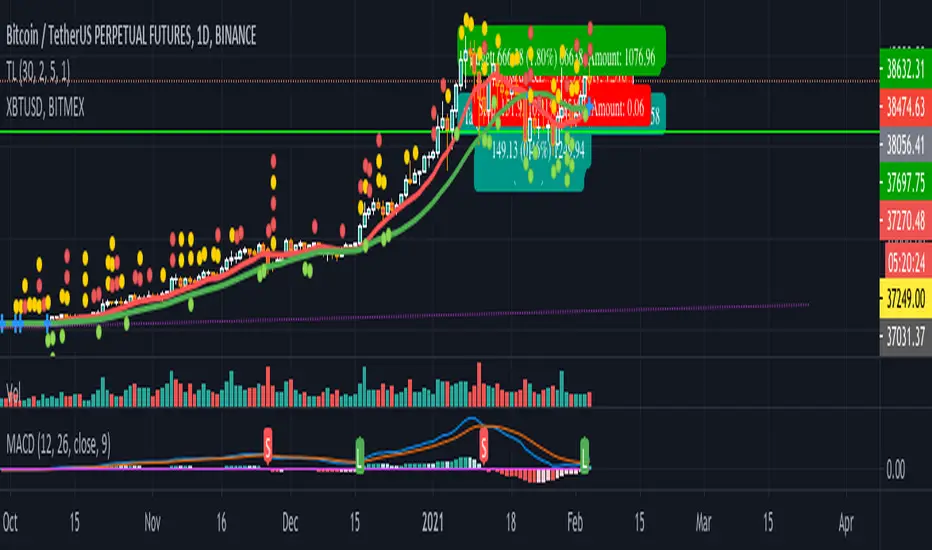
MACD signal with alert (long/short/close) for TV free accountSend MACD alert through email (available for free/pro user):
// 3 - buy
// -2 - short
// 0 - close position
// 1 - ignore
Example buy signal
Alert: STRAT3. BINANCE:BTCUSDTPERP, price = 31080
Example sell signal
Alert: STRAT-2. BINANCE:BTCUSDTPERP, price = 31080
Example close signal
Alert: STRAT0. BINANCE:BTCUSDTPERP, price = 31080
Example ignore signal
Alert: STRAT1. BINANCE:BTCUSDTPERP, price = 31080
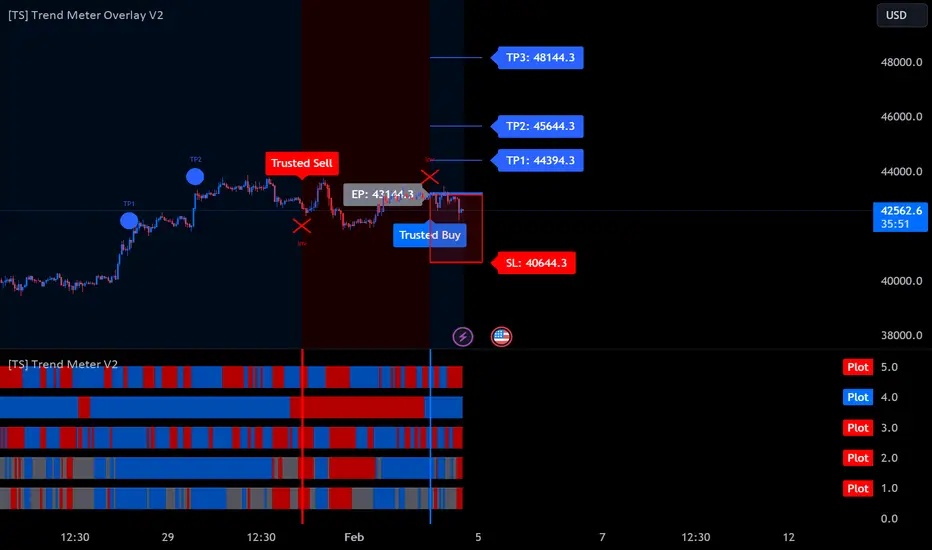
[TS] Trend MeterHOW IT WORKS
The meter consists of 5 Different Trend Indicators: Gann HILO Activator, ParabolicSAR, our custom TS Oscillator, our non-repainting/non-lagging Higher Timeframe Trend Indicator, plus our Market Sentiment Indicator
HOW TO USE
1. When the majority of the meters turn green, it is a sign the market is heading up.
2. When the majority of the meters turn red, it is a sign the market is going down.
- The user has the option to select how many meters must allign for a signal to show
- The indicator also has the ability to setup Alerts when the selected number of meters turn green or red. This feature is also signaled by the red or green vertical lines.
trendOne [Alerts]BITSTAMP:BTCUSD
trendOne
(alerts)
This script combines all our previous trend-based scripts (Bows, Autopilot, Trend Indicator, Price Deviation, etc) in only one script .
To calculate the trend we use:
Volume Weight
Average True Range
Bows calculations
Trends smoothed with alma() function.
For more accuracy on the signals and to filter unwanted signals we layered slower time-frames in the background and added breaking support & resistance rules.
Inputs
Sensitivity
Integer input. Sets the sensitivity for signals generated up and down. Higher values will generate less signals on chart, and vice-versa.
Enjoy!
To get access to this and other scripts check links below.

Precise_SignalThis signal combines a portion of Chris Moody's 2014 SlingShot and my 2017 MTF Indicators. Both of our prior scripts over indicated Buy and Sell Points. This signal indicates a buy or sell point much less than our prior scripts did but with absolute precision.
I would say it is 100% accurate, but that is because I am yet to find a timeframe and symbol where the Buy signal failed to see the equity move up or the Sell signal failed to see the equity move down over the next 5 bars. I have tested 2000 charts so far. To be safe, I would rather state this indicator is accurate nearly 100% of the time.
The indicator is made up of 2 main portions and both of them have to agree on a buy or sell in order to indicate such with a vertical green or maroon bar beneath the chart. If there is a failure to agree, nothing is signaled.
Indicator 1 combines a stochastic of a 3 hour chart and a daily chart to determine when the stochastics are in agreement on direction. When there is agreement, both of them MUST cross from a buy state to a sell state and vice versa at exactly the same time. This is difficult to achieve and it is already rare for this occurrence to produce a signal. When a signal is produce it is combine with Chris Moody's 2014 SlingShot Indicator which conservatively determines Buy and Sell signals based on EMAs and market direction. Signals from his SlingShot are infrequent.
BUY Signal
When my MTF signals Buy at the same time that the SlingShot signals a Buy, a vertical green bar will appear in the window containing this script. The vertical bar is based on the close price of the equity and is only final when the close price is final. A BUY signal means the equity will move up potentially as early as the next bar and achieve a higher value from the close price on the signal bar.
SELL Signal
Likewise, a sell signal from the MTF at the same time as a sell signal from the SlingShot will create a maroon bar in the window containing this script. The vertical bar is based on the close price of the equity and is only final when the close price is final. A SELL signal means the equity will move down potentially as early as the next bar and achieve a lower value from the close price on the signal bar.
The default values for this script are hard-coded into this script. You can edit any of the value you would like to play with other timeframes, stochastic, and moving average lengths.
I have played with these values and have hard-coded the ones that are most accurate. Please let me know if you find others that work.
Hopefully this becomes an extra tool in your technical trading toolkit.

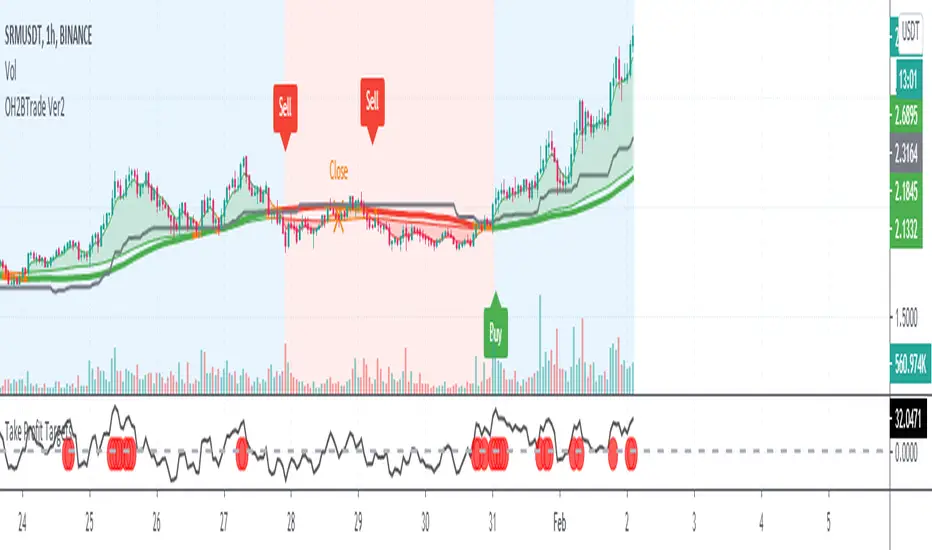
OH2B Take Profit IndicatorOH2B Trading Indicator
The Take-Profit Indicator gives you exit points for taking profits based on the Average Directional Index and Relative Strength Index.
It also gives you possible swing-high and swing-low in a trend .
The OH2B Trading Indicator is an indicator that gives you entry points for BUY and SELL based on Trend Channel and Ema-Crossover.
Both indicators work better in tandem with the best result.
Trading with Both Indicators
Orange Zone : Wait for the next signal from OH2B Trading Indicator.
The OH2B Trading Indicator gives you entry points for BUY or SELL .
When the ema1 crosses above ema2, the trend channel will be painted GREEN in color, and a BUY signal will appear. = BUY
When the ema1 crosses below ema2, the trend channel will be painted RED in color, and a SELL signal will appear. = SELL
When a BUY or SELL signal appears on the chart, don't rush into any trade.
Please allow a few hours for confirmation of signals .
To take profit, please follow the Take-Profit Indicator at the bottom.
RED dots are the Take-Profit targets for the BUY (long) signal
GREEN dots are the Take-Profit targets for the SELL (short) signal
*After taking profit, please set a Stoploss to at least break-even level to protect your profits.
When the price enters the Orange Zone again, you may close your trade and wait for the next signal.
If you like to keep your positions at Orange Zone, please remember to set a stop-loss alert when an opposite signal pops up on the chart.
Often the price goes to the Trendline after the signal, so keep some funds to increase the position or even open all position near the Trendline , or use it for re-enter with SL after you closed position on TPs.

OH2B Trading Indicator for Swing TradingOH2B Trading Indicator
The OH2B Trading Indicator is an indicator built for advanced traders.
It gives you entry points for BUY and SELL based on Trend Channel and Ema-Crossover.
It offers you a higher frequency of signals for swing trading.
The Take-Profit Indicator gives you exit points for taking profits based on the Average Directional Index and Relative Strength Index.
Trading with Both Indicators
Orange Zone : Wait for the next signal from OH2B Trading Indicator.
The OH2B Trading Indicator gives you entry points for BUY or SELL .
When the ema1 crosses above ema2, the trend channel will be painted GREEN in color, and a BUY signal will appear. = BUY
When the ema1 crosses below ema2, the trend channel will be painted RED in color, and a SELL signal will appear. = SELL
When a BUY or SELL signal appears on the chart, don't rush into any trade.
Please allow a few hours for confirmation of signals .
To take profit, please follow the Take-Profit Indicator at the bottom.
RED dots are the Take-Profit targets for the BUY (long) signal
GREEN dots are the Take-Profit targets for the SELL (short) signal
*After taking profit, please set a Stoploss to at least break-even level to protect your profits.
When the price enters the Orange Zone again, you may close your trade and wait for the next signal.
If you like to keep your positions at Orange Zone, please remember to set a stop-loss alert when an opposite signal pops up on the chart.
Often the price goes to the Trendline after the signal, so keep some funds to increase the position or even open all position near the Trendline , or use it for re-enter with SL after you closed position on TPs.
Tips for the traders:
Recommended using the indicators at 1H Timeframe .
Recommended using the indicators for Spot Trading at both Crypto and Stock Market.
Do not use leverage above 5x.
No more than 5% of the deposit in one trade.
Try to enter/exit a position by limit orders.
Do not rush into any trade when a new signal pops up, please allow a few hours for confirmation of signals.
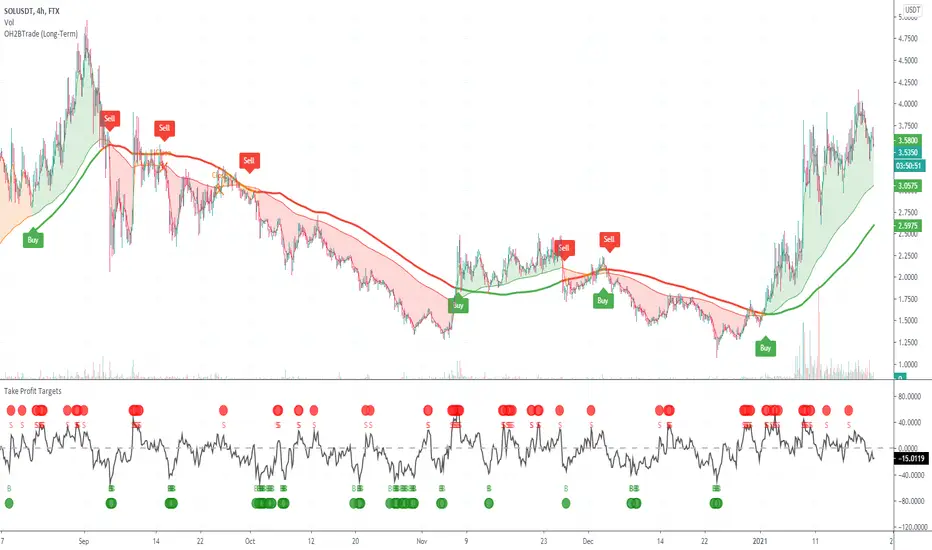
OH2B Trading Indicator for Long-Term TradingOH2B Trading Indicator
The OH2B Trading Indicator is an indicator built for beginners.
It gives you entry points for BUY and SELL based on Trend Channel and Ema-Crossover.
The Take-Profit Indicator gives you exit points for taking profits based on the Average Directional Index and Relative Strength Index.
Trading with Both Indicators
Orange Zone : Wait for the next signal from OH2B Trading Indicator.
The OH2B Trading Indicator gives you entry points for BUY or SELL .
When the ema1 crosses above ema2, the trend channel will be painted GREEN in color, and a BUY signal will appear. = BUY
When the ema1 crosses below ema2, the trend channel will be painted RED in color, and a SELL signal will appear. = SELL
When a BUY or SELL signal appears on the chart, don't rush into any trade.
Please allow a few hours for confirmation of signals .
To take profit, please follow the Take-Profit Indicator at the bottom.
RED dots are the Take-Profit targets for the BUY (long) signal
GREEN dots are the Take-Profit targets for the SELL (short) signal
*After taking profit, please set a Stoploss to at least break-even level to protect your profits.
When the price enters the Orange Zone again, you may close your trade and wait for the next signal.
If you like to keep your positions at Orange Zone, please remember to set a stop-loss alert when an opposite signal pops up on the chart.
Often the price goes to the Trendline after the signal, so keep some funds to increase the position or even open all position near the Trendline , or use it for re-enter with SL after you closed position on TPs.
Tips for the beginners:
Recommended using the indicators at 4H Timeframe .
Recommended using the indicators for Spot Trading at both Crypto and Stock Market.
Do not use leverage above 5x.
No more than 5% of the deposit in one trade.
Try to enter/exit a position by limit orders.
Do not rush into any trade when a new signal pops up, please allow a few hours for confirmation of signals.
Ichimoku Kinko Hyo SignalsIchimoku Kinko Hyo Signals
This script show signals based on my understanding in Ichimoku Kinko Hyo.
/!\ Please do not follow signals blindly and always make your own analysis /!\
Buy : Han Ne lines are up, price is up, and also stochastic (K=30, D=10) is up
Strong Buy : Is a Sanyaku Kouten and can show a potential reverse in current tendance and Buy Signal conditions
Sell : Han Ne lines are down, price is down, and also stochastic (K=30, D=10) is down
Strong Sell : Is a Sanyaku Gyakuten and can show a potential reverse in current tendance and Sell Signal conditions
Exit : Show a potential time to take profit based on previous Sell, Strong Sell, Buy, or Strong Buy signal

COTBase iCOT (Signals)COTBase iCOT indicator is based on reverse-engineering the Commitments of Traders data and creating a proprietary algo, which mimics real COT data on any time-frame and chart type.
We advise to use it mainly on time-based charts, on smaller than 4 hr per bar time-frames. A multi-time-frame analysis is recommended where the smaller time-frame signals are confirmed by the higher time-frames.
This indicator is the Signal part of the COTBase iCOT package. Please apply it to the price chart to see the yellow markers (Commercials extremes), blue bars (Speculators extremes) and 3-fold confluences (green and black background stripes).
Features:
Versatile
You can use the COTBase iCOT indicator on any chart type (eg. candlesticks , bar charts, renko, range bars, etc.) and time-frames (eg. 1-min, 5-min , 1-hr, 4-hr, etc.).
Proprietary algo
We used AI and various other methods to create a truly unique indicator that - we believe - descibes market forces the most efficient way.
We have found that this is possibly the closest we could get to a realistic estimation of the fundamental forces driving the market.
Data does not come from CFTC
The COTBase iCOT indicator does not source any of its data from the Commodity Futures Trading Commission.
Accurate signal logic
We mark "pseudo-Commercial" buy/sell setups with a yellow diamond below/above the price. We mark "pseudo-Speculator" buy/sell signals with blue bars.
The statistically best "3-fold confluence" setups are marked with green/red stripes (and/or other markers).
Key features:
Allow plotting pseudo-Commercials and Change, pseudo-Speculators and Change, Balance Line and Change.
Allow highlighting any of the above series if they cross above/below a user defined threshold
Allow configuring the strength and markings of "All Signal" confluences
Allow setting the logic for Change calculations and markings
Sound alerts
Compatibility:
Instruments: futures , cryptocurrencies, forex, stocks, CFDs, indices, options
Interval types: time and non-time-based, standard or custom
Chart styles: any
You can obtain this indicator by visiting the link below.

Open Close Cross Strategy R6.1 revised by yourmattieOriginal version: Open Close Cross Strategy R5 revised by JustUncle.
Change: script changed to a study script with custom alerts.
This revision is an open Public release, with just some minor changes. It is a revision of the Strategy "Open Close Cross Strategy R2" originally published by @JayRogers.
Revised by JustUncleL
Description :
Strategy based around Open-Close Moving Average Crossovers optionally from a higher time frame.
Read more about the indicator original script
Klik here
##USE AT YOUR OWN RISK##
Use this as overlayer on the original strategy to set custom alerts.
Info: with this study script no buy/sell arrows show up op the chart.
Does some know a solution for this issue:
Issue: sometimes it gives a false signal because even when you set "one per bar close" the custom set alert might come halfway the bar....and it might be a false signal when the bar is closed
Does somone know a fix for this? I tried with barstate.iscomfirmed but it didn't work for me.
Ps. I'm not a developer...just changed the scipt by watching a youtube tutorial.
(CoInS) Confluence of Indicators and Signals v2 skvConfluence of Indicators and Signals (CoInS) v2 skv
This time best of pivots and oscillators came to confluence to guide traders for better decision making to trade. Remember practice makes profit.
This script created for educational purpose for learners want to observe/study the indicators and its signals. Indicators HMA, SMA, Super Trend, MACD, BB, ADX/DMI/DMS, RSI, Elder Impulse and Pivots CPR, Camarilla, Floor, SQR are used in this script and the display of them controlled through the indicator settings. Values are tuned and can't be changed. Only the current day values will be displayed.
Observe the signals and reversal points at pivots or moving average lines. The bright green up triangles and bright orange down triangles indicates momentum, the faded triangles indicates the momentum is getting weak.
At start of the day, this script indicates whether today is trending or not trending for the scrip.
The SQR pivot points will move as per the trend and indicate the resistance and support level at that time. The color crosses informs that the change occurred throughout the day.
The signals generated by this study are not recommendation and use it on your own discretion after keenly observing each and every details.
Pivots
Pivot Boss CPR with width
Pivot Boss Camarilla
Pivot Boss Floor pivots
Simple and amazing SQR pivots
Displays signals from,
RSI signals
HMA signals
Super Trend
MACD (cross and histogram signals)
Elder Impulse
ADX/DMI/DMS and BB for Momentum
I'm thankful to trading view, various pine coders and authors contributing here and building wealth of knowledge.
*****Remember: Practice makes Profits*****
Disclaimer
1. Only for educational and learning purpose
2. For Intraday and scalping strategies and 5 and 15 min TF only
3. Do paper trade before using any information for actual trading
4. Not swing or positional trade
5. Use it on your own discretion and no one else responsible for the profit/loss except you

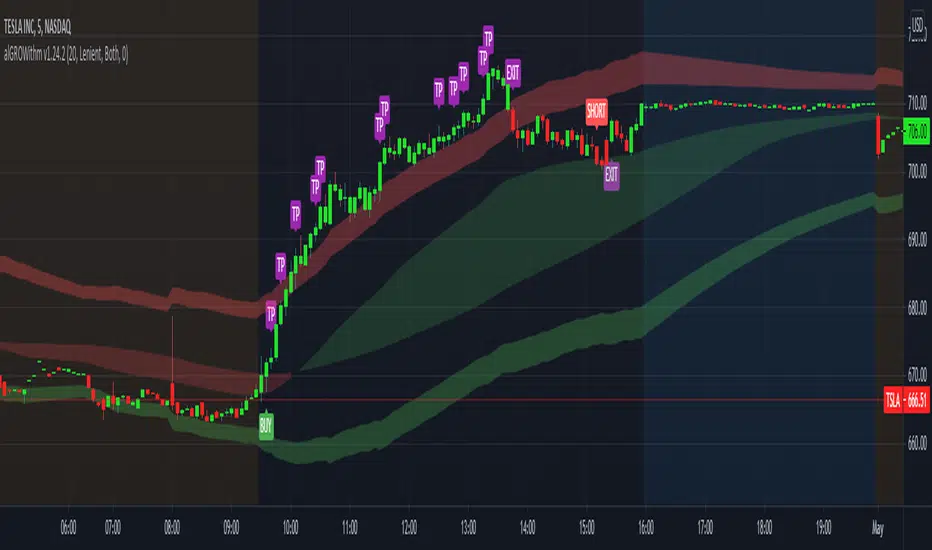
alGROWithm PremiumIntroducing the alGROWithm indicator!
Years of trading experience and endless hours of screen time has undeniably proven to me that the most fundamental rule of any market is: price moves from supply to supply and demand to demand. Specifically, this means that a breakout of a supply zone , the probability of it reaching the next supply zone before starting consolidate is very high. Similarly, a breakdown from previous demand zone will likely continue to the next demand zone . The identification method of these supply and demand channels is one of the features that sets this indicator apart from other available tools.
What separates alGROWithm from other available tools?
- Proprietary method for identifying supply & demand channels combined with a directional bias computation based on recent historical prices
- Only signaling precise entries based on supply & demand that maximize R/R
- Tracking open positions and displaying a trading plan directly on the chart immediately after signaling entry points
- Indicating precise exit levels to help you avoid exiting too early or trading by emotion
What are the features included in alGROWithm?
Trading Plan Lines : These are the Buy/Short/Take Profit/Exit lines plotted directly on the chart
Show Long Signals : These are the green "BUY" labels that appear on the chart when alGROWithm identifies a critical breakout to the next supply level
Show Short Signals : These are the red "SHORT" labels that appear on the chart when alGROWithm identifies a critical breakdown to the next demand level
Show Take Profit Signals : These are the purple "TP" labels that appear on the chart when alGROWithm identifies that the subsequent supply/ demand level has been hit
Show Exit/Stop Loss Signals : These are the purple "EXIT" labels that appear on the chart when alGROWithm identifies that the trade has run its course and it's time to exit
Show Dashboard : This is a dashboard that is displayed to the right of the latest candle, and contains the following information:
- Current Position : "Long", "Short", or "None"
- Next Profit Target : Only displays if there is an active Position
- Current Bias : alGROWithm computes a directional bias based on recent historical prices. Text will say "Long" or "Short"
- Long/Short Bias Until : alGROWithm's bias will change if this price is hit. Note that these are not BUY or SELL levels - this simply indicates whether things are looking up or down
- Enter Short/Long At : Only displays if Current Position = "None"
Note that you can enable/disable any of these chart overlays at anytime through the indicator settings.
The alGROWithm indicator works on any timeframe, any market, and standard OR Heikin Ashi candlesticks .
I have been working very hard on this indicator and I personally use it on a daily basis with options trading. I am so excited to share the wealth with you!
You can use the link below to visit our website and gain access to the script.
[fareid] Quick Backtest Framework█ OVERVIEW
This Framework allows Pine Coders to quickly code Study() based signal/strategy and validate its viability before proceed to code with more advance/complex customized rules for entry, exit, trailstop, risk management etc..
This is somewhat an upgraded version of my earlier personal template with different strategy used, cleaner code
and additional features.
█ USE CASES
- You have an idea for trade signal and need a quick way to verify its potential before writing lengthy/complicated code
- You found a study script for trading signal in public library and want to validate it profitability with minimum effort before including it in your trading playbook
█ FEATURES
- Alert: Ready to use alert function based on signals from your custom indicator.
- Visual Backtest: Auto-plot entry, stop-loss and take profit for simple strategy performance analysis
- Backtest Statistic: Provide basic key metrics based on backtest strategy
- BTE External Signal Protocol: Ready to use code that will supply required state to PineCoders Backtesting & Trading Engine if you wish to have more advance and sophisticated backtesting engine
Notes: All of the above features have On/Off toggle
█ Description & How To Use
This Framework consist of 5 Modules but you only need to edit the first 2 Modules:
Module1: Indicator
Module2: Framework Input Protocol
Module3: Alert
Module4: Backtest
Module5: Backtest & Trading Engine
Tips: The source-code includes collapsible block by module for easy navigating
Module1: Indicator:
-----------------------------------------------------------------------------------
Main Module. Place custom indicator input parameter/calculation/indicator plotting here
Sample Strategy: Double MACD Crossover
MACD Signal: 1st MACD Cross above signal line indicate Buy Signal
1st MACD Cross below signal line indicate Sell Signal
MACD Filter: 2nd MACD is above 0 line indicate Uptrend
2nd MACD is below 0 line indicate Downtrend
Module2: Framework Input Protocol:
-----------------------------------------------------------------------------------
Use this module to connect main indicator/signal calculated in Module1 to the rest of the framework's module
4 variables needed to be defined here:
1. Uptrend
2. Dntrend
3. BuySignal
4. SellSignal
i'm not sure how to place a code snippet here to show you example so in the source code i already put a comment in Module2 on which part u need to edit. I hope its pretty simple to use.
Module3: Alert Module Description:
-----------------------------------------------------------------------------------
As long as the variables in Module2 properly defined, the alert module is ready to use without any further modification.
Input:
Enable Alert --> Enable TV's alert and plot signal to chart
Alert Type --> Set to take Buy only, Sell only or Both alert
Module4: Backtest Module Description:
-----------------------------------------------------------------------------------
As long as the variables in Module2 properly defined, the backtest module is ready to use without any further modification.
Input:
Backtest Stat --> Enable Backtest Statistic Label
Backtest Visual --> Enable Backtest visual simulation
Backtest Type --> Set to take Buy only or Sell only or both
SL Type -->
ATR : Set SL in ATR times Multiplier below entry price
Fixed : Set SL in fixed point below entry point (in 'Dollar'). e.g. for Stocks -> 0.5 equals to 50cent while for EURUSD currency -> 0.005 equal to 50 pips
HiLo Bar: Set SL at highest/lowest wick of previous bar plus/minus Fixed point. e.g. EURUSD HiLo=3 and Fixed Point = 0.0005, buy trade will place SL 5 Pips below lowest of previous 3 bar
SL ATR Multi --> Set Lookback Period used for SL's ATR calculation
SL ATR Multi --> Set ATR Multiplier for SL
SL Fixed --> Set Fixed Level for SL
SL Bar --> Set Number of previous bar to check for SL placement
TP RR Ratio --> Set TP based on RR multiplier. e.g. 2 means TP level will be twice further from entry point compared to Entry-SL distance.
Notes: The point is for preliminary testing, so it only supports 1 trade at a time and no Trailing Stop
Module5: Backtest & Trading Engine Description:
-----------------------------------------------------------------------------------
As long as the variables in Module2 properly defined, the Pinecoders BTE module is ready to use without any further modification.
Input:
External Signal Protocol --> Set ESP State to send to "Backtesting & Trading Engine "
Signal With Filter --> Use this to send entry signal that already filtered by this study indicator (without stoploss level)
Signal Without Filter --> Use this to send raw entry signal that are NOT YET FILTERED by this study indicator (without stoploss level)
Signal and Stop With Filter --> Use this to send entry signal WITH StopLoss that already filtered by this study indicator (with stoploss level)
Signal and Stop Without Filter --> Use this to send raw entry signal WITH StopLoss that are NOT YET FILTERED by this study indicator (with stoploss level)
Notes: Backtesting & Trading Engine already have built-in Filter, Entries and Stop Level. e.g. Unselect all their filter state if only want to use custom filter and make sure send Signal with Filter (with or without SL level)
█ DISCLAIMER:
This framework main objective is to create my personal indicator template so that i just have to modify the indicator module for preliminary testing in future.
The sample strategy included are for educational purpose only. Use at your own risk
credit: LucF/PineCoders for a lot of his scripts that i use as a guide to complete this

MACD With Trend Filter: Visual Backtest Module TemplateSample Strategy: MACD Crossover with trend filter options
MA Filter : Price Close Above MA, Search for Buy, Price Close Below MA, Search for Sell
ADX Filter : Take trade only when ADX is above certain treshold
MACD Signal : MACD Cross above signal line while under 0 line indicate Buy Signal
MACD Cross below signal line while above 0 line indicate Sell Signal
-----------------------------
Using Alert Module:
Enable Alert --> Enable TV's alert and plot signal to chart
Alert Type --> Set to take Buy only, Sell only or Both alert
----------------------------
Using Backtest Module:
Enable Backtest --> Enable Backtest simulation
Backtest Type --> Set to take Buy only, Sell only or Both
SL Type -->
ATR : Set SL in ATR times Multiplier below/above entry price
Fixed : Set SL in fixed point below entry point (in 'Dollar'). e.g. for Stocks -> 0.5 equals to 50cent while for EURUSD currency -> 0.005 equal to 50 pips
HiLo Bar : Set SL at highest/lowest wick of previous bar plus/minus Fixed point. e.g. EURUSD HiLo=3 and Fixed Point = 0.0005, buy trade will place SL 5 Pips below lowest of previous 3 bar
SL ATR Period --> Set Lookback Period used for SL's ATR calculation
SL ATR Multi --> Set ATR Multiplier for SL
SL Fixed --> Set Fixed Level for SL (Use when SL Type is either Fixed or HiLo Bar)
SL Bar --> Set Number of previous bar to check for SL placement
TP RR Ratio --> Set TP based on RR multiplier. e.g. 2 means TP level will be twice further from entry point compared to Entry-SL distance.
Notes: The point is for preliminary testing, so it only supports 1 trade at a time and no Trailing Stop
----------------------------
Disclaimer:
This script main objective is to create my personal indicator template so that i just have to modify the indicator module for preliminary testing in future.
Testing Alert Module so i can re-use it as template in future study/indicator
Testing Visual Backtest Module so i can re-use it as template in future study/indicator
i believe using Strategy function is a better approach for this but the entry/exit level seems to be hit n miss (at least for me, still trying to figure what i did wrong)
also, i rather code the strategy in other platform where i can use the more accurate tick data if i want to validate backtest statistics.
My study scripts was built only to test/visualize an idea to see its viability and if it can be used to optimize existing strategy.
credit: ADX code are originally from "ADX and DI" by @BeikabuOyaji although i re-wrote so i can have cleaner read and use RMA instead of SMA
